

To Strengthen Economic Security, Policymakers Should Expand the Child Tax Credit to the 19 Million Children Who Receive Less Than the Full Credit Amount
Child Tax Credit Helps Make Raising Children More Affordable, and Its Full Value Should Be Available to Families With Lower Incomes
Every family should have a strong foundation of economic security that lets them meet their needs and support their children, whether they live in rural communities or big cities, whether parents and caregivers are working for pay; are unable to work due to health conditions or caregiving responsibilities; or are between jobs, which happens frequently, particularly for low-paid workers. Policymakers play a huge role in strengthening or weakening families’ economic security through the laws they pass and the actions they take.
For policymakers who want to address affordability concerns, the Child Tax Credit is a proven, bipartisan tool to strengthen families’ economic security that can and should be improved. Lawmakers should make the full credit available to children in families with low and moderate incomes, as they did in the American Rescue Plan Act’s temporary expansion of the credit for tax year 2021. Research done at the time showed that the vast majority of families with low and moderate incomes spent some or all of the additional income from the expanded Child Tax Credit ($3,600 per child under age 6 and $3,000 per child ages 6-17) on essentials like food, housing, utilities, and clothing. Combined with other forms of COVID-19 pandemic relief, the expanded Child Tax Credit helped drive the child poverty rate down to record lows in 2021.
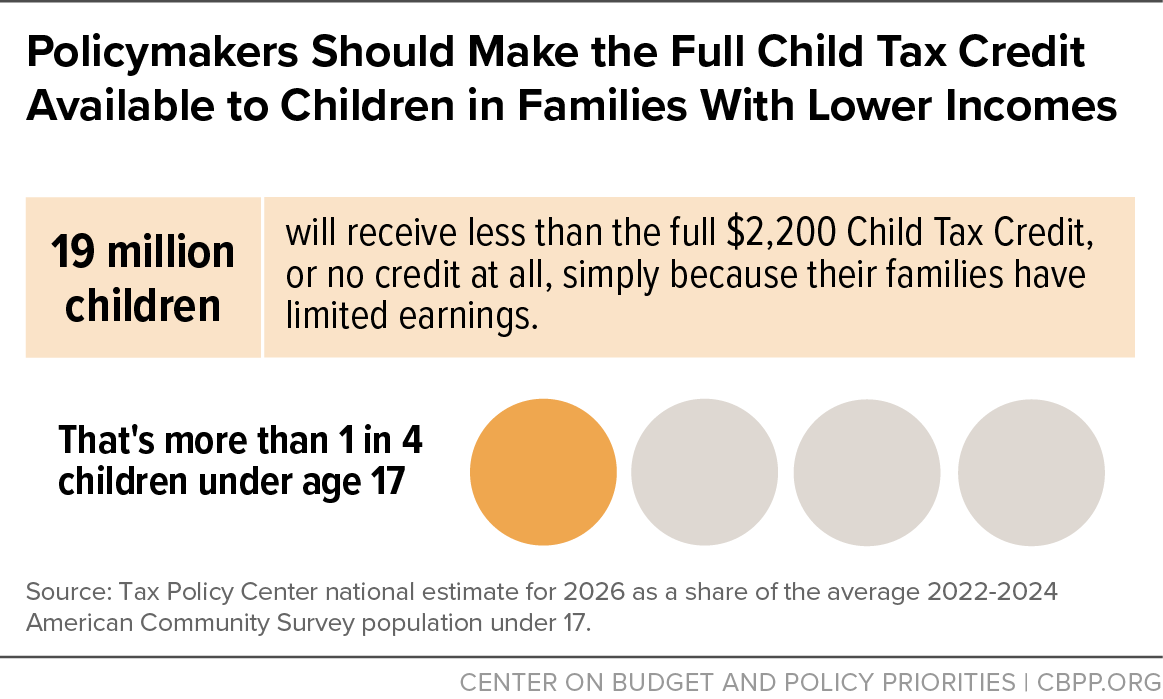
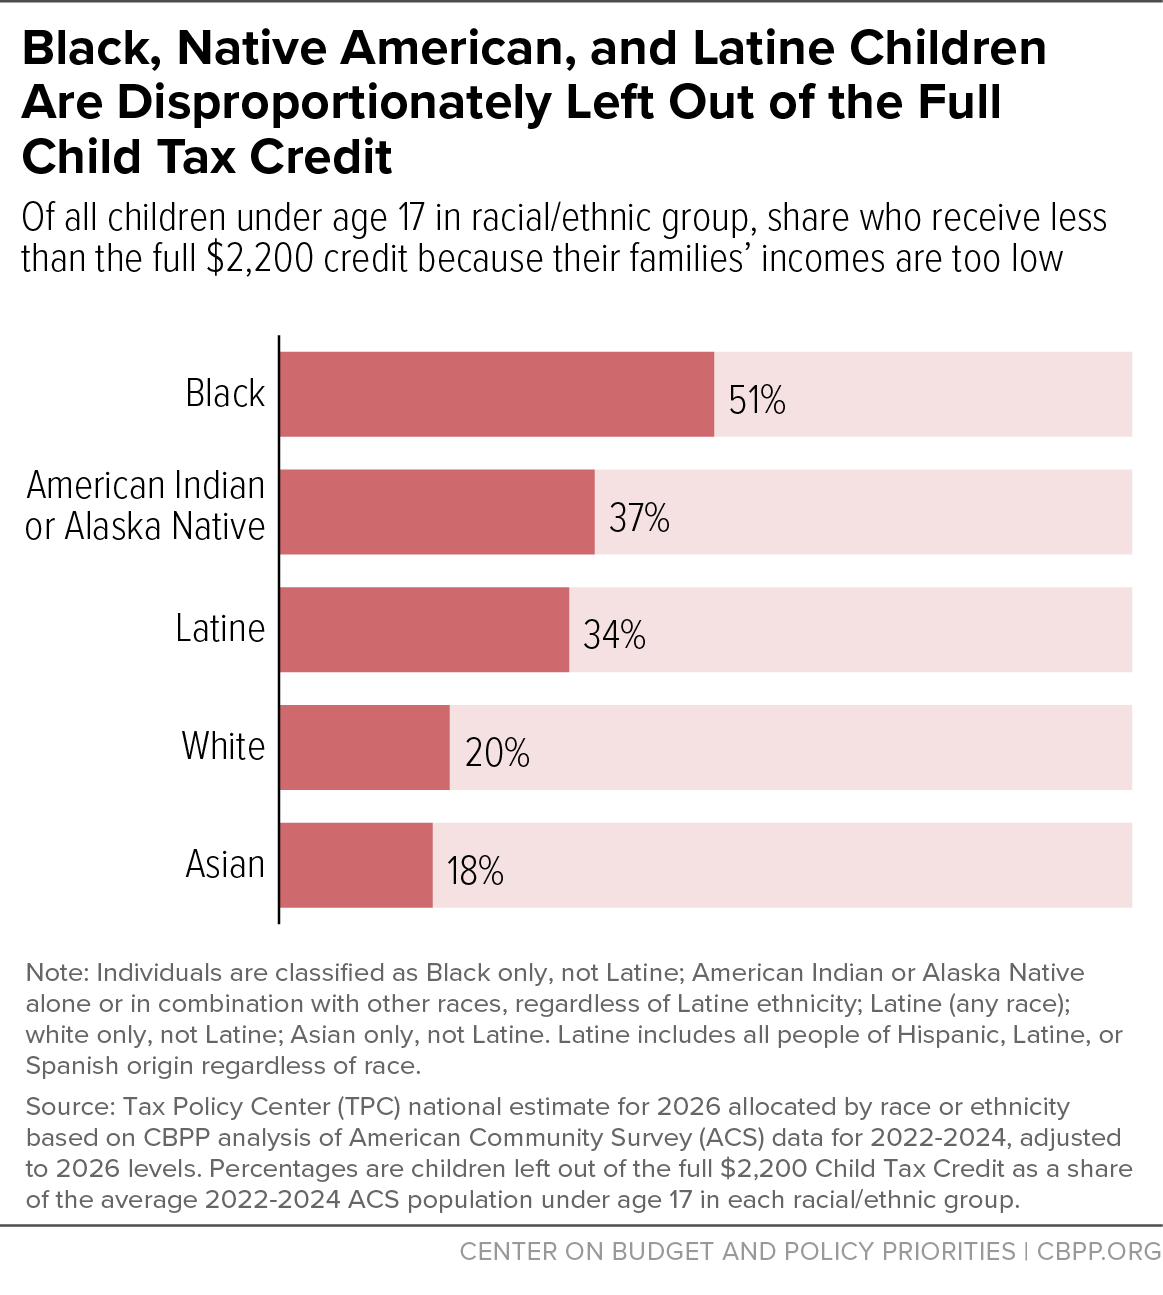
The Child Tax Credit expansion enacted in the 2025 Republican reconciliation law left an estimated 19 million children under age 17 out of the full $2,200 Child Tax Credit, simply because their families’ incomes are too low. (See Figure 1.) This represents more than 1 in 4 children under age 17 who are excluded from the full value of the Child Tax Credit — the vast majority of whom are in working families. More than half of Black children, more than 1 in 3 American Indian and Alaska Native children, and more than 1 in 3 Latine children are left out of the full credit because their families’ incomes are too low; about 1 in 5 white children and Asian children also get less than the full credit. The credit needs improvement so it can provide more meaningful support to families with children struggling the most to afford the basics.

Families were already struggling to afford essentials such as food, health care, housing, child care, and utilities, and actions by the Trump Administration and congressional Republicans have worsened economic security, especially for families with lower incomes. The 2025 Republican reconciliation law is taking food assistance and health care away from millions of people to help pay for tax cuts that favor the wealthy and the Trump Administration’s massive and cruel detention and deportation operation. In a targeted attack on immigrant families, the reconciliation law took away Child Tax Credit eligibility from children who don’t have at least one parent with a Social Security number (SSN). On top of the law, Trump’s haphazard tariffs have increased the price of food, clothes, and other consumer goods, and Trump’s war in Iran has significantly raised gas prices, further increasing expenses for families.
Permanently expanding the Child Tax Credit so its full value reaches families with lower incomes, and reinstating the credit for all children, regardless of whether they or their parents file taxes using an Individual Taxpayer Identification Number (ITIN) or an SSN, are key ways that lawmakers can strengthen economic security for families across the country and children of all races. Proposals to extend the credit’s reach to families with low and moderate incomes have had bipartisan support and policymakers should act.
Families With Lower Incomes Hit Hardest by Affordability Crisis
People routinely cite “affordability” as their top concern in public opinion polls, and families with low and moderate incomes are struggling with affordability the most.[1] Among households with incomes in the bottom half of the income distribution, 1 in 4 reported either experiencing food insecurity or not being able to pay their rent, mortgage, or utility bill in 2023 (the most recent available data), compared with about 1 in 12 of households with incomes in the top half of the income distribution — three times the rate.[2] These challenges stem from both limited income — due to long-standing structural issues with the low-paid labor market – and price increases.
The low-paid labor market is characterized by volatile earnings, a lack of paid family or medical leave, a stagnant federal minimum wage, limited wage growth, and erratic hours that make finding stable child care difficult. These conditions often mean that it is hard for people working low-paid jobs to meaningfully increase their incomes, even if they want to work more hours.[3]

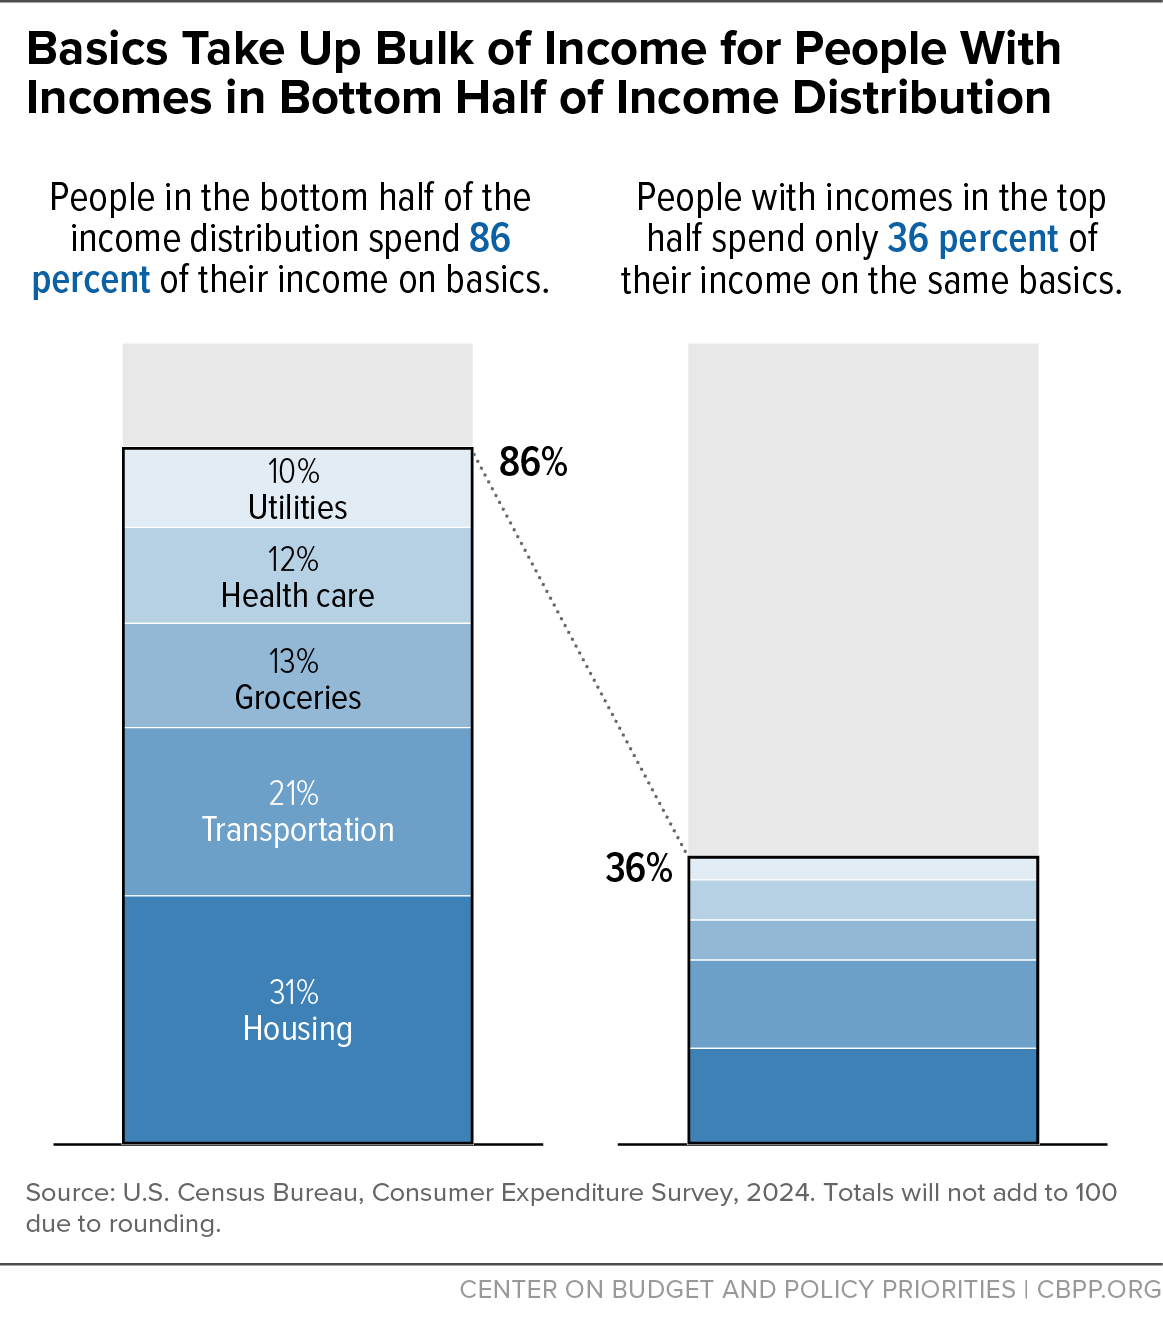
At the same time, prices have been rising, including those for many essential items.[4] Families with lower incomes are hit harder by price increases because they spend a large share of their income on necessities, such as groceries. It can be challenging for them to cut these purchases without making difficult tradeoffs; in other words, they have less room in their budgets where they can cut back. Households with incomes in the bottom half of the distribution spend on average $6 out of every $7 – or 86 percent of their income – on basic items in five key areas: utilities, groceries, health care, transportation, and shelter. Households with incomes in the top half of the income distribution, on the other hand, spend only 36 percent (or $2.50 out of every $7) of their income on these basic items.[5] (See Figure 2.)
Actions by the Administration and congressional Republicans have worsened these affordability challenges.[6] The unprecedented cuts to Medicaid in the 2025 reconciliation law and failure to extend Premium Tax Credit enhancements, which help people purchase health insurance through the Affordable Care Act (ACA) marketplace, mean that roughly 15 million people will lose their health coverage, based on estimates by the Congressional Budget Office.[7] Historic cuts to SNAP are projected to terminate or substantially cut SNAP food benefits for about 4 million people in a typical month once the changes are fully implemented, based on Congressional Budget Office (CBO) estimates.[8] Early data show that, as expected, millions of people are losing health coverage, and impacts on SNAP participation are even larger than predicted.[9]
The Administration’s tariffs have raised the price of imported goods, including clothes, cars, food, and inputs for other goods, making it more expensive for families to get to work, put food on the table, and buy clothes for their children. Families with the lowest incomes have been hardest hit by tariff-driven price increases as well as by the reconciliation law’s changes, seeing the largest decline in household resources measured as a share of their income.[10] And families now have to contend with yet another expense: high gas prices stemming from the war in Iran. The retail price for regular gasoline in recent months has been about 20 to 40 percent higher than one year prior.[11]
Making life more manageable for families in the face of these affordability challenges can take the form of reducing the price of goods, increasing people’s incomes, or both. Policymakers have proven tools that can increase families’ incomes, which can make essentials more affordable even if the costs for specific items do not drop, by increasing their purchasing power. Expanding the Child Tax Credit for children in families with lower incomes would boost families’ after-tax income and let them spend money on the items their families most need.
2025 Reconciliation Law’s Child Tax Credit Changes Leave Behind 19 Million Children and Deny Credit to Children With Immigrant Parents
The Child Tax Credit can be a powerful tool when it is structured to better reach families with lower incomes. However, the structure of the Child Tax Credit has long-standing flaws — giving children in families with lower incomes a smaller credit than families with higher incomes. The reconciliation law did nothing to improve this design, so these flaws remain:
- The credit phases in slowly at 15 cents per dollar earned, regardless of the number of children in a family, meaning that many lower-income families with two or three children receive the same total credit as a family with one child at the same earnings level, and others receive only a modestly higher total amount;
- Families receive no credit for income earned below $2,500; and
- There is a lower maximum credit amount that families can receive as a refund — $1,700 per child for tax year 2026 (compared to the $2,200 per-child credit amount available to families with higher incomes).
Republican policymakers chose not to address these structural issues with the credit in the 2025 reconciliation law and instead enacted changes that exacerbate the gap between the credit that families with lower incomes can receive and the credit that families with higher incomes can receive. The reconciliation law permanently increased the maximum credit from $2,000 to $2,200 per child, starting in tax year 2025, and indexed the credit amount for inflation starting in tax year 2026.[12] Because the law left in place the lower maximum credit that families could receive as a refund — $1,700 for tax year 2025, indexed for inflation — the reconciliation law widened the gap between these amounts from $300 to $500 per child.[13]
The reconciliation law also took the credit away from children who are U.S. citizens or have a lawful immigration status unless at least one of their parents has an SSN.[14] This change is more restrictive than the 2017 law enacted by Republicans during the first Trump Administration, which took eligibility for the credit away from children who used an ITIN rather than an SSN.[15] Roughly 2.7 million children who are U.S. citizens would have their eligibility taken away by the reconciliation law, by one estimate.[16] Policymakers should reverse this new restrictive policy.
More Than 1 in 4 Children Are Excluded From the Full Value of the Child Tax Credit, With Black, Latine, and American Indian and Alaska Native Children Disproportionately Left Out
An estimated 19 million children under age 17 will receive less than the full $2,200 Child Tax Credit, or none at all, this year simply because their families have low or moderate incomes. This represents more than 1 in 4 children under age 17 across the country — the vast majority of whom are in working families. For example, a single parent with two children would have to earn at least $34,150 for tax year 2026 to receive the full credit — or about $16.42 per hour working 40 hours a week for a full 52 weeks (with no unpaid leave). That’s more than the minimum wage in 46 states, and many people working for low pay are not offered 40 hours consistently each week or have access to paid leave.[17] A married couple with two children would have to earn at least $42,200.

Children under age 17 who are left out of the full credit include those whose families often face the effects of past and current discrimination and other barriers to opportunity that have left them overrepresented in low-paying work: more than half of Black children, more than 1 in 3 American Indian and Alaska Native children, and more than 1 in 3 Latine children are left out of the full credit. About 1 in 5 white children and Asian children also get less than the full credit. (See Figure 3; see Appendix Table 1 for estimates of these children by state.)
Children left out of the full credit have parents who work in a wide range of low-paid occupations throughout the country. They work in various jobs across the care sector, caring for other people’s children as child care workers and teaching assistants, and caring for people who are sick or older as nursing assistants and personal care and home health aides. They also contribute to their communities as cashiers and construction workers. An estimated 776,000 children left out of the full credit have parents who are veterans and have family incomes low enough that they don’t qualify for the full credit.[18]
The credit’s structure disproportionately disadvantages children who live in rural (that is, non-metropolitan) communities. More than 1 in 3 children under age 17 living in rural communities would get less than the full $2,200 Child Tax Credit because their families’ incomes are too low, while in metropolitan (metro) areas, a smaller but still substantial share — more than 1 in 4 children under age 17 — would get less than the full credit.[19] Families in rural communities are particularly hurt by the credit’s flawed structure, largely because pay tends to be lower in rural areas; in 2024, median pay in rural areas was roughly 18 percent lower than in metro areas.[20]
Children in rural areas left out of the full credit reflect the racial diversity of rural communities across the country. Among children in rural areas who receive less than the full Child Tax Credit, about 16 percent are Latine, 15 percent are Black, and 8 percent are American Indian or Alaska Native — each group overrepresented compared with their share of the rural population of children under age 17. About 56 percent of these children are white.[21]
The reconciliation law’s changes to the credit largely left out children in families with low and moderate incomes despite evidence that additional income can make a meaningful difference for these children. Many studies on tax credits similar to the Child Tax Credit find evidence linking the additional income to improved health and educational outcomes during childhood, and increased educational attainment, employment, and earnings in young adulthood.[22] Evidence from a wide range of income support programs also shows another important benefit of strengthening families’ economic security — reducing involvement in the child welfare system.[23] (See text box, “Evidence Links Additional Income to Reduced Involvement in the Child Welfare System.”)
Policymakers Should Help Improve Economic Security by Expanding Child Tax Credit for Families With Lower Incomes
One of the best ways to improve economic security for families with low and moderate incomes would be for policymakers to ensure that the 19 million children left out of the full Child Tax Credit are eligible for the full $2,200 amount that higher-income families receive (often referred to as making the credit “fully refundable”). Making the full $2,200 credit available to families with lower incomes would have a meaningful impact on child poverty, reducing the number of children in families with incomes below the poverty line by 1.2 million this year.[24]
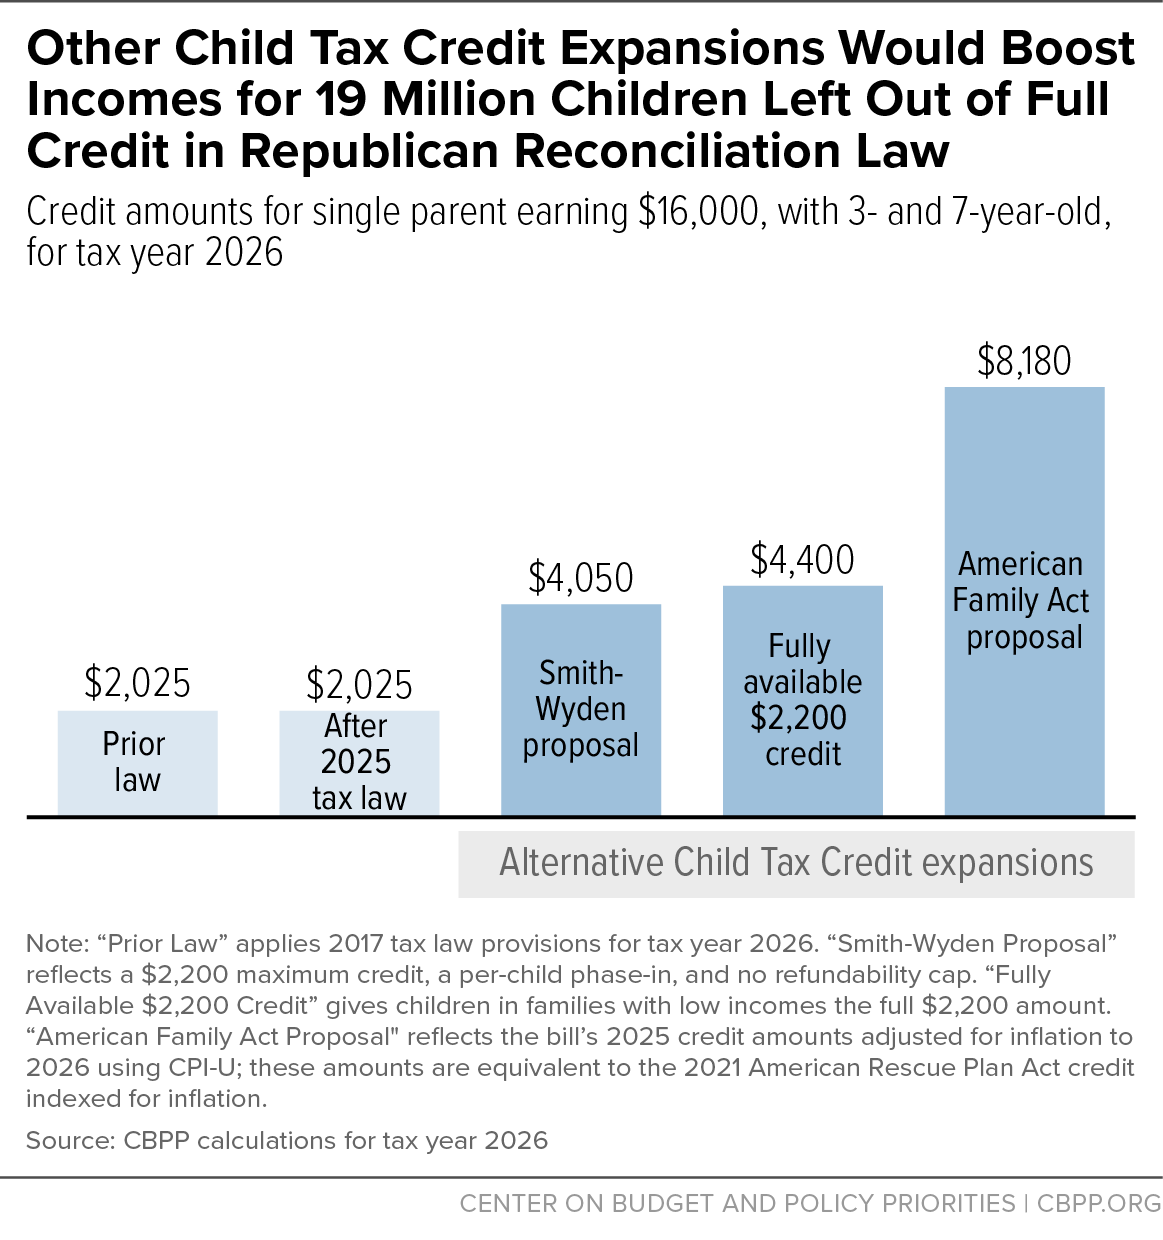
To understand how this credit expansion would help a lower-income family, consider a single parent working part-time as a cashier and being paid $16,000, with a 3-year-old and a 7-year-old, who is struggling to pay their utility bills and afford gas to get to work. The family will receive a $2,025 Child Tax Credit for tax year 2026 under the reconciliation law — the same amount they would have received under prior law. But if the family instead were eligible for the full Child Tax Credit, they would see their credit more than double — to $4,400 — better supporting them in meeting their children’s basic needs.
Congress has made the full credit available to families with lower incomes before, with great success. The American Rescue Plan Act (ARPA) included a temporary change that provided children in families with lower incomes the same credit amount as families with higher incomes for tax year 2021. ARPA also increased the maximum credit to $3,600 per child under age 6 and $3,000 per child age 6-17 and provided part of the credit through monthly payments. This expanded credit played an important role in supporting families with lower incomes; the single-parent, two-child family described above would have received a $6,600 credit. Research done at the time showed that the vast majority of families with low and moderate incomes spent some or all of the additional income from the expanded Child Tax Credit on essentials like food, housing, utilities, and clothing.[25] Combined with other forms of pandemic relief, the expanded Child Tax Credit helped drive the child poverty rate down to record lows in 2021.[26]
The recent American Family Act (AFA) proposal, introduced by Representatives Rosa DeLauro and Susan DelBene, and Senator Michael Bennet and others, would also provide children in families with lower incomes the full credit amount, substantially reducing child poverty.[27] The bill would build on the 2021 expansion by updating the maximum credit levels to account for inflation since 2021 and introducing a baby bonus that would help families afford the costs of a new child during the first year of a child’s life.
While policymakers should once again make the full Child Tax Credit available to families with lower incomes, a recent bipartisan alternative would make solid progress toward that goal by addressing some of the current credit’s structural flaws. Just two years ago, in January 2024, legislation introduced by House Ways and Means Chair Jason Smith and then-Senate Finance Committee Chair Ron Wyden passed the House by a wide margin — including votes from 169 House Republicans — but Senate Republicans blocked the bill.[28] While not making the full credit available to all children in families with low incomes, it made significant progress through a couple of changes:
- It phased the credit in at 15 percent per child, rather than per family, ensuring that families with lower incomes would receive the same credit for each of their children, as higher-income families do, and removing the penalty for larger families.
- It increased, and then effectively ended, the lower maximum credit amount that can be refunded.

Together, these reforms would have expanded the credit for more than 80 percent of the children who were left out of the full credit in its first year. When fully implemented, in 2025, the legislation would have reduced the number of children with incomes below the poverty line by half a million or more.[29]
To understand the Smith-Wyden legislation’s potential impact, consider the family introduced above — a single parent being paid $16,000, with two children. If policymakers had included the expansion as proposed in the bipartisan Smith-Wyden bill in the 2025 reconciliation law, the family’s credit for tax year 2026 would have increased from $2,025 to $4,050. (See Figure 4.)
Another bipartisan bill sponsored by Senators Todd Young and Maggie Hassan proposes a more modest structural change that would phase in the credit starting at the first dollar of a family’s earnings.[30] This proposal complements the Smith-Wyden bill; combining these proposals would further expand the credit for the children currently left out of the full credit.
Policymakers play a critical role in families’ economic security. They should prioritize expanding the Child Tax Credit for families with low and moderate incomes, focusing limited resources where they will have the greatest impact — on families with the greatest needs.
| Appendix table 1 | |||||||
|---|---|---|---|---|---|---|---|
More Than 19 Million Children Are Left Out of the 2025 Reconciliation Law’s Full $2,200 Child Tax Credit and Would Benefit From a Fully Refundable Credit | |||||||
| Estimates of children under age 17 by state, race, and ethnicity for tax year 2026 | |||||||
| Total | White | Latine | Black | Asian | American Indian or Alaska Native | Another race or multiple races | |
| Total U.S. | 19,300,000 | 6,283,000 | 6,199,000 | 4,430,000 | 632,000 | 819,000 | 1,291,000 |
| Of all children in racial/ethnic group, percent left out | 28% | 20% | 34% | 51% | 18% | 37% | 26% |
| Alabama | 413,000 | 155,000 | 40,000 | 188,000 | 2,000 | 8,000 | 23,000 |
| Alaska | 41,000 | 8,000 | 4,000 | N/A | N/A | 22,000 | N/A |
| Arizona | 426,000 | 94,000 | 235,000 | 30,000 | 5,000 | 59,000 | 17,000 |
| Arkansas | 251,000 | 117,000 | 34,000 | 70,000 | N/A | 9,000 | 21,000 |
| California | 2,212,000 | 291,000 | 1,448,000 | 168,000 | 165,000 | 96,000 | 113,000 |
| Colorado | 224,000 | 74,000 | 105,000 | 21,000 | 4,000 | 12,000 | 14,000 |
| Connecticut | 151,000 | 33,000 | 73,000 | 28,000 | 5,000 | 4,000 | 11,000 |
| Delaware | 48,000 | 11,000 | 12,000 | 18,000 | N/A | N/A | 5,000 |
| District of Columbia | 42,000 | N/A | N/A | 34,000 | N/A | N/A | N/A |
| Florida | 1,171,000 | 323,000 | 375,000 | 358,000 | 21,000 | 22,000 | 83,000 |
| Georgia | 737,000 | 194,000 | 114,000 | 354,000 | 16,000 | 17,000 | 48,000 |
| Hawai‘i | 71,000 | 6,000 | 13,000 | N/A | 10,000 | N/A | 39,000 |
| Idaho | 102,000 | 65,000 | 27,000 | N/A | N/A | 5,000 | 4,000 |
| Illinois | 662,000 | 195,000 | 203,000 | 192,000 | 20,000 | 22,000 | 42,000 |
| Indiana | 416,000 | 214,000 | 68,000 | 79,000 | 12,000 | 10,000 | 35,000 |
| Iowa | 155,000 | 89,000 | 22,000 | 21,000 | N/A | 5,000 | 16,000 |
| Kansas | 150,000 | 73,000 | 42,000 | 15,000 | N/A | 7,000 | 13,000 |
| Kentucky | 356,000 | 242,000 | 29,000 | 46,000 | 4,000 | 10,000 | 27,000 |
| Louisiana | 422,000 | 121,000 | 34,000 | 225,000 | 3,000 | 9,000 | 31,000 |
| Maine | 55,000 | 43,000 | 2,000 | N/A | N/A | 2,000 | 4,000 |
| Maryland | 235,000 | 50,000 | 42,000 | 109,000 | 11,000 | 6,000 | 19,000 |
| Massachusetts | 264,000 | 80,000 | 105,000 | 36,000 | 13,000 | 7,000 | 27,000 |
| Michigan | 634,000 | 309,000 | 70,000 | 182,000 | 12,000 | 20,000 | 47,000 |
| Minnesota | 215,000 | 82,000 | 34,000 | 52,000 | 14,000 | 20,000 | 18,000 |
| Mississippi | 292,000 | 85,000 | 14,000 | 173,000 | N/A | 6,000 | 15,000 |
| Missouri | 370,000 | 207,000 | 35,000 | 85,000 | 5,000 | 12,000 | 30,000 |
| Montana | 54,000 | 31,000 | 7,000 | N/A | N/A | 15,000 | N/A |
| Nebraska | 97,000 | 45,000 | 27,000 | 11,000 | N/A | 5,000 | 6,000 |
| Nevada | 190,000 | 35,000 | 88,000 | 33,000 | 9,000 | 9,000 | 20,000 |
| New Hampshire | 31,000 | 23,000 | 5,000 | N/A | N/A | N/A | N/A |
| New Jersey | 390,000 | 105,000 | 161,000 | 87,000 | 14,000 | 9,000 | 19,000 |
| New Mexico | 173,000 | 25,000 | 112,000 | N/A | N/A | 36,000 | 3,000 |
| New York | 1,183,000 | 375,000 | 394,000 | 236,000 | 96,000 | 31,000 | 71,000 |
| North Carolina | 668,000 | 218,000 | 135,000 | 227,000 | 13,000 | 34,000 | 49,000 |
| North Dakota | 31,000 | 15,000 | N/A | N/A | N/A | 7,000 | N/A |
| Ohio | 749,000 | 378,000 | 68,000 | 206,000 | 13,000 | 19,000 | 70,000 |
| Oklahoma | 319,000 | 129,000 | 68,000 | 37,000 | 6,000 | 71,000 | 19,000 |
| Oregon | 189,000 | 92,000 | 65,000 | 6,000 | 5,000 | 14,000 | 12,000 |
| Pennsylvania | 705,000 | 295,000 | 170,000 | 155,000 | 23,000 | 18,000 | 49,000 |
| Rhode Island | 39,000 | 12,000 | 19,000 | N/A | N/A | N/A | 4,000 |
| South Carolina | 366,000 | 122,000 | 45,000 | 166,000 | 2,000 | 7,000 | 27,000 |
| South Dakota | 52,000 | 20,000 | 6,000 | N/A | N/A | 22,000 | N/A |
| Tennessee | 487,000 | 234,000 | 63,000 | 143,000 | 5,000 | 12,000 | 33,000 |
| Texas | 2,193,000 | 341,000 | 1,307,000 | 395,000 | 54,000 | 54,000 | 81,000 |
| Utah | 162,000 | 88,000 | 48,000 | 6,000 | N/A | 7,000 | 12,000 |
| Vermont | 17,000 | 13,000 | N/A | N/A | N/A | N/A | N/A |
| Virginia | 410,000 | 152,000 | 64,000 | 138,000 | 15,000 | 10,000 | 34,000 |
| Washington | 308,000 | 125,000 | 98,000 | 23,000 | 17,000 | 23,000 | 31,000 |
| West Virginia | 133,000 | 108,000 | 5,000 | 7,000 | N/A | 3,000 | 9,000 |
| Wisconsin | 259,000 | 119,000 | 48,000 | 53,000 | 11,000 | 12,000 | 18,000 |
| Wyoming | 30,000 | 20,000 | 5,000 | N/A | N/A | 2,000 | 2,000 |
Notes: Estimates count children under age 17 in families that lack income or have income too low to receive the maximum $2,200 per child, excluding those who do not meet the 2025 reconciliation law’s requirement that children and at least one parent have a Social Security number. Figures are rounded to the nearest 1,000. N/A indicates reliable data are not available due to small sample size (fewer than 30 unweighted households); data are included in totals. Figures may not sum to totals due to group overlap, lack of reliable data in certain cells, and/or rounding. Percentages in the “Total U.S.” row represent the share of all children under age 17 in that racial/ethnic group getting less than the full $2,200 Child Tax Credit. Individuals are classified as white only, not Latine; Latine (any race); Black only, not Latine; Asian only, not Latine; American Indian or Alaska Native alone or in combination with other races, regardless of Latine ethnicity (AIAN); or another race or multiple races, not Latine. Latine includes all people of Hispanic, Latine, or Spanish origin regardless of race. AIAN estimates are particularly sensitive to definition; AIAN figures here include those who share another race or ethnicity. (A total of 2.2 million children under age 17 are identified as AIAN alone or in combination with other races, regardless of Latine ethnicity. If we apply the non-overlapping categories this report uses for other groups, about 400,000 children under age 17 are considered AIAN alone, not Latine; an estimated 217,000 of these children would get less than the full $2,200 Child Tax Credit.) Children in the five U.S. Territories — Puerto Rico, Guam, U.S. Virgin Islands, Northern Mariana Islands, and American Samoa — are not included due to data limitations. Source: Tax Policy Center (TPC) national estimate for 2026 allocated by state and race or ethnicity based on CBPP analysis of American Community Survey (ACS) data for 2022-2024, using 2026 tax parameters and incomes adjusted to 2026 projected levels. Percentages listed in the “Total U.S.” row are children left out of the full $2,200 Child Tax Credit as a share of the average 2022-2024 ACS population under age 17 in each racial/ethnic group. We use February 2026 Congressional Budget Office projections to adjust income for inflation through 2026 and further adjust earnings and rental, interest, and dividend income for real growth. TPC, “T25-0258 – Distribution of Tax Units, Children, and Dependents by Size of Child Tax Credit (CTC), 2026,” August 5, 2025, https://taxpolicycenter.org/model-estimates/T25-0258. | |||||||
End Notes
[1] Brendan Duke, “A Framework to Evaluate Affordability Proposals,” CBPP, June 15, 2026, https://www.cbpp.org/research/federal-budget/a-framework-to-evaluate-affordability-proposals.
[2] CBPP analysis of Survey of Income and Program Participation (SIPP) data for 2023. SIPP data show median annual income in 2023 was $80,160.
[3] Kristin F. Butcher and Diane Whitmore Schanzenbach, “Most Workers in Low-Wage Labor Market Work Substantial Hours, in Volatile Jobs,” CBPP, July 24, 2018, https://www.cbpp.org/research/poverty-and-inequality/most-workers-in-low-wage-labor-market-work-substantial-hours-in. Lauren Bauer, Chloe East, and Olivia Howard, “Low-income workers experience—by far—the most earnings and work hours instability,” Brookings, January 9, 2025, https://www.brookings.edu/articles/low-income-workers-experience-by-far-the-most-earnings-and-work-hours-instability/.
[4] “The cost of essential goods and services is rising faster than earnings. Since 2017, average earnings have grown about 43 percent nationwide. Over the same period, home sale prices have increased 81 percent and rents 54 percent. The lowest-cost Silver health plan on the Affordable Care Act Marketplace has risen 77 percent, and child care costs have grown dramatically.” Urban Institute, “The American Affordability Tracker,” updated April 2, 2026, https://www.urban.org/data-tools/american-affordability-tracker.
[5] CBPP analysis of Bureau of Labor Statistics Consumer Expenditure Survey (CE) data for 2024 at https://www.bls.gov/cex/tables/calendar-year/mean-item-share-average-standard-error/cu-income-deciles-before-taxes-2024.xlsx. CE data show median annual income in 2024 was $74,000. The listed categories do not include other essentials, such as clothes or household items like diapers, paper towels, and cleaning supplies.
[6] Brendan Duke, “Trump Administration, Congressional Republicans Are Worsening Affordability Challenges in Many Ways,” CBPP, December 18, 2025, https://www.cbpp.org/research/poverty-and-inequality/trump-administration-congressional-republicans-are-worsening.
[7] See “Taking Away Health Care: Huge coverage losses, higher costs for consumers, and new costs shifted to states” in “A Record of Historic Harm in the First Year of Trump’s Second Term,” January 14, 2026, CBPP, https://www.cbpp.org/research/federal-budget/a-record-of-historic-harm-in-the-first-year-of-trumps-second-term#huge-coverage-losses-cbpp-anchor.
[8] CBPP, “By the Numbers: Harmful Republican Megabill Takes Food Assistance Away From Millions of People,” updated August 14, 2025, https://www.cbpp.org/research/food-assistance/by-the-numbers-harmful-republican-megabill-takes-food-assistance-away-from.
[9] Claire Heyison, “Nearly 3 Million Fewer People Secured Marketplace Coverage After Republican Health Care Cuts, New Data Show,” CBPP, June 30, 2026, https://www.cbpp.org/blog/nearly-3-million-fewer-people-secured-marketplace-coverage-after-republican-health-care-cuts; Dottie Rosenbaum, Joseph Llobrera, Catlin Nchanko, and Luis Nunez, “SNAP Tracker: People Are Losing Food Assistance as the Republican Megabill Is Implemented,” CBPP, May 18, 2026, https://www.cbpp.org/research/food-assistance/snap-tracker-people-are-losing-food-assistance-as-the-republican-megabill.
[10] See the December Data Update (the latest available data), which reflects tariff policy as of November 17, 2025, at The Budget Lab, “Combined Distributional Effects of the One Big Beautiful Bill Act and of Tariffs,” August 12, 2025, https://budgetlab.yale.edu/research/combined-distributional-effects-one-big-beautiful-bill-act-and-tariffs-0.
[11] We looked at monthly average prices for retail gasoline (regular gasoline, all areas, all formulations) for March, April, May, and June 2026 and calculated the percent change relative to average prices for those months in 2025 using data from the U.S. Energy Information Administration, https://www.eia.gov/petroleum/gasdiesel/?hl=en.
[12] The 2017 tax law temporarily increased the maximum credit amount from $1,000 to $2,000 per child; this increase would have expired at the end of tax year 2025 in the absence of the 2025 reconciliation law.
[13] The $2,200 maximum credit amount and the $1,700 lower maximum credit amount are both indexed but use different parameters to adjust for inflation. Based on CBO projections as of February 2026, the difference is expected to be between $500 and $600 per child in future years. Prior to the 2025 reconciliation law, the $2,000 maximum credit was not indexed to inflation while the lower maximum credit was indexed. This meant that over time the lower cap amount would have equalized with the maximum credit for which middle- and upper-income families were eligible. Depending on the inflation adjustments in a given year, the maximum credit and lower maximum credit amounts may stay the same; for both tax years 2025 and 2026, the maximum credit was $2,200 and the lower maximum credit was $1,700. CBO Key Budget and Economic Data, Tax Parameters and Effective Marginal Tax Rates, Feb 2026, https://www.cbo.gov/data/budget-economic-data#10.
[14] Children ineligible for the Child Tax Credit based on immigration status are eligible for the much smaller $500 credit for other dependents, but it only offsets income tax liability — that is, it cannot be paid as a refund — and many families with lower incomes cannot receive it because they owe no federal income tax due to their low income.
[15] The 2017 tax law newly required children claimed for the Child Tax Credit to have an SSN, which denied eligibility for the credit for an estimated 675,000 to 1 million children. Stephanie Hingtgen, “Recovery Bill Should Restore Child Tax Credit to Children Without Social Security Numbers,” CBPP, August 13, 2021, https://www.cbpp.org/blog/recovery-bill-should-restore-child-tax-credit-to-children-without-social-security-numbers;Marco Guzman, “Inclusive Child Tax Credit Reform Would Restore Benefit to 1 Million Young ‘Dreamers,’” Institute on Taxation and Economic Policy, April 27, 2021, https://itep.org/inclusive-child-tax-credit-reform-would-restore-benefit-to-1-million-young-dreamers/.
[16] The 2.7 million figure is a rough estimate due to data limitations. It overstates the number of children who would lose eligibility from the 2025 reconciliation law by counting all children without accounting for a family’s income, and thus their eligibility for the credits. But it also understates the number of children who would lose eligibility by counting only children who are U.S. citizens but who lack a parent with an SSN. Children who are not U.S. citizens yet have a lawful immigration status and have an SSN will also lose eligibility if they do not have at least one parent with an SSN, and are not included in the 2.7 million figure. Julia Gelatt, Migration Policy Institute, November 2025, https://www.linkedin.com/posts/julia-gelatt-86105953_millions-of-us-kids-live-in-mixed-status-activity-7394407282366681090-bHou.
[17] Thirty states and the District of Columbia have a state minimum wage higher than the federal minimum wage. California, Connecticut, parts of New York, and Washington, as well as the District of Columbia, have a minimum wage higher than $16.42 per hour. See Department of Labor, “Consolidated Minimum Wage Table,” updated July 1, 2026, https://www.dol.gov/agencies/whd/mw-consolidated. Lauren Bauer, Chloe East, and Olivia Howard, “Low-income workers experience—by far—the most earnings and work hours instability,” Brookings, January 9, 2025, https://www.brookings.edu/articles/low-income-workers-experience-by-far-the-most-earnings-and-work-hours-instability/; Bureau of Labor Statistics, ”Table 6. Selected paid leave benefits: Access, March 2025,” https://www.bls.gov/news.release/ebs2.t06.htm; Bureau of Labor Statistics, ”Access to and Use of Leave Summary — 2017-2018; Data From the American Time Use Survey,” https://www.bls.gov/news.release/pdf/leave.pdf.
[18] Tax Policy Center (TPC) national estimate for 2026 allocated by parents’ veteran status based on CBPP analysis of American Community Survey (ACS) data for 2022-2024, using 2026 tax parameters and incomes adjusted to 2026 projected levels. We use February 2026 Congressional Budget Office projections to adjust income for inflation through 2026 and further adjust earnings and rental, interest, and dividend income for real growth. TPC, “T25-0258 – Distribution of Tax Units, Children, and Dependents by Size of Child Tax Credit (CTC), 2026,” August 5, 2025, https://taxpolicycenter.org/model-estimates/T25-0258.
[19] Under the Office of Management and Budget’s 2023 delineations, metro areas are generally defined as cities of 50,000 or more people and surrounding counties that contain or are strongly connected to that city by commuting. All other areas are considered non-metro. We use rural and non-metro interchangeably. Tax Policy Center (TPC) national estimate for 2026 allocated by metropolitan/non-metropolitan area based on CBPP analysis of American Community Survey data for 2022-2024, using 2026 tax parameters and incomes adjusted to 2026 projected levels, and Missouri Census Data Center’s Geocorr 2022 application.
[20] Based on median earnings for full-time, year-round workers, ACS data for 2024, https://data.census.gov/table?q=S2001&g=010XXC0US_010XXH0US&y=2024.
[21] Tax Policy Center (TPC) national estimate for 2026 allocated by race or ethnicity and metropolitan/nonmetropolitan area based on CBPP analysis of American Community Survey (ACS) data for 2022-2024, using 2026 tax parameters and incomes adjusted to 2026 projected levels, and Missouri Census Data Center’s Geocorr 2022 application.
[22] Katherine Michelmore, “Tax Credits and Child Outcomes: Lessons from the U.S., U.K., and Canada,” NBER, May 2025, https://www.nber.org/papers/w33822.
[23] Victoria Hunter Gibney and Urvi Patel, “Income Support Reduces Child Maltreatment, Research From Multiple Programs Suggests,” CBPP, April 29, 2026, https://www.cbpp.org/research/poverty-and-inequality/income-support-reduces-child-maltreatment-research-from-multiple.
[24] Poverty estimate uses the Supplemental Poverty Measure, which counts more forms of income than the official poverty measure, among other differences. CBPP analysis of March 2025 Current Population Survey, using 2026 tax parameters and incomes adjusted to 2026 projected levels. We use February 2026 Congressional Budget Office projections to adjust income for inflation through 2026 and further adjust earnings and rental, interest, and dividend income for real growth.
[25] Claire Zippel, “9 in 10 Families With Low Incomes Are Using Child Tax Credits to Pay for Necessities, Education,” CBPP, October 21, 2021, https://www.cbpp.org/blog/9-in-10-families-with-low-incomes-are-using-child-tax-credits-to-pay-for-necessities-education.
[26] Chuck Marr, Samantha Jacoby, Kris Cox, and Stephanie Hingtgen, “What a Better Tax Bill Would Look Like,” CBPP, April 23, 2025, https://www.cbpp.org/research/federal-tax/what-a-better-tax-bill-would-look-like.
[27] H.R. 2763, “American Family Act,” https://www.congress.gov/bill/119th-congress/house-bill/2763?s=2&r=7&hl=american+families+act; S. 1393, “American Family Act,” https://www.congress.gov/bill/119th-congress/senate-bill/1393?s=2&r=8&hl=american+families+act. Christopher Yera, Sophie Collyer, Megan Curran, and David Harris, “What Could 2024 Child Poverty Rates Have Looked Like Had an Expanded Child Tax Credit Been in Place?” Center on Poverty and Social Policy at Columbia University, September 9, 2025, https://povertycenter.columbia.edu/sites/povertycenter.columbia.edu/files/content/Publications/What-Could-2024-Child-Poverty-Rates-Have-Looked-Like-CPSP-2025.pdf.
[28] H.R. 7024, “Tax Relief for American Families and Workers Act of 2024,” https://www.congress.gov/bill/118th-congress/house-bill/7024. The bill stalled and then failed to pass in the Senate in 2024.
[29] The legislation also allowed families to use their prior year’s earnings to calculate the credit in cases where their earnings declined in the current year, such as from cuts to their work hours, job loss, or reduced income due to someone having to step out of the workforce to attend to caregiving needs. The unfortunate attacks on this provision, referred to as a “lookback,” failed to account for reasons that a person’s earnings might decline in a given year that are often outside their control including structural characteristics of the low-paid labor market, like a lack of paid family or medical leave and erratic hours that make finding stable child care difficult. Kris Cox et al., “About 16 Million Children in Low-Income Families Would Gain in First Year of Bipartisan Child Tax Credit Expansion,” CBPP, January 22, 2024, https://www.cbpp.org/research/federal-tax/about-16-million-children-in-low-income-families-would-gain-in-first-year-of. The bill proposed temporary expansions of the credit for tax years 2023, 2024, and 2025.
[30] S. 3596, “Stronger Start for Working Families Act,” https://www.congress.gov/bill/119th-congress/senate-bill/3596/text.