

Trump Administration, Congressional Republicans Are Worsening Affordability Challenges in Many Ways
In a nation as wealthy as ours, everyone should be able to afford to meet their basic needs – they should be able to buy enough food to feed their families, have a safe and affordable place to live, and go to the doctor and buy medication if they’re sick. Indeed, President Trump won the 2024 election with a promise to address people’s costs and make life more affordable.[1]
But a look at the Trump Administration’s policy choices and priorities demonstrate that the Administration and congressional Republicans have taken action after action that has or will raise the cost of:
- Groceries. Trump has imposed sweeping tariffs on imported food that are raising grocery prices, while enacting the largest cuts to SNAP in history through a deeply harmful Republican megabill that will make affording groceries harder for families with low incomes.
- Health care. The megabill’s large cuts to Medicaid and to Affordable Care Act (ACA) marketplace coverage will make it harder for families to afford the medical care they need. Moreover, the President and congressional Republicans have refused to renew the premium tax credit enhancements that help millions of people afford health care coverage. Together, these policy decisions will result in an estimated 15 million people losing health coverage, many of whom won’t be able to afford care they need.
- Housing. The Trump Administration and House Republicans are pursuing deep cuts to federal rental assistance in annual appropriations bills. If enacted, these cuts will cause hundreds of thousands of people to lose support they use to help keep a roof over their heads. Moreover, sweeping tariffs on home construction inputs will add $30 billion to the annual cost of residential investment, reducing housing supply and affordability for renters as well as prospective home buyers.
- Education. The Republican megabill makes it harder for new student loan borrowers to repay their debt while ensnaring them in longer maximum repayment periods, especially if they have low incomes. For the first time, new borrowers with the lowest incomes — many of them in poverty and many of whom did not complete a degree program — will have to make payments before they can afford it. And both the Trump Administration and House Republican budget proposals would make college less affordable — and encourage debt accumulation — through cuts to federal work study and the elimination of programs providing financial aid to students with low income and child care to parents attending college.
- Energy. The megabill cuts more than $300 billion from energy investments, which will raise energy costs for households and businesses at a time when energy demand is projected to grow. One study estimates that households will face a 13 percent increase ($280 per year) in their energy bills by 2035 as a result of these cuts. Moreover, President Trump has proposed eliminating the Low Income Home Energy Assistance Program (LIHEAP), which provides assistance to 6 million low-income households to help them pay their energy bills and prevent utility shutoffs.
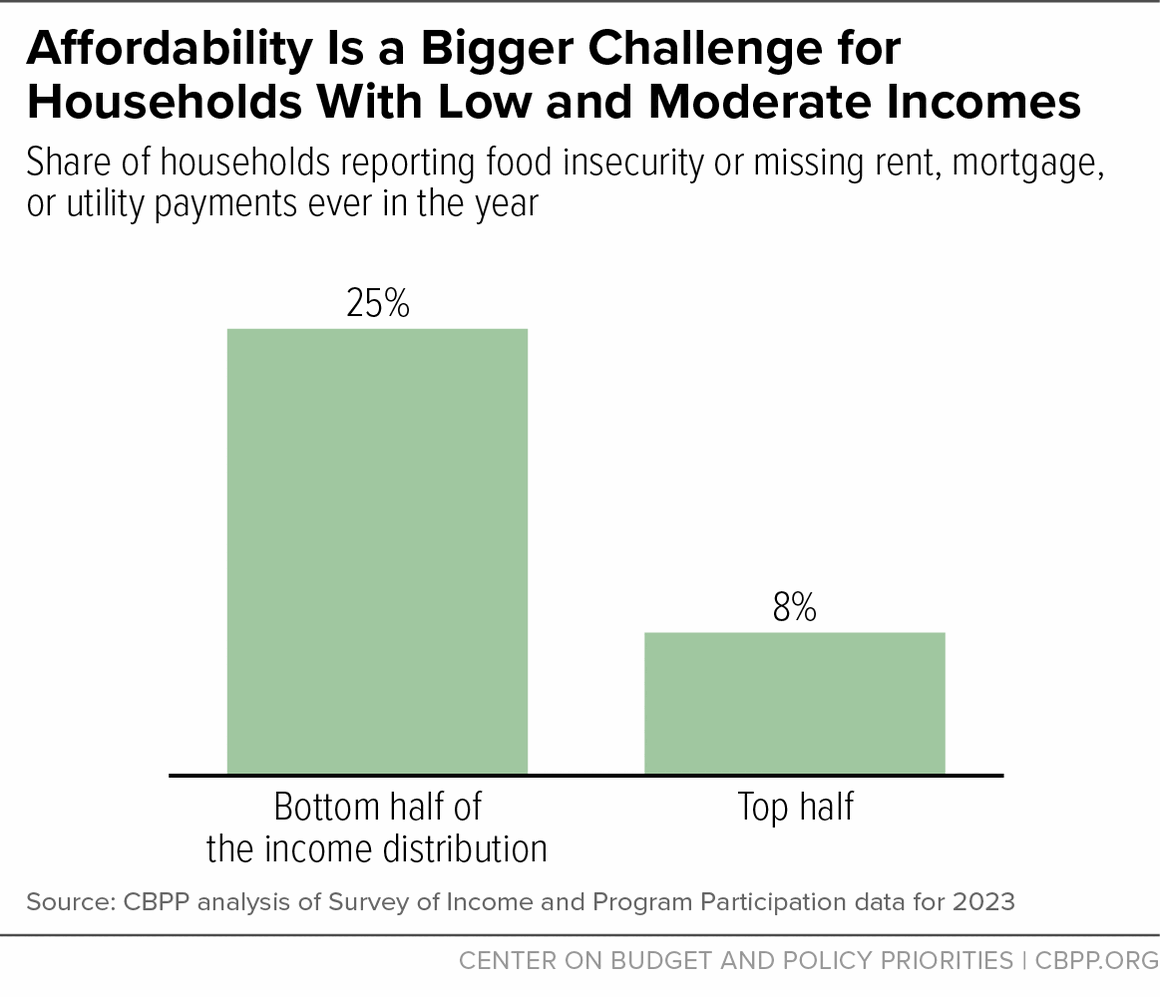
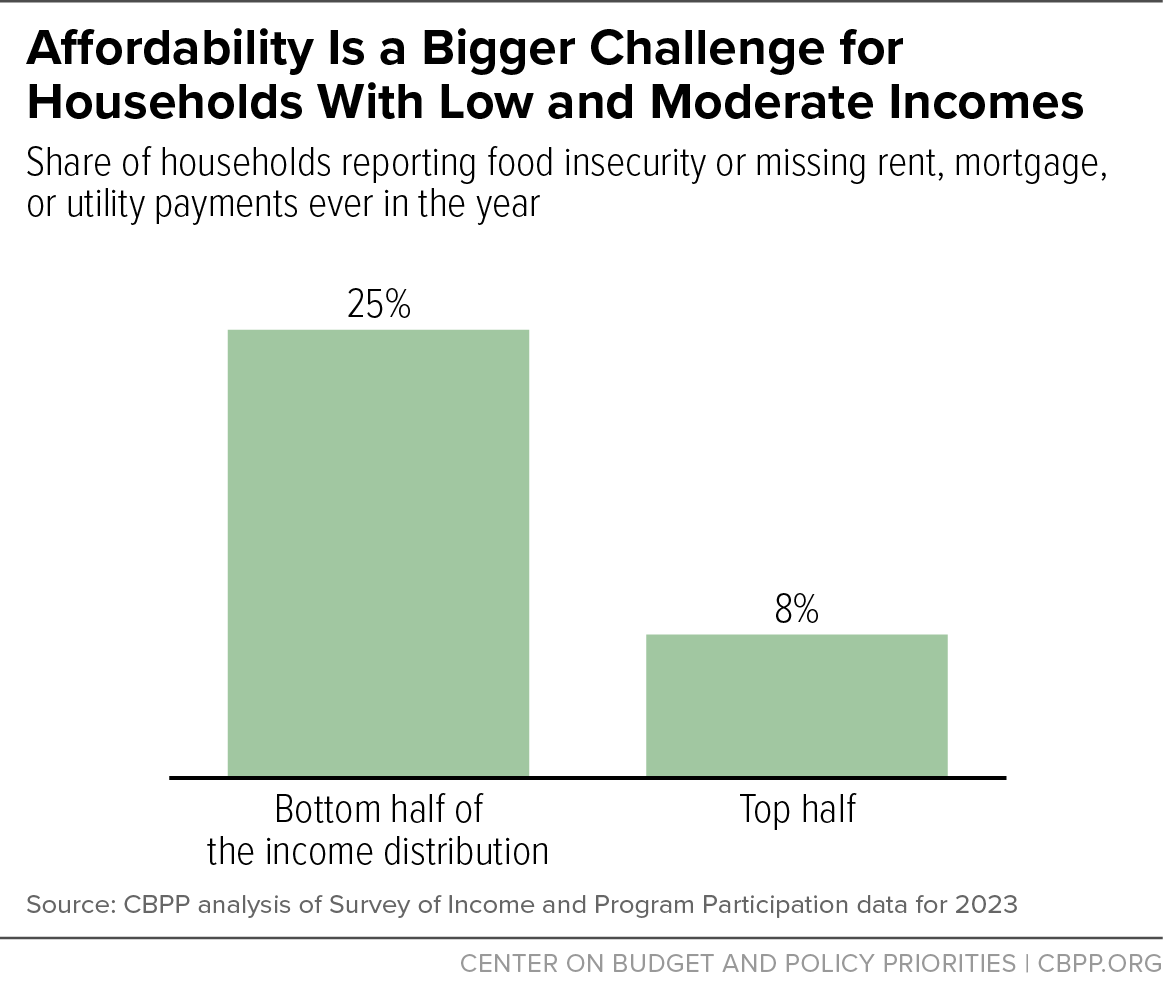
People with low and moderate incomes especially will grapple with the costs of these harmful policy choices. Fully 25 percent of households in the bottom of half of the income distribution report experiencing food insecurity or not being able to pay their rent, mortgage, or utility bill compared to 8 percent of households in the top half. (See Figure 1.)
Households with incomes in the bottom half of the distribution (less than $70,000 in 2023) spend almost 90 percent of their incomes on basic items: utilities, groceries, health care, transportation, and shelter.[2] And to help afford those basics, many need assistance, such as Medicaid, SNAP, or LIHEAP, that the Administration has put on the chopping block. Moreover, families affected by cuts in these areas receive the fewest benefits, if any at all, from the megabill’s tax cuts. That includes the bill’s Child Tax Credit expansion, which gave short shrift to 19 million children in families with low and moderate incomes.
Policy efforts to reverse course and actually improve affordability should focus on people with low and moderate incomes, who already struggle the most to afford the basics and have suffered the most from the Trump Administration’s harmful policies. This effort would start with repealing or abandoning the anti-affordability policies the Administration has pursued, and also using tried and true tools — such as extending the enhanced ACA tax credits, expanding rental assistance, and making the full Child Tax Credit available to children in families with lower incomes.
Groceries
One of the most striking challenges families with low and moderate incomes face is the rising cost of groceries, whose prices have grown faster since January 2020 (29.3 percent) than overall prices (25.4 percent).[3] The rising price of food is especially challenging for households with incomes in the bottom half of the income distribution since groceries are a necessity that makes up such a large portion of their incomes (13 percent). [4] For households in the top half, the figure is much lower (about 5 percent).
The Trump Administration imposed sweeping, across-the-board tariffs upon taking office, raising food prices. The tariffs as they stood in October were estimated to raise the short-run price of vegetables and fruits by 3.3 percent and food as a whole by 1.9 percent above pre-tariff levels according to the Budget Lab at Yale.[5] The Trump Administration has frequently justified its tariffs as encouraging people to replace foreign goods with domestically produced ones, but many of its tariffs applied to food products that the U.S. does not have the climate to produce at mass scale, like bananas and coffee.[6] The Trump Administration moved this fall to exempt these products, but tariffs are still expected to raise food prices by 1.2 percent in the short run.[7]
The Trump Administration and congressional Republicans have also taken steps that will make it harder for families with low incomes to buy groceries. The harmful megabill cut the Supplemental Nutrition Assistance Program (SNAP) by $187 billion through 2034 (about 20 percent), the largest cut in history. This program helps more than 40 million people with low incomes afford groceries each month, and some of the bill’s cuts have already gone into effect. The megabill used these cuts to cover about 4 percent of the cost of its tax cuts, whose benefits are heavily tilted to people with high incomes.[8]
The megabill’s SNAP cuts come from a combination of slashing billions in federal funding for states’ SNAP programs, thereby forcing unaffordable and volatile costs onto states, and by cutting millions of people off from SNAP by increasing administrative hurdles and red tape. Most states will be required to newly pay 5 to 15 percent of food benefits, in addition to paying a greater share (75 percent, up from 50 percent) of SNAP’s administrative costs. If a state can’t make up for these massive federal cuts with tax increases or spending cuts elsewhere in its budget, it will have to cut its SNAP program or potentially opt out of the program altogether, terminating food assistance in the state.
The megabill also expanded already harsh and ineffective measures taking away SNAP for not meeting red tape-laden work requirements, which the Congressional Budget Office (CBO) estimates will cut 2.4 million people off SNAP in a typical month. It also makes cuts that undermine the adequacy of SNAP benefits to help people afford groceries. Over time, the megabill will cut food assistance benefits for all 40 million participants, including 1 out every 5 children in the U.S.,by restricting future updates to the Thrifty Food Plan, the basis for SNAP benefit levels. This will lead to SNAP benefits becoming increasingly inadequate to afford a healthy diet. Other cuts in the law include a provision that makes it harder to qualify for SNAP’s Standard Utility Allowance, resulting in an estimated 600,000 households losing roughly $100 per month in food assistance. Additionally, many immigrants living lawfully in the U.S. and who have been granted humanitarian protections will now be denied SNAP benefits.[9]
Health Care
Health care costs remain one of the biggest burdens for families with incomes in the bottom half of the income distribution, who spend an average of about 13 percent of their incomes on it.[10] But this average obscures the fact that health care burdens are distributed unequally. Seniors have access to Medicare (but may struggle with other affordability issues), while other adults face a varying landscape depending on whether their state has expanded Medicaid — and on whether congressional Republicans agree to extend premium tax credit (PTC) enhancements that are helping millions afford coverage. Moreover, a medical emergency or sudden illness can cause someone to suddenly begin spending a large share of their income on medical care or incurring medical debt when those costs aren’t affordable.
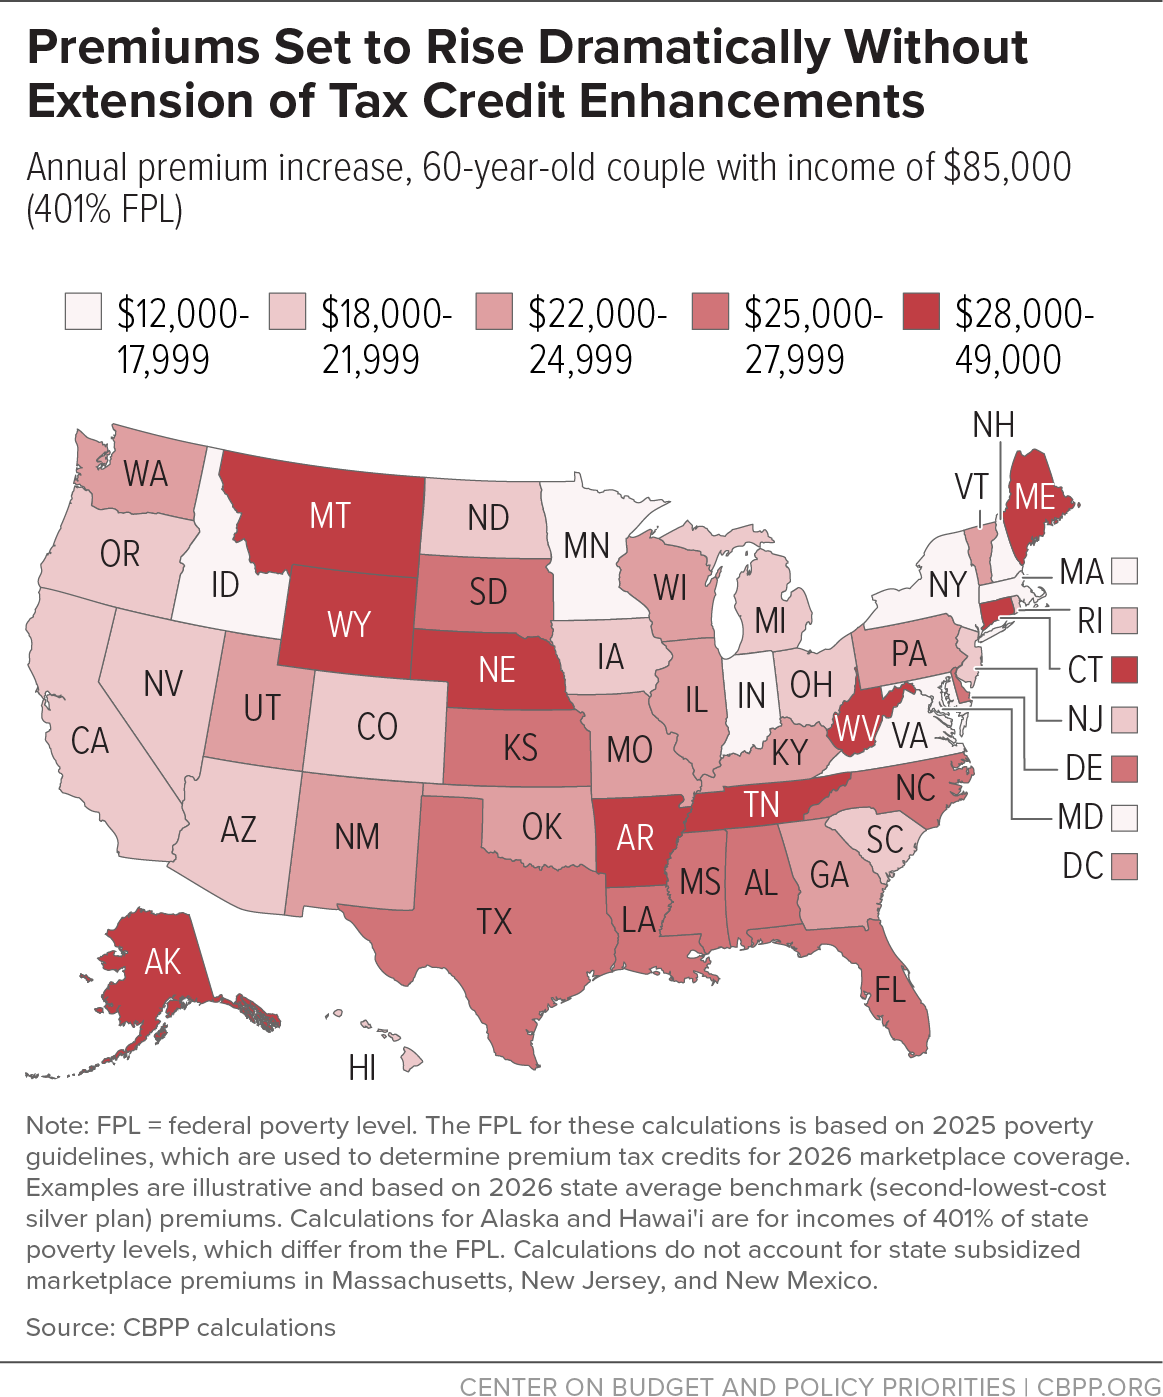
The PTC enhancements that help marketplace enrollees afford coverage expire at the end of 2025, but the Administration and a majority of congressional Republicans thus far remain implacably opposed to renewing them. Congress’ failure to extend PTC enhancements will leave millions vulnerable to extreme premium increases — over $1,000 annually for the average enrollee receiving the credits, and many times that for some people — and at heightened risk of becoming uninsured. (See Figure 2.) And these increases come on top of other cuts to ACA marketplace coverage in the megabill that will cause more people to become uninsured.[11]
Earlier this year, Republican policymakers took active steps to make health care less affordable to families with low incomes. Their megabill cut Medicaid — the country’s second largest health care program, covering about 70 million people[12] — by more than $900 billion (17 percent by 2034) to partially finance the bill’s tax cuts.[13] One of the principal methods it uses to achieve these cuts is creating several new layers of red tape designed to remove people from coverage. That includes red tape-laden work requirements that research shows take coverage away from people who have been laid off, those who are working, and those who should be exempt. Coverage losses are often due to paperwork burdens that result in people who are still eligible losing coverage. The megabill also put in place new requirements that Medicaid expansion enrollees renew coverage every six months instead of once a year — another set of red tape that will result in coverage loss — and measures blocking eligibility and enrollment rules that would simplify enrollment.

The megabill also directly raises Medicaid expansion enrollees’ out-of-pocket health care costs. It requires states to charge those with incomes just above the poverty line ($16,000 a year for an individual) new cost-sharing charges for many services when they go to the doctor.[14]
Housing
One of the nation’s most persistent affordability challenges is housing. Housing costs have gone up across the board for people purchasing homes, as home prices and interest rates have risen.[15] And millions of renters face serious affordability challenges. Some 42 million people in low-income renter households pay more than 30 percent of their income on housing, a widely used benchmark for affordability, and fully 24 million in low-income renter households pay more than half of their income for housing.[16]
Federal rental assistance is key to addressing the affordability challenges that renters face, along with efforts to boost the supply of housing in areas with shortages. Rental assistance helps roughly 10 million people — such as struggling seniors, people with disabilities, veterans, and families with children — keep a roof over their heads, often by helping them afford rental units they find in the private market. But this assistance, unlike Social Security or Medicaid, is part of the annual appropriations process so it hangs in the balance with each budget season.

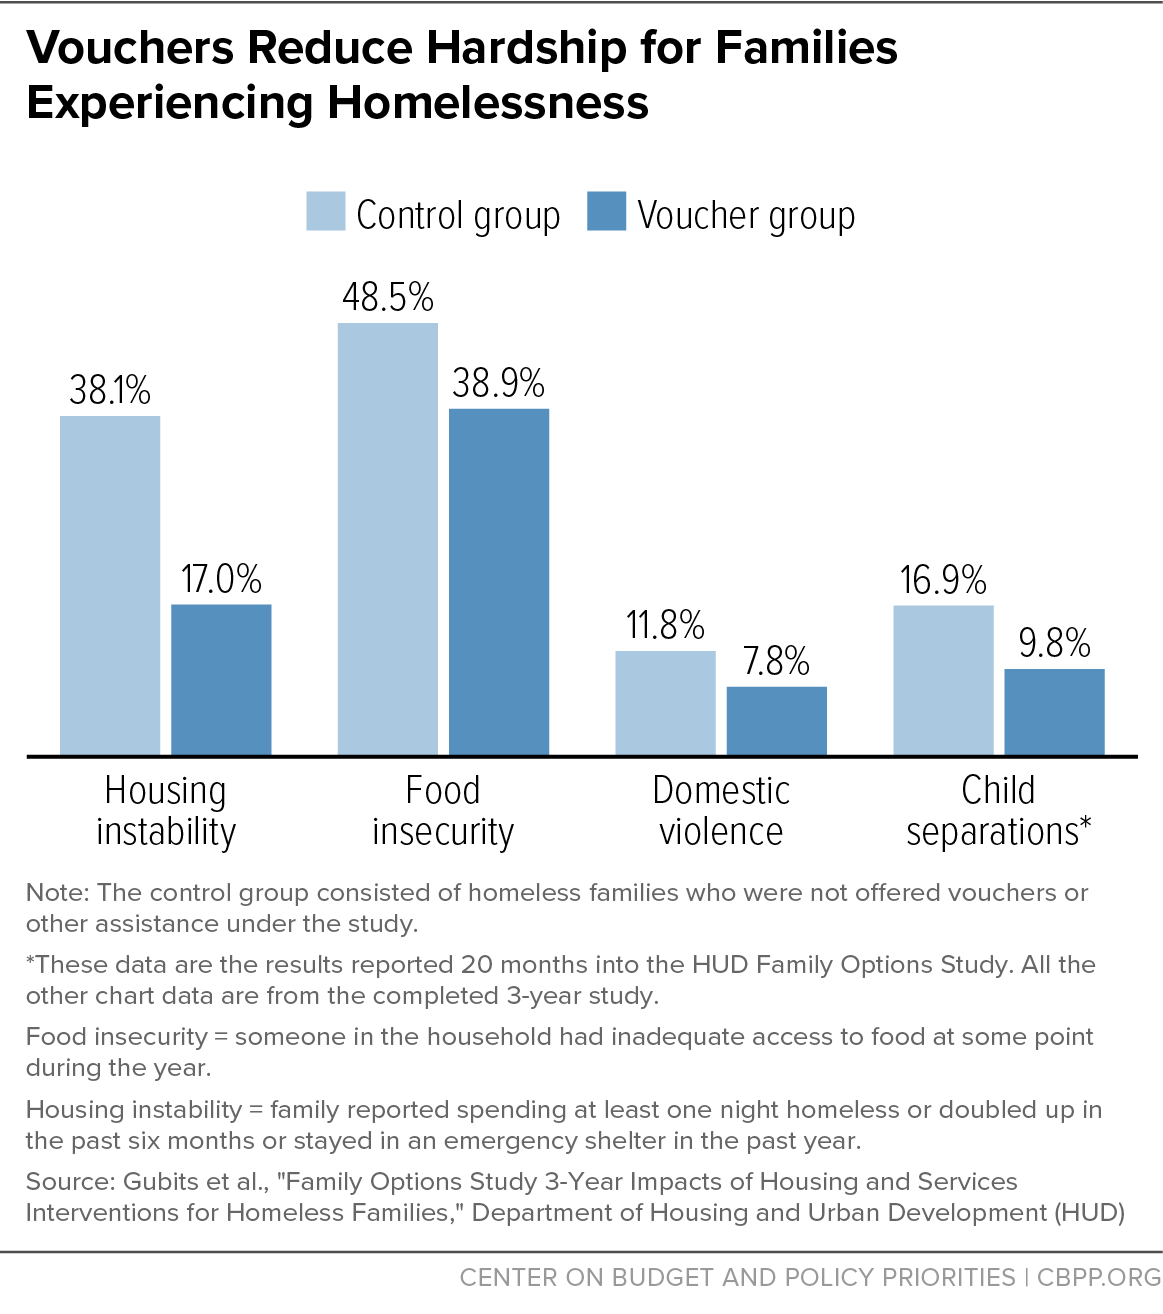
And as with other affordability challenges, many Republican policymakers are calling for policies that would exacerbate the problem. House Republicans’ transportation and housing appropriations bill provides far less funding than is needed to cover the cost of existing Housing Choice Vouchers, with the result that about 411,000 fewer people would receive assistance. [17] These vouchers are the most widely used and effective tool to address homelessness and housing instability (see Figure 3), but only about a quarter of those who are eligible for vouchers or other rental assistance receive it due to limited funding. The House bill would make this worse. It would also cut funding for public housing by nearly $1.5 billion (about 17 percent), hampering the maintenance and repairs needed to protect residents’ health and safety.[18] (The Senate bill is better, but still problematic — for example, its funding level for Housing Choice Vouchers is higher than the House but would still result in 243,000 fewer households receiving rental assistance than in 2025.)
President Trump’s budget proposals for rental assistance are even more harmful: the budget plan would replace existing rental assistance programs, including public housing and housing vouchers, with a new state-based formula grant that would receive 43 percent less funding, even as the cost of housing and the number of families struggling to afford rent has risen in recent years.[19] It would also cut off rental assistance after two years even if participants still can’t afford rent on their own, putting over 3 million people at risk of eviction and homelessness.[20] In addition, the Department of Housing and Urban Development (HUD) intends to make administrative changes to homelessness programs that would take away assistance that more than 170,000 formerly homeless people use to help them afford housing, unless Congress acts to prevent this.[21]
The Administration’s sweeping tariffs, meanwhile, are increasing the cost of housing construction and home furnishings, raising the cost of renting or buying a home. Those tariffs include one of 10 percent on softwood timber and lumber, 25 percent on upholstered wooden products, and 25 percent on kitchen cabinets and vanities, in addition to its broader country-by-country tariffs on Mexico, Canada, China, and other trade partners key to this sector.[22]
The combined effect of these tariffs is $30 billion in added annual costs to investment in residential structures, including new construction, renovations, and affordable housing development, according to the Tax Policy Center (TPC). Moreover, the prices of major appliances — a critical input for housing construction — have gone up more than twice as fast as overall inflation, according to TPC.[23]
Education
The megabill also restructures student loan repayment plans in a manner that will increase millions of new borrowers’ monthly payments, to the tune of $270 billion which, again, the bill is using in service of its skewed tax cuts. In particular, the megabill consolidates all income-based repayment plans for new borrowers — which help keep payments manageable for borrowers with lower incomes relative to their debt levels — into a single Repayment Assistance Plan (RAP) that requires far higher monthly payments than other income-based repayment plans.[24]
Most concerningly, the RAP abandons the “income protection” approach that all other income-based repayment plans feature. Under the RAP, the lowest-income new borrowers — including those with incomes under the poverty line — will for the first time have to make payments well before they are in a position to afford it. This directly undermines the point of income-based repayment, which is to ensure that monthly payments are affordable by scaling them to income.
The RAP will also ensnare new borrowers with persistently low incomes into longer repayment periods. All previous income-based repayment plans set a maximum repayment term of 10-25 years — if someone makes the monthly payments for that entire period and there is still debt, it gets forgiven. The megabill extends that maximum period to 30 years. New borrowers who will be trapped in repayment for this long are those whose incomes remain low for decades. In many cases, those who will have to continue paying for 30 years are people who were not able to complete their degrees or who went to low-quality for-profit colleges.
The Trump Administration and House Republican budgets have also doubled down on cuts to getting a college education that would put further strain on students from families with low and moderate incomes. For example, both would cut federal work study programs that provide part-time employment to students who need help affording education, increasing these students’ reliance on debt. Similarly, both would eliminate federal Supplemental Educational Opportunity Grants, which provide financial aid to low-income students, as well as the Child Care Access Means Parents in School program, which provides child care to parents with low incomes while they are in post-secondary school.
Energy
Household utility bills — including energy — are another large expense for families with incomes in the bottom half of the income distribution, making up 11 percent of their incomes in 2023. The pressures on families’ budgets from utility bills and energy costs may well grow further in part because of policy choices the Administration and congressional majority have made. Household fuel and utility prices have risen 5.9 percent over the last year. And they are expected to continue to rise in the face of increasing construction costs for building energy projects, due to production bottlenecks and tariffs; growing energy demand primarily from data centers; and increased natural gas exports.[25] The Republican megabill dismantled key policies that would have mitigated the price shocks to household budgets. It made over $300 billion in cuts to clean energy tax credits and rescinded close to $8 billion in funding for grants and loans for clean energy, energy waste reduction, improvements to the electric grid, and energy upgrades in affordable housing enacted in the Inflation Reduction Act of 2022.[26] These cuts drive up energy bills and by making it more expensive to install the lowest-cost forms of energy — solar and wind — and to upgrade the electric grid, and by making it harder for households to use less energy. One study estimates that, as a result of the tax credit cuts alone, cumulative capital investment in U.S. electricity and clean fuels production will fall $500 billion over the decade. And households will face a 7.5 percent increase in household energy bills by 2030, or $165 per year, rising to a 13 percent increase, or $280 per year, in 2035.[27]
In addition to the megabill’s cuts, the Trump Administration has terminated billions of dollars in climate and energy funding contracts that would have contributed to decreasing energy costs, most notably $7 billion that would have gone toward bringing low-cost solar energy to low-income households. Meanwhile the Administration is promoting continued operation of uneconomical coal plants.
Beyond this reduction in energy investment that will drive up costs, President Trump is also pursuing budget cuts that directly reduce low-income households’ ability to afford to heat and cool their homes. The President’s budget would eliminate LIHEAP, which provides heating and cooling assistance to 6 million households with low incomes, to help prevent utility shutoffs.
Affordability Struggles Should Be Eased for Families With Low and Moderate Incomes, Not Exacerbated
An important theme in the Trump Administration and House Republicans’ policies is just how much they are stacking the deck against families already facing affordability challenges. While some policies, like the tariffs and repealing energy investments, affect families throughout the income distribution, cuts to Medicaid, SNAP, LIHEAP, and Housing Choice Vouchers largely, if not exclusively, hurt low-income families’ purchasing power.
It is this precise group for whom affordability was already the biggest challenge before Trump took office. Families with incomes in the bottom half of the income distribution (making less than $70,000) spend a large share of their income on the basics: $3,700 on utilities (12 percent of income), $4,500 on groceries (13 percent of income), $4,500 on health care (13 percent of income), $7,400 on transportation (21 percent of income), and $10,600 on shelter (30 percent of income) in 2023.[28] Those categories combined accounted for 89 percent of their income and do not include other essentials, such as clothes or household items like diapers, paper towels, and cleaning supplies. Families with incomes in the top half of the income distribution, on the other hand, spend only 43 percent of their income on utilities, groceries, health care, transportation, and shelter.
These statistics are averages and obscure some of the specific affordability challenges certain families with low and moderate incomes face. For example, child care is a small expense for families as a whole since many people do not have young children, but families close to the poverty line who use child care in a given week spend 17 percent of their income on it.[29]
Another way to see how families with low incomes struggle with affordability is to look at how much more likely they are to report being unable to pay their rent, mortgage, or utility bill, or to report food insecurity. Fully 25 percent of households in the bottom of half of the income distribution report not being able to pay one of those housing bills and/or food insecurity, while 8 percent of households in the top half do.[30]
Any serious affordability agenda must start with improving the finances of families with low and moderate incomes. This agenda should, of course, begin with repealing the Trump Administration and congressional Republicans’ harmful policies, like cuts in health coverage and food assistance as well as broad-based tariffs. More broadly, it should make use of the proven policy tools for reducing these families’ costs in the areas where they spend the most, such as extending the enhanced ACA tax credits to address health care costs, ensuring that all states adopt the ACA’s Medicaid expansion, and expanding rental assistance to keep more people’s housing costs in check. The ultimate success of an affordability agenda should be measured by whether everyone has the opportunity not just to get by, but thrive.
End Notes
[1] Paul Steinhauser, “Donald Trump says this is the reason he won last month's presidential election,” Fox News, December 9, 2024, https://www.foxnews.com/politics/donald-trump-says-reason-he-won-last-months-presidential-election.
[2] Note that this is based on the Consumer Expenditure Survey, which has a different income cutoff than the Survey of Income Program Participation analysis of the difficulty of paying bills and/or food insecurity. Expenditures exceed incomes for the bottom half of households in the Consumer Expenditure Survey. The average post-tax income of households in the bottom half of the income distribution is $34,000 while total spending amounts to $45,000. Utilities, groceries, health care, transportation, and shelter amount to $31,000 — 89 percent of income and 68 percent of total spending. There are persistent concerns about the survey’s extreme expenditure-to-income ratio for households at the very bottom of the income distribution (expenditures are about four times as large as income); this analysis focuses on the bottom 50 percent for this reason. A U.S. Treasury analysis of consumption-to-income ratios that attempts to correct for issues with these ratios also shows that the bottom five deciles as a whole consume more than they earn. See Julie-Ann Cronin, "U.S. Treasury Distributional Analysis Methodology," U.S. Treasury Department, May 2022, https://home.treasury.gov/system/files/131/TP-8.pdf.
[3] Federal Reserve Economic Database, “Consumer Price Index for All Urban Consumers: Food at Home in U.S. City Average,” and “Consumer Price Index for All Urban Consumers: All Items in U.S. City Average,” both last accessed December 17, 2025, https://fred.stlouisfed.org/series/CUSR0000SAF11, https://fred.stlouisfed.org/series/CPIAUCSL
[4] Analysis of Consumer Expenditure Survey, “Table 1110. Deciles of income before taxes: Annual expenditure means, shares, standard errors, and relative standard errors, Consumer Expenditure Surveys, 2023,” Bureau of Labor Statistics, https://www.bls.gov/cex/tables/calendar-year/mean-item-share-average-standard-error/cu-income-deciles-before-taxes-2023.xlsx.
[5] Budget Lab, “State of U.S. Tariffs: October 30, 2025,” November 10, 2025, https://budgetlab.yale.edu/research/state-us-tariffs-october-30-2025.
[6] The White House, "Fact Sheet: President Donald J. Trump Declares National Emergency to Increase our Competitive Edge, Protect our Sovereignty, and Strengthen our National and Economic Security," April 2, 2025, https://www.whitehouse.gov/fact-sheets/2025/04/fact-sheet-president-donald-j-trump-declares-national-emergency-to-increase-our-competitive-edge-protect-our-sovereignty-and-strengthen-our-national-and-economic-security/.
[7] Budget Lab, “State of U.S. Tariffs: November 17, 2025,” November 17, 2025, https://budgetlab.yale.edu/research/state-us-tariffs-november-17-2025.
[8] Congressional Budget Office (CBO), “Estimated Budgetary Effects of Public Law 119-21, to Provide for Reconciliation Pursuant to Title II of H. Con. Res. 14, Relative to CBO’s January 2025 Baseline,” July 21, 2025, https://www.cbo.gov/publication/61570
[9] Katie Bergh and Dottie Rosenbaum, “Many Low-Income People Will Soon Begin to Lose Food Assistance Under Republican Megabill,” Center on Budget and Policy Priorities, September 10, 2025, https://www.cbpp.org/research/food-assistance/many-low-income-people-will-soon-begin-to-lose-food-assistance-under; CBPP, “By the Numbers: Harmful Republican Megabill Takes Food Assistance Away From Millions of People,” August 14, 2025, https://www.cbpp.org/research/food-assistance/by-the-numbers-harmful-republican-megabill-takes-food-assistance-away-from
[10] Analysis of Consumer Expenditure Survey, “Table 1110. Deciles of income before taxes: Annual expenditure means, shares, standard errors, and relative standard errors, Consumer Expenditure Surveys, 2023,” https://www.bls.gov/cex/tables/calendar-year/mean-item-share-average-standard-error/cu-income-deciles-before-taxes-2023.xlsx.
[11] Jennifer Sullivan and Nicole Rapfogel, “Five Key Changes to ACA Marketplaces Amid Uncertainty Over Premium Tax Credit Enhancements,” CBPP, September 22, 2025, https://www.cbpp.org/research/health/five-key-changes-to-aca-marketplaces-amid-uncertainty-over-premium-tax-credit.
[12] CBPP, “Introduction to Medicaid,” updated November 4, 2025, https://www.cbpp.org/research/health/introduction-to-medicaid.
[13] CBO, op. cit.
[14] CBPP, “By the Numbers: Harmful Republican Megabill Will Take Health Coverage Away From Millions of People and Raise Families’ Costs,” August 27, 2025, https://www.cbpp.org/research/health/by-the-numbers-harmful-republican-megabill-will-take-health-coverage-away-from.
[15] Congressional Research Service, “Housing Cost Burdens in 2023: In Brief,” March 11, 2025, https://www.congress.gov/crs_external_products/R/PDF/R48450/R48450.2.pdf
[16] Center on Budget and Policy Priorities analysis of 2023 American Community Survey data.
[17] Sonya Acosta, “Congress Must Act to Prevent Cuts That Would Leave Hundreds of Thousands at High Risk of Homelessness,” CBPP, December 17, 2025, https://www.cbpp.org/blog/congress-must-act-to-prevent-cuts-that-would-leave-hundreds-of-thousands-at-high-risk-of.
[18] Brendan Duke et al., “2026 Appropriations Must Protect Against Further Partisan Cuts and Illegal Withholding of Funds,” CBPP, September 4, 2025, https://www.cbpp.org/research/federal-budget/2026-appropriations-must-protect-against-further-partisan-cuts-and-illegal.
[19] Sonya Acosta and Mohammed Akel, “Unless Congress Acts, 59,000 Additional Households at Risk of Homelessness,” CBPP, June 23, 2025, https://www.cbpp.org/blog/unless-congress-acts-59000-additional-households-at-risk-of-homelessness
[20] Will Fischer and Erik Gartland, “Rental Assistance Time Limits Would Place More Than 3 Million People — Half of Them Children — at Risk of Eviction and Homelessness,” July 18, 2025, https://www.cbpp.org/research/housing/rental-assistance-time-limits-would-place-more-than-3-million-people-half-of-them#:~:text=A%20proposal%20by%20the%20Trump,risk%20of%20eviction%20and%20homelessness.
[21] Acosta, op. cit.
[22] Elena Spatoulas Patel, Robert McClelland, and John Wong, “Recent Tariffs Threaten Residential Construction,” TPC, October 3, 2025, https://taxpolicycenter.org/taxvox/recent-tariffs-threaten-residential-construction. “
[23] Ibid.
[24] The analysis of student loans below is based on Michele Zampini, “How the Reconciliation Law Changes the Federal Student Loan Repayment System,” the Institute for College Access & Success, July 24, 2025, https://ticas.org/affordability-2/reconciliation-2025-student-loans/
[25] Federal Reserve Economic Database, “Consumer Price Index for All Urban Consumers: Fuels and Utilities in U.S. City Average,” last accessed December 17, 2025, https://fred.stlouisfed.org/series/CUSR0000SAH2; Center for American Progress, “Residents of 49 States and Washington, D.C., Face Increasing Electric and Natural Gas Bills,” October 27, 2025, https://www.americanprogress.org/article/residents-of-49-states-and-washington-d-c-face-increasing-electric-and-natural-gas-bills/.
[26] CBO, op. cit.
[27] Jesse Jenkins, Jamil Farbes, and Ben Haley, “Impacts of the One Big Beautiful Bill on the US Energy Transition — Summary Report,” Princeton University ZERO Lab, July 3, 2025, https://zenodo.org/records/15801701.
[28] Center on Budget and Policy Priorities analysis of Consumer Expenditure Survey data.
[29] Maude Toussaint-Comeau and Maxwell Jaffe, “Childcare Use and Expenses Among Families of Different Income Levels,” Figure 8, Federal Reserve Bank of Chicago, September 2024, https://www.chicagofed.org/publications/chicago-fed-insights/2024/childcare-use-expenses-by-income-levels.
[30] CBPP analysis of Survey of Income and Program Participation data.