Unmet Needs and the Squeeze on Appropriations
Policymakers Should Continue Bipartisan Sequestration Relief
As the White House and Congress begin work on fiscal year 2018 funding for discretionary programs, they face a fundamental choice: (1) continue providing at least partial relief from the 2011 Budget Control Act’s (BCA) deep sequestration cuts, (2) let sequestration take full effect for the first time, or (3) as President Trump proposes, significantly deepen sequestration on non-defense programs while eliminating it for defense.
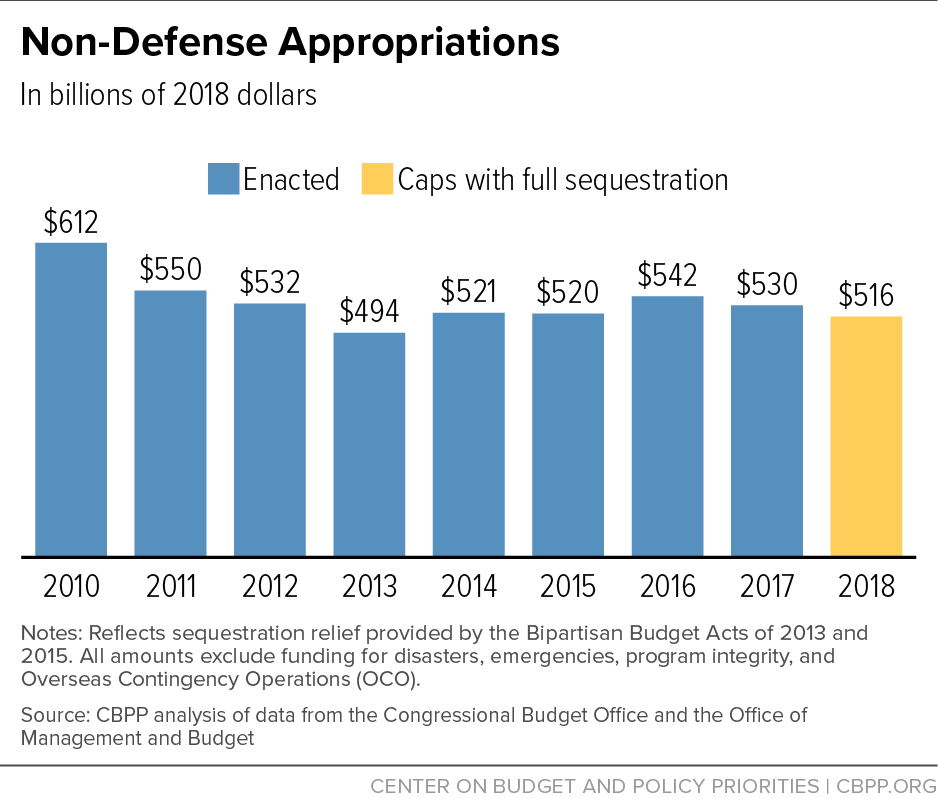
The cumulative impact of seven years of austerity under the BCA’s tight annual appropriations caps and the sequestration cuts below those levels has been substantial. The 2017 non-defense funding level is 13 percent below the comparable 2010 level after adjusting for inflation and 18 percent below after adjusting for inflation and population growth. In 2018, with full sequestration in place, those cuts would grow to 16 and 21 percent, respectively. (See Figure 1.)
The real test, however, is not the funding levels themselves but their impact on the government’s ability to provide important services, invest in the productivity of the workforce, and meet national needs. This analysis highlights examples from various agencies and programs, examining both funding trends and the needs that funding is intended to address. These examples show significant shortfalls, including the following:[2]
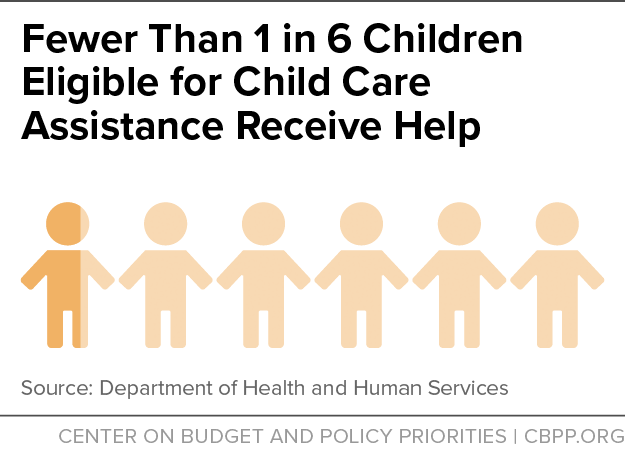
- Programs that help low-income families afford child care serve fewer than 1 in 6 eligible children due to insufficient funding. Because funding has not kept pace with costs, 373,000 fewer children receive child care assistance than in 2006. Insufficient affordable child care reduces many low-income parents’ ability to work.
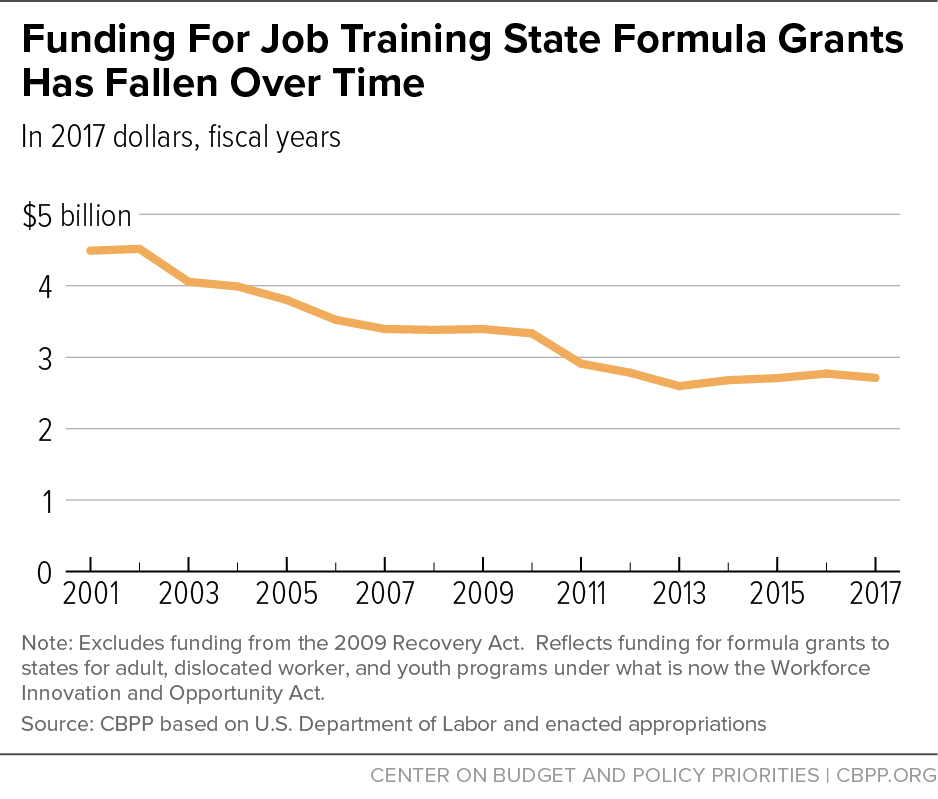
- Despite the importance of job training to help workers upgrade their skills to meet the demands of today’s economy, Department of Labor funding for core state grants for job training and employment services have fallen by 19 percent since 2010, and 40 percent since 2001, after adjusting for inflation.
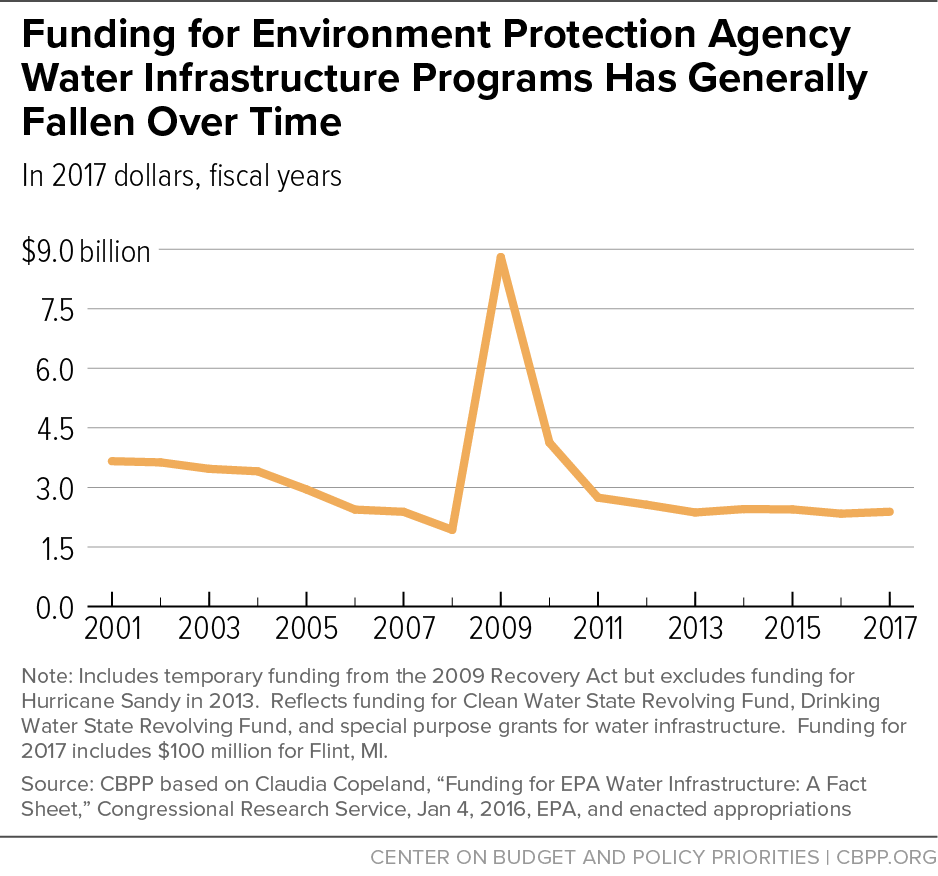
- Environmental Protection Agency funding for programs that help localities upgrade and replace aging drinking water and wastewater treatment infrastructure is now 35 percent below the 2001 level, after adjusting for inflation, even though estimated future investment needs total more than $600 billion.
- Rental assistance to help low-income households afford modest homes serves only 1 in 4 eligible households due to funding limitations, while the number of low-income households that either pay over half their income for rent or live in severely substandard housing has risen 63 percent since 2001.
- Internal Revenue Service (IRS) funding fell 18 percent between 2010 and 2017 in inflation-adjusted terms, while funding for Social Security Administration (SSA) operations fell 11 percent. These cuts are hampering both agencies’ ability to perform their missions. Reduced staffing is generating longer waits for service at both agencies, fewer IRS audits and less tax-law enforcement, and longer delays in adjudicating applications for Social Security disability benefits. In fact, most people who call the SSA for assistance now either get a busy signal or eventually hang up due to much longer wait times.
Policymakers should oppose any calls to deepen the current austerity in appropriated programs.To begin reversing some of these trends and ensure that government can better serve the public, invest in job training and education, upgrade infrastructure, assist people in need, and perform other necessary functions, policymakers should renew sequestration relief. They have reached bipartisan agreement to provide this relief — which reduced but did not eliminate the sequestration cuts — in equal amounts to defense and non-defense in every year since sequestration was imposed. They should do so again. And they should oppose any calls to deepen the current austerity in appropriated programs.
Seven Years of Austerity in Non-Defense Appropriations
Non-defense discretionary appropriations[3] fund a broad range of government functions and services, such as law enforcement and courts, medical and scientific research, health care and other services for veterans, aid to local schools, job training, housing assistance and various other programs for low-income families, food safety and infectious disease control, financial assistance for college students with limited means, environmental cleanup and protection, weather forecasts and warnings, national parks, air traffic control and aviation safety, international assistance, and many other things.
These appropriations have been tightly constrained for the past seven years, largely due to the BCA. The BCA placed binding caps on total non-defense and defense appropriations for each year from 2012 through 2021, locking in non-defense cuts that had been enacted in 2011 and imposing additional reductions. It also established a process called “sequestration,” which further reduced the non-defense and defense caps beginning in 2013 after policymakers failed to enact other measures to reach a specified deficit-reduction target.
Recognizing that the caps and sequestration were making it difficult to meet national needs, bipartisan majorities in Congress have scaled back the sequestration cuts one or two years at a time by substituting alternate deficit reduction. Each time, they provided equal relief for defense and non-defense funding. That relief was only partial, however, leaving in place part of the sequestration cuts and all of the cuts made by the original caps.
The cumulative effect of the caps and sequestration has been substantial. In 2017, the non-defense cap is 13 percent below the comparable 2010 level when adjusted for general inflation and 18 percent below 2010 if also adjusted for population growth. This overall downward trend has meant that:
- A number of programs and activities have been cut considerably or eliminated;
- Even where substantial cuts have not occurred, seven years of inflation have significantly eroded the purchasing power of many programs and their ability to provide services; and
- It has been difficult to provide additional funding to address emerging needs and high-priority goals.
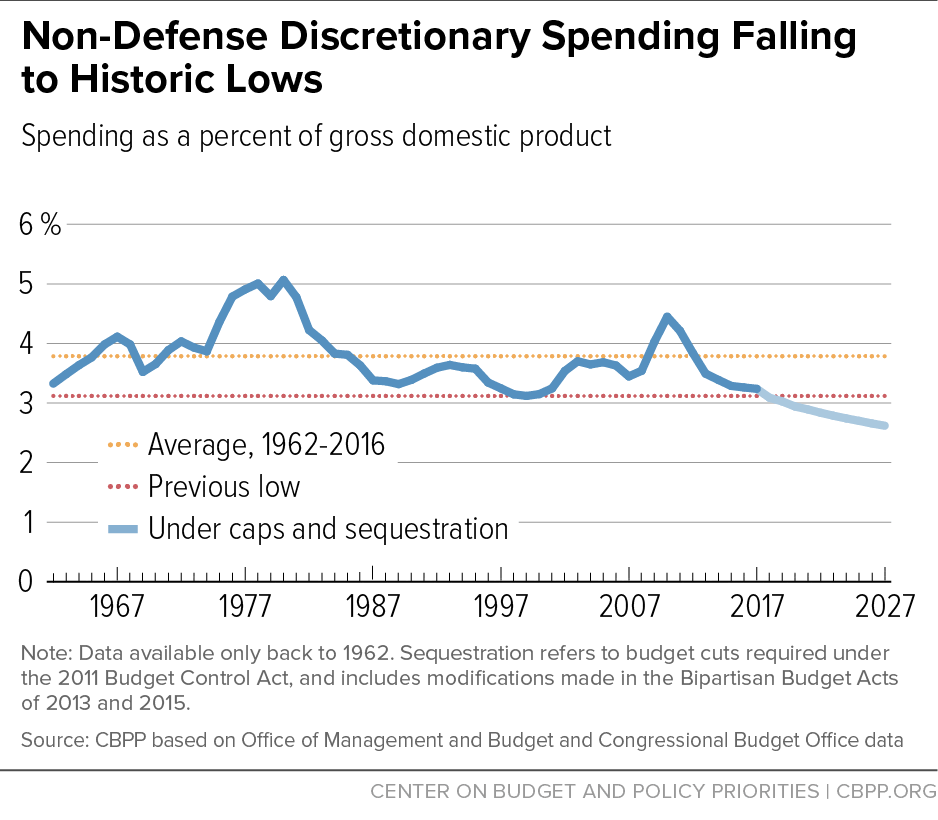
After these seven years of austerity, non-defense discretionary spending is nearing historic lows when measured relative to the size of the economy, a standard way to look at budget trends over long time periods. In 2017, non-defense discretionary outlays equal about 3.3 percent of gross domestic product (GDP)[4] — well below the 3.8 percent average recorded since 1962 (the first year for which these data are available), and just 0.2 percentage point above the lowest percentage on record (see Figure 2).
The Choice for 2018
The full sequestration cuts are scheduled to take effect for the first time in 2018, when the most recent sequestration relief, enacted in the Bipartisan Budget Act of 2015, expires. As a result, the cap on non-defense appropriations will be $3 billion below 2017,[5] an inflation-adjusted cut of 2.8 percent. The cumulative reduction since 2010 will be 16 percent after adjusting for inflation and 21 percent after adjusting for both inflation and population growth, and non-defense discretionary outlays will fall to 3.1 percent of GDP, tied for the lowest level on record in more than half a century. Because certain areas such as veterans’ medical care and border security are expected to receive increased funding, the cut to many program areas will need to be still deeper.
Policymakers therefore face the choice of whether to moderate the sequestration cuts, as they have done for each previous year since sequestration began, or leave sequestration fully in place to further weaken the federal government’s ability to meet national needs. Policymakers could also go even further in squeezing these programs by embracing part or all of President Trump’s radical proposal to cut an additional $54 billion from non-defense funding (on top of the cuts under full sequestration) and shift these resources to defense programs.
As the examples below show, many key areas are underfunded, and the level and quality of services to the public are suffering as a result. How policymakers provide sequestration relief is also important. In the past, they have offset the cost of sequestration relief while avoiding harmful offsets such as cuts to basic assistance for children and families struggling to make ends meet. As Congress considers the need for sequestration relief, it should not replace one set of harmful cuts with another.
Shrinking Appropriations and Unmet Needs: Some Examples
This analysis looks at a number of examples that illustrate some of the effects of seven years of austerity on the government’s ability to meet national needs. The examples represent a range of services supported through non-defense appropriations, some provided directly by the federal government and others accomplished through grants to states and localities or non-profit organizations. Our examples include areas that have been cut substantially and others with smaller cuts or even increases but large unmet needs. Following is a summary of these examples.
- Child care. Federal programs that help low-income families afford safe child care while they are at work serve fewer than 1 in 6 eligible children. Funding has not kept pace with inflation, and as a result the main program assists 373,000 fewer children than it did at its peak in 2006, even though 1 million more children under age 13 are in poverty. Additional funding is also needed to implement bipartisan 2014 legislation mandating various measures to improve the quality and safety of child care. Returning the number of children served just to 2006 levels would require a $2.3 billion funding increase in 2018; another $1.4 billion would be needed to implement the quality improvements.
- Job training and career education. Federal funding for job training has been cut substantially despite its importance in helping workers — especially those left behind by today’s economy — gain the skills they need to succeed. Adjusted for inflation, appropriations for the Labor Department’s main formula grants to states for job training and related services are 40 percent below their 2001 level and 19 percent below the 2010 level. Similarly, Education Department grants to states to improve technical education in high schools and community colleges and to provide basic adult education have shrunk by roughly 20 percent since 2010. Additional resources would have a significant, tangible impact. For example, an additional $500 million in the adult job training program would enable an estimated 125,000 more workers to receive more intensive job training.
- Social Security Administration operations. Appropriations for the Social Security Administration’s core operating budget shrank by 11 percent from 2010 to 2017 in inflation-adjusted terms, even as the agency’s workload has reached record highs as the baby boomers age and the number of applicants and beneficiaries consequently grows. Due to funding shortfalls, the agency imposed a hiring freeze in May 2016 and severely restricted overtime, contributing to long waiting times for service in field offices and by telephone. In addition, the backlog of appeals from denial of disability claims has reached a record 1.1 million cases, with applicants waiting an average of 18 months for a decision.
- Water infrastructure. The federal government helps localities meet capital needs for safe drinking water and wastewater treatment infrastructure to ensure access to safe drinking water throughout the nation and reduce water pollution. Needs for investment in this area are tremendous — to replace aging pipes, upgrade treatment systems, and correct problems such as wastewater and stormwater draining into the same sewers and overflowing in heavy rains. Capital investment required over the next 20 years totals $384 billion for drinking water systems and $271 billion for wastewater treatment, according to the Environmental Protection Agency. But inflation-adjusted funding for Environmental Protection Agency programs that assist with these investments is now 35 percent below 2001 and 13 percent below 2011.
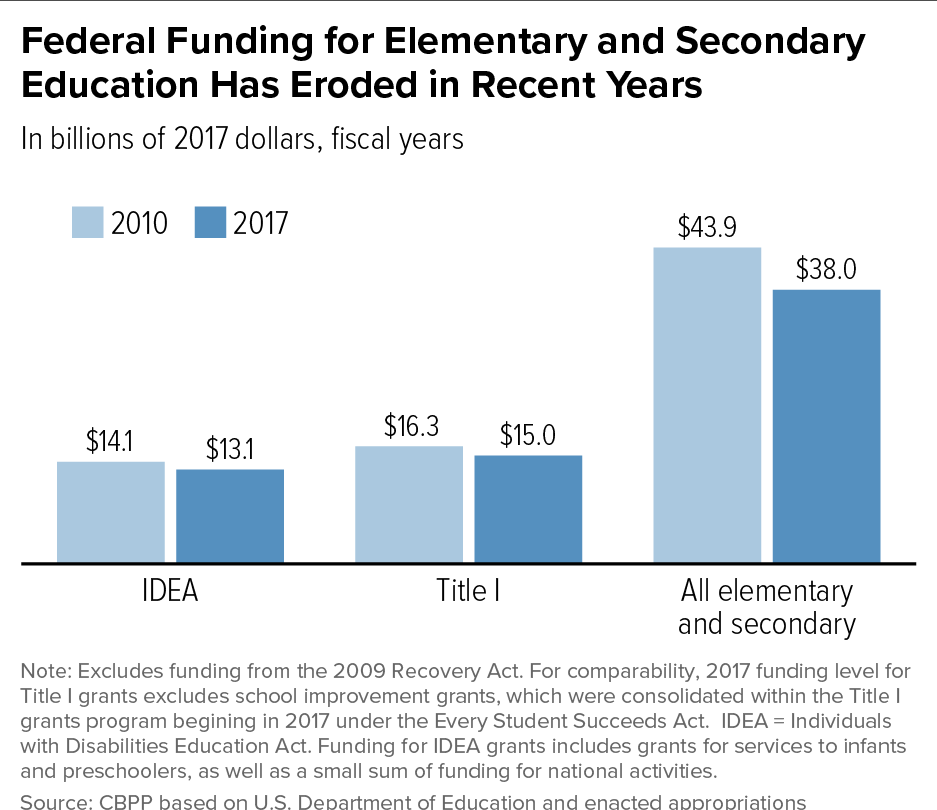
- Elementary and secondary education. The federal government provides modest but important support for schools, about three-quarters of it through two large formula grant programs aimed at helping low-income and disadvantaged students succeed and helping schools provide special education services for students with disabilities. Funding rose during the first part of the last decade following enactment of the 2001 No Child Left Behind Act, but then generally began to slip backwards. In inflation-adjusted terms, the 2017 total is 21 percent below the peak in 2004 and 13 percent below the 2010 level.
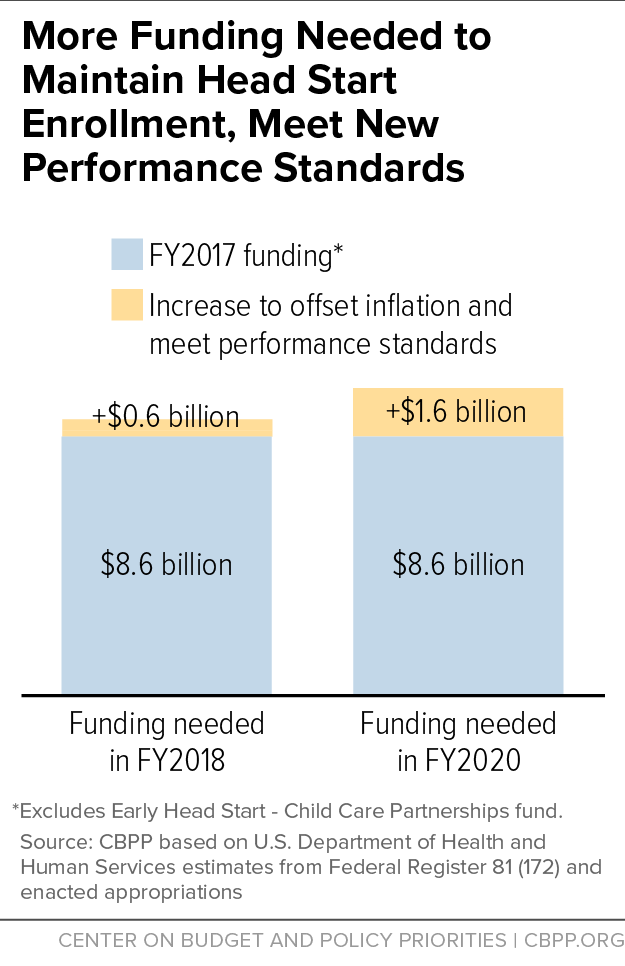
- Head Start. Funding for Head Start — which provides preschool and early learning services to 945,000 low-income preschoolers, infants, and toddlers — remains well below what is needed to ensure that all eligible children have access to high-quality early education. Enrollment has fallen by nearly 20,000 from its high-water mark in 2011, and the program serves fewer than half the preschool children eligible (and under 5 percent of infants and toddlers). In addition, the federal government has set a goal of having all Head Start centers provide full-school-day and full-school-year programs by 2021, reflecting research suggesting that children in such programs have better outcomes. Meeting that goal as well as other performance standards while maintaining enrollment would require $1.6 billion in additional annual funding.
- IRS. The IRS budget has been cut by 18 percent since 2010 in inflation-adjusted terms, weakening its ability to perform its core functions of collecting taxes and enforcing the tax laws. As a result of funding cuts, the IRS lost 14 percent of its overall workforce and 23 percent of its enforcement workforce between 2010 and 2016, while the number of individual income tax returns it had to process grew by 10 million. These cuts have impaired service to the public (the IRS answered only 53 percent of the calls it received in 2016), delayed upgrades of information technology and cybersecurity, and slowed the audit rate (which fell from 1.1 percent to 0.7 percent between 2010 and 2016). Increasing funding for IRS enforcement activities would reduce the budget deficit — Treasury estimates that every additional $1 can produce $6 in additional revenue.
- Preparations for 2020 census. The census of the U.S. population that the Constitution requires to be taken every ten years is a massive and complex operation which requires extensive testing, planning, outreach, and logistical preparation to ramp up years before the actual count. Preparations for the 2020 census have already been delayed, curtailed, or cancelled due to funding shortfalls, however, with 2017 appropriations for the Census Bureau $164 million below the Obama Administration’s request, and tight appropriations caps will likely lead to future shortfalls that will worsen the damage.
- Foreign development and humanitarian aid. While U.S. foreign development and humanitarian aid has earned high marks for effectiveness, its level (when measured as a percent of the economy) is far below that of other developed countries, and the gap is widening despite massive global needs. According to the Organisation for Economic Co-operation and Development, the United States ranks 22nd of the 29 countries examined in Official Development Aid spending as a percent of the economy. It would need to increase its development assistance by three-quarters to reach the average of the 29 countries assessed.
- National park maintenance. The National Park Service reports a backlog of almost $12 billion in maintenance and repair needs at its parks and other sites, reflecting the aging of park infrastructure such as roads, buildings, water and waste treatment systems, and historic structures. The Park Service estimates that maintenance needs are roughly double the annual funding provided to address them; as a result, the maintenance backlog continues growing. In particular, appropriations for the national park construction account are now 62 percent less than in 2001 and 19 percent less than in 2010, after adjusting for inflation.
- Housing assistance Federal rental assistance helps more than 5 million low-income households afford modest homes. But 3 in 4 eligible households receive no federal rental assistance due to funding limitations, and the number of unassisted households with severe housing needs has risen 63 percent since 2001. Increased funding will be needed in the coming year and after, both to keep pace with rising rents and to make further progress in reducing homelessness and addressing other urgent housing problems.
- Maintenance of federally funded tribal schools. The Interior Department’s Bureau of Indian Education operates elementary and secondary schools serving about 48,000 Native American students in 23 states. Many of these facilities are in poor condition, and the Bureau of Indian Education schools have almost $400 million in deferred maintenance. Construction funding for these schools is now 67 percent below its 2001 level, adjusted for inflation (although 5 percent above 2010).
Child Care Assistance (Back)
The Child Care and Development Block Grant (CCDBG) provides funding to states for child care assistance and to improve the quality of child care. Most families assisted through CCDBG work at low-wage jobs; a smaller group receives assistance so they can attend job training programs that will help them get a job.
In 2017, funding for CCDBG stands at $2.9 billion. This discretionary funding is combined with $2.9 billion in mandatory funding (funding provided outside the annual appropriations process), bringing the total federal investment to $5.8 billion. The two funding sources together are referred to as the Child Care and Development Fund (CCDF).[6]
Unfortunately, CCDF funding — even when coupled with funding that states are required to spend from their own resources to qualify for the federal funds — falls well short of need. In 2012, fewer than 1 in 6 children eligible for child care assistance under federal law received help from CCDBG or other related federal funding sources (see Figure 3).[7]
Neither discretionary nor mandatory child care funding has kept pace with inflation. The modest increases in discretionary appropriations over the past nine years have not made up for cuts in previous years, leaving funding slightly below its 2002 level, after adjusting for general inflation. Mandatory funding has been flat since 2006 even before adjusting for inflation, corresponding to an inflation-adjusted decline of $634 million or 18 percent over that period.
Because of this underfunding, the number of children served has fallen over the last decade. According to the latest estimate, CCDF assists 1.4 million children — the fewest on record and 373,000 below its peak in 2006, even though there are more than 1 million more children under age 13 in poverty.[8]
Underfunding not only leaves large numbers of children who need child care assistance without help, but also stymies efforts to improve child care quality. Bipartisan legislation that reauthorized the program in 2014 focused on improving the health and safety standards and the overall quality of child care for recipients of child care assistance. These quality improvements include ensuring all providers and their staff complete health and safety training, pass background checks, and implement regular professional development and staff training. The legislation also sought to improve continuity of care by allowing children to continue receiving child care assistance when their parents lose jobs and are looking for new ones and when parents receive modest raises, and by reducing administrative hurdles that can cause eligible families to lose assistance.[9]
Policymakers increased CCDBG appropriations by about $300 million in 2016 to implement these reforms, but this is well short of what the program requires to meet the new standards. The non-partisan Center for Law and Social Policy (CLASP) estimates that it would take an additional $1.4 billion to fully implement the quality improvements in the new law without cutting the number of children assisted. If providers have to absorb the cost of quality improvements without additional funding, CLASP estimates that 217,000 children stand to lose assistance in 2018.[10] Without sufficient funding, therefore, the number of assisted children will likely fall and states will likely skimp on quality improvements that should be undertaken in response to the new law and implementing regulations.
Additional resources could ensure that more children are served and that the quality improvements are made, so that children are safe and well cared for. For example, to return the number of children served just to 2006 levels, CCDBG would need an additional $2.3 billion in 2018, in addition to the $1.4 billion needed to implement the quality improvements.[11]
Job Training and Career Education (Back)
Job training is a key strategy for helping American workers — especially low-skilled workers left behind due to technological advancements and other changes — attain the skills they need for today’s economy. But major sources of federal investment in this area, from the Departments of Labor and of Education, have shrunk in recent years. Each has been cut by roughly 20 percent since 2010, after adjusting for inflation, despite strong evidence that postsecondary education and industry-specific skills training significantly improve workers’ earnings and re-employment prospects.[12]
The Department of Labor administers three core grants for job training, which were reauthorized on a bipartisan basis under the Workforce Innovation and Opportunity Act (WIOA). States and localities use this funding to provide employment services to disadvantaged adult job seekers and workers who have lost their jobs, as well as youth. WIOA places a particular focus on youth neither working nor attending school; almost 5 million youth aged 16 to 24 who fall into this category face significant barriers to employment.[13]
Despite bipartisan recognition of the importance of job training grants, total funding has been cut substantially over time. Funding in 2017 dollars fell from $4.5 billion in 2001 to $3.3 billion in 2010 and $2.7 billion in 2017 — 40 percent below the 2001 level and 19 percent below 2010 (see Figure 4). Funding has plummeted by 57 percent since these grants began in 1984.
The youth program offers a range of services including work experience, preparation and transition for postsecondary education, financial literacy education, occupational skill training, and entrepreneurial skills training. The adult and dislocated worker programs provide two types of services: lower-intensity employment services such as skills assessments, help writing a resume, and information on job postings, and job training services, which include programs that build actual skills or lead to postsecondary credentials and apprenticeships. WIOA shifted the emphasis of the workforce system to increase participation in training services, but progress on this front has been limited. In 2015, of the 6.5 million adult job seekers and dislocated workers served, only about 240,000 participants received the more intensive — and expensive — training services.
Helping American workers get both the training services needed to succeed in today’s labor market and the re-employment services needed to find a job that offers a pathway to a career will require reinvesting in our workforce efforts. Without additional resources, assisting greater numbers of job seekers and dislocated workers will be difficult or will come at the expense of reducing access to other job-seeking assistance. Additional resources would have a tangible impact — for example, an additional $500 million in the adult program would enable roughly 125,000 more workers to receive the more intensive job training.[14]
Disinvestment in our nation’s workforce is not limited to the Department of Labor workforce programs. The Department of Education provides grants to states to expand and improve career and technical education in high schools, technical schools, and community colleges. Appropriations for these grants have shrunk by 34 percent since 2001 and by 21 percent since 2010, after adjusting for inflation. The Education Department also administers grants, authorized under WIOA, that help adults gain literacy and other basic skills necessary for postsecondary education and employment. Funding for these grants has also shrunk, by 23 percent since 2001 and by 17 percent since 2010, after adjusting for inflation.
Social Security Administration Operations (Back)
Nearly all Americans will depend on benefits from the Social Security Administration (SSA) at some point in their lives. However, years of cuts to SSA’s basic operating funds have hampered the agency’s quality of service and, in turn, hurt hard-working Americans who have earned benefits through their payroll tax contributions.
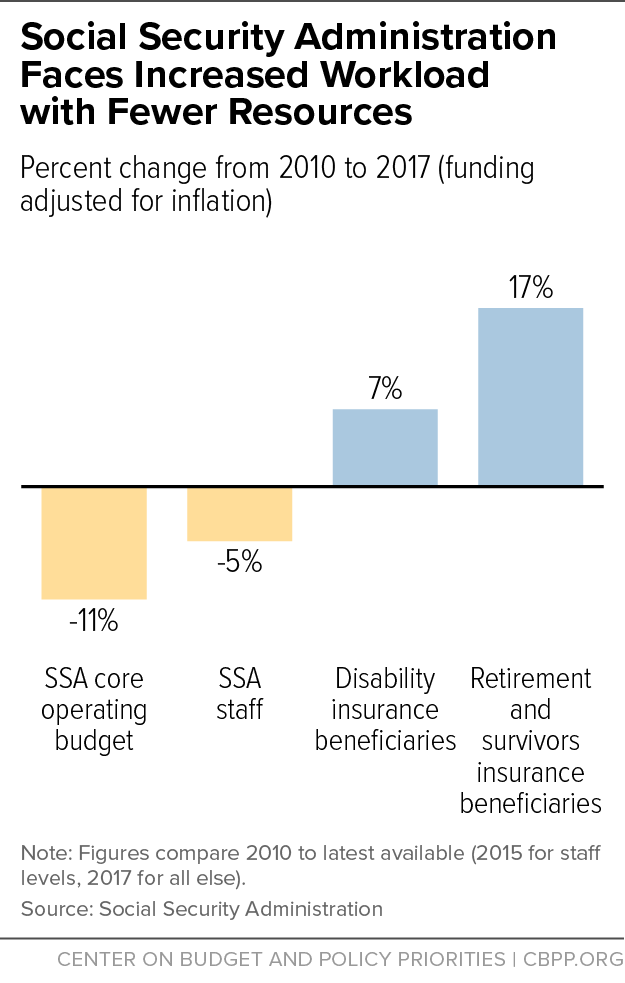
Adjusted for inflation, SSA’s core operating budget of $10.5 billion in 2017 is 11 percent below 2010.[15] Funding constraints have in turn reduced its workforce, but the agency’s workload is reaching record highs as baby boomers age and the numbers of applicants and beneficiaries grow — in March 2017, SSA served 8 million more beneficiaries than it did in March 2010. (See Figure 5.)
In response to inadequate funding, SSA imposed a hiring freeze in May 2016 and severely restricted overtime. This has further weakened customer service in several ways:
- SSA has lost 1,400 field staff since the hiring freeze began, producing a total loss of 3,200 staff since 2010.[16] As a result, 18,000 field office visitors must wait over an hour for assistance daily.[17] Nearly half of visitors must wait at least three weeks for an appointment.
- SSA’s teleservice centers have 450 fewer agents than necessary to handle the 37 million calls they receive annually.[18] As a result, more than half of callers to SSA’s 800 number don’t get their questions resolved. The average wait time for an agent is 18 minutes, nearly half of callers hang up before connecting, and 13 percent of callers get busy signals. By comparison, in 2010 waits averaged about 3 minutes and busy rates were 5 percent.[19]
- The labor cutbacks have hampered SSA’s ability to complete behind-the-scenes work necessary to evaluate claims and accurately compute benefits, leading to growing delays in processing applications or changing benefits when a beneficiary’s circumstances change. This harms both beneficiaries and taxpayers, as it delays the collection of overpayments and risks never recovering them. The number of pending behind-the-scenes tasks has more than doubled just since the hiring freeze began.[20]
Furthermore, rising workloads and funding cuts have contributed to a staggering backlog in disability appeals. Denied applicants for Social Security Disability Insurance or Supplemental Security Income who appeal their case must wait at an average of 18 months before an administrative law judge decides their case, an increase of 50 percent since 2010. The number of people awaiting a decision rose from 700,000 in 2010 to a record 1.1 million in December 2016.[21] These delays come at a high human cost. Appellants can experience financial and medical hardship while waiting; some lose their homes or declare bankruptcy, while others decline in health or die.[22]
SSA has developed a multi-year plan to eliminate the backlog and cut wait times for hearings in half and has made initial progress toward reducing the backlog, in part due to dedicated funding that policymakers provided for this purpose in 2017. However, that funding falls short of what the agency plan requires, and increased funding is necessary for further progress.
Infrastructure for Drinking Water and Wastewater Treatment (Back)
The federal government helps localities meet capital needs for safe drinking water and wastewater treatment infrastructure, to ensure access to safe drinking water throughout the nation and reduce water pollution. Despite large unmet funding needs, due in part to aging infrastructure, federal investment in this area has generally fallen over the past decade or so. In 2017, funding for water infrastructure programs at the Environmental Protection Agency (EPA) totaled $2.4 billion, which is 35 percent below its 2001 level after adjusting for inflation.
The need to upgrade and replace water infrastructure is well documented. The American Society of Civil Engineers’ (ASCE) latest “Infrastructure Report Card” gives drinking water systems a grade of D and wastewater systems a D+.[23] As it notes, many of the more than 1 million miles of pipes delivering drinking water in this country were laid in the early to mid-1900s with a lifespan of 75 to 100 years; more than 56 million new users will need to be connected to public wastewater systems in the next decade; and in about 772 communities, wastewater and stormwater still drain into the same system with associated overflow concerns.
Capital investment required over the next 20 years totals $384 billion for drinking water systems and $271 billion for wastewater treatment, according to the EPA.[24] Some estimates are even higher. The American Water Works Association projects that restoring existing drinking water systems as they reach the end of their useful lives and expanding them to serve a growing population will cost at least $1 trillion over the next 25 years.[25]
The federal role in meeting these needs is to help communities that would otherwise have trouble financing necessary investments. The largest federal assistance comes from EPA contributions to state Clean Water and Drinking Water revolving loan funds.[26] In addition, the Agriculture Department provides financial assistance for water infrastructure (including low-cost loans that can be supplemented with grants) geared to the special needs of rural communities, which often have less financial and technical capacity and face higher costs because of smaller-scale operations.
The trend in federal water infrastructure funding over the past 15 years or so has been downward — apart from a major infusion of funds in 2009 and 2010 as part of infrastructure investments to aid recovery from the Great Recession. On an inflation-adjusted basis, total EPA water infrastructure appropriations in 2017 were 35 percent below the 2001 level and 13 percent below the 2011 level. (See Figure 6.)
Appropriations for rural water programs have also fallen. In 2017 dollars, appropriations fell from $614 million in 2008 (the first year for which these data are available) to $561 million in 2017, a cut of 9 percent.
The serious lead contamination in Flint, Michigan’s drinking water is a reminder of the problems that old water infrastructure can cause. Additional resources would enable the EPA and the Agriculture Department to better address high-priority needs for water infrastructure without cutting other critical environmental efforts.
Rental Aid for Low-Income Households (Back)
Federal rental assistance helps more than 5 million low-income households afford modest homes. But 3 in 4 eligible households receive no federal rental assistance due to funding limitations.[27] (See Figure 7.) Moreover, the cost of simply continuing the rental aid that families now receive rises every year, due mostly to rising rental costs in the private market. (For instance, the cost of renewing rental assistance administered by the Department of Housing and Urban Development grew by roughly $1.5 billion from 2016 to 2017.) To prevent cuts in rental assistance — and to make further progress in reducing homelessness and addressing other urgent housing problems — additional funds for rental assistance are needed in fiscal years 2018 and beyond.
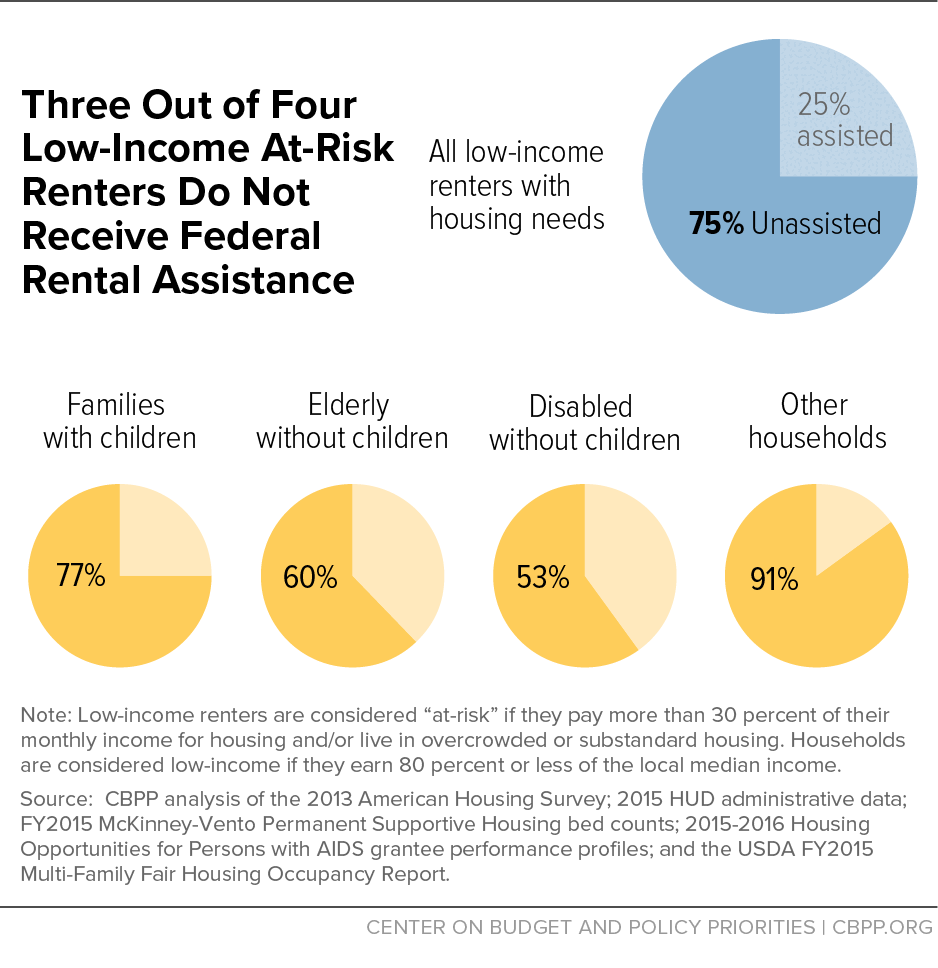
Nearly 90 percent of people with federal rental assistance are seniors, people with disabilities, or working families with children.[28] This vital aid goes to those who need it most: three-quarters of assisted households have extremely low incomes, meaning incomes at or below the poverty line or 30 percent of the local median, whichever is higher. Indeed, more than half of the nation’s rental housing that is affordable for extremely low-income households is affordable only because of federal rental assistance.
By limiting housing costs, rental assistance frees up families’ resources to spend on food, medicine, or other basic needs, as well as work-related expenses such as child care and transportation. Research also finds that rental assistance sharply reduces homelessness and other types of housing instability that can undermine children’s health, academic progress, and chances of long-term success.[29] For example, policymakers’ expansion of the Housing Choice Voucher program — the largest federal rental aid program — has contributed to a 47 percent reduction in veterans’ homelessness since 2010.[30]
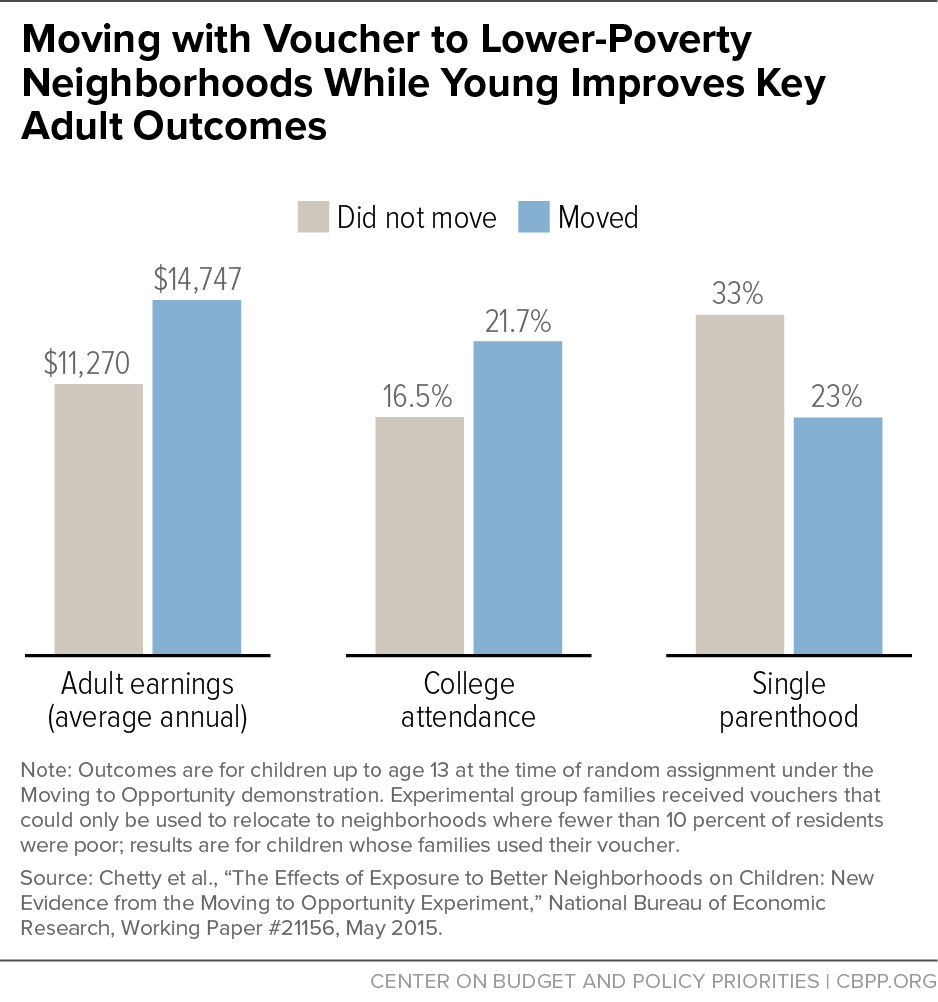
Rental aid supports families in other ways, too. It helps frail seniors and people with disabilities live independently in communities they choose, rather than in expensive nursing facilities.[31] Housing vouchers, by allowing families to rent a unit of their choice in the private market, enable families with children to move to safer neighborhoods with less poverty and higher-quality schools. Children whose families move to low-poverty neighborhoods when they are young are far more likely to attend college and less likely to become single parents, and they earn significantly more as adults, research shows.[32] (See Figure 8.)
While rental assistance supports several million families, the number of families struggling to pay rent has grown sharply over the past decade. Since 2001, the number of renter households with “worst-case housing needs” — defined as unassisted households with very low incomes that either live in severely substandard housing or pay more than half their income for housing — has risen 63 percent, to 3.2 million.[33] Moreover, while policymakers have made important progress in reducing homelessness among veterans and certain other groups, it remains a large and persistent problem. For instance, 1.3 million school-age children are homeless or living doubled up with other families, the latest Department of Education data show.[34]
Support for Elementary and Secondary Education (Back)
The federal government provides modest but important support for schools. That support has eroded in recent years, however, with appropriations for the Education Department’s elementary and secondary education programs falling by 13 percent from 2010 to 2017, after adjusting for inflation.
While the federal government provides a modest share of overall education funding, it provides a larger share of funding to schools to serve low-income students and students with disabilities — two groups that face significant challenges. Roughly 41 percent of children ages 5 to 17 are low-income according to recent Census data, and roughly 13 percent of public school students are in special education programs.[35] Federal funding helps boost resources and educational offerings and support for these students. It also helps direct resources and attention to discrete areas important for student success, such as improving teacher preparation and ongoing supports and after-school programs for disadvantaged students.
About three-quarters of appropriations for elementary and secondary education programs are for two large grant programs to local school systems (via states) aimed at promoting educational success for disadvantaged students and students with disabilities:
- “Title I” grants to local schools, which are based primarily on a school’s number of low-income students, provide additional services and support to help disadvantaged students succeed. They serve almost 24 million students in more than half of all public schools.
- Individuals with Disabilities Education Act (IDEA) grants, which help cover the cost of special education services to meet the needs of more than 7 million children with disabilities, in accordance with federal law.
Other Education Department appropriations for elementary and secondary education support grants to aid in the recruitment, training, support, and retention of high-quality teachers, after-school programs for students in high-need schools, and Impact Aid payments to assist school districts with financial burdens resulting from concentrations of federal properties and facilities, to give just a few examples.
Elementary and secondary education funding rose during the first part of the last decade, following enactment of the 2001 No Child Left Behind Act, but then generally began to slip backwards. In inflation-adjusted terms, the 2017 total is 21 percent below the high point in 2004 and 13 percent below the 2010 level. Each of the two main grant programs described above has lost 8 percent of its purchasing power since 2010. (See Figure 9.)
The Every Student Succeeds Act, passed in 2015 with strong bipartisan support, reauthorized most federal programs to aid elementary and secondary education, overhauling rules for accountability and assessment and revising various grant programs while retaining a focus on ensuring access to a quality education for all students. The law attempted to strike a balance between giving school districts and states more flexibility in designing systems to measure schools’ and students’ success while still measuring students’ academic achievement in ways that identify schools that leave some or all students behind.
With additional funding, more resources could be directed to schools serving large numbers of disadvantaged students — schools which are often under-resourced and struggling — to ensure that students have access to high-quality teachers, rigorous coursework, and the supports necessary for them to succeed. Similarly, more resources could be directed to schools to help support students with disabilities.
Head Start (Back)
Head Start and Early Head Start provide comprehensive early learning services to poor preschoolers, infants, and toddlers. The federal government provides grants to entities — typically non-profit organizations or school districts — to operate Head Start programs in local communities. Head Start started as a program for preschoolers, serving 3- and 4-year-olds, but expanded in 1995 to include Early Head Start programs for infants and toddlers due to a growing understanding of the critical developmental importance of the early years. In 2015, federal funding supported Head Start services for 945,000 children, including 115,000 infants and toddlers in Early Head Start.[36]
Head Start funding in 2017 is roughly even with its 2001 level, adjusted for inflation, though the number of poor children under age 5 has risen by half a million since 2001.[37] In addition, in 2014 the Department of Health and Human Services (HHS) launched the Early Head Start-Child Care Partnerships to support some Early Head Start programs directly and support partnerships between child care and Head Start programs to improve the quality of care for infants and toddlers in child care settings. If the funding for this initiative — $640 million in 2017 — is included, overall funding for Head Start and the Partnerships is just modestly (8 percent) above funding in 2001.
Funding remains well below what is needed to give all eligible children access to high-quality early education and to ensure that Head Start programs meet high expectations for quality. In fact, Head Start (including Early Head Start) enrollment has fallen by nearly 20,000 children from its 2011 peak of 964,000, as funding hasn’t kept up with the cost of providing quality early education.[38] The National Women’s Law Center estimates that Head Start serves just 46 percent of eligible 3- and 4-year-olds and Early Head Start serves just under 5 percent of eligible infants and toddlers.[39] Without adequate funding, Head Start will either serve fewer and fewer children or will be forced to reduce quality of services.
Serving more poor children is only one reason Head Start needs more resources. Increased investment is also needed to ensure that Head Start provides the high-quality early learning that low-income children need to start kindergarten healthy and ready to succeed.
Bipartisan reauthorization legislation enacted in 2007 called for higher educational standards for Head Start teachers and required HHS to institute a system in which Head Start grantees that didn’t meet certain quality benchmarks would have to compete for continued funding. These measures are designed to improve the program’s quality and effectiveness. But, hiring teachers with bachelor’s degrees and ensuring that programs effectively help children reach educational and developmental milestones costs money. In fact, even as the share of Head Start teachers with bachelor’s degrees has increased from 47 percent in 2008 (before enactment of the legislation) to 73 percent in 2015, average salaries of lead classroom teachers continue to lag those of publicly funded pre-kindergarten and kindergarten teachers.[40]
As part of efforts to improve quality, HHS also recently revamped the Head Start performance standards. Among other changes, it set a timetable for raising the number of hours children are in Head Start classrooms. Under the new regulations, all programs (with limited exceptions) are supposed to provide all children with a full school day, full school year program by 2021 — and provide at least half of all children with a full school day and year program by 2019. For preschoolers, a full school day and year program would mean that children would receive at least 1,020 annual hours of service (the equivalent of six hours per day for 170 days a year).[41] Under the prior requirements, Head Start preschool programs could meet for as little as 3.5 hours per day for 128 days per year. While many programs exceeded this minimum standard, fewer than half of Head Start preschoolers attended a full-day, full-year program in 2015.[42]
The new regulation’s emphasis on transitioning to full-day, full-year programs has broad support and is based on research suggesting that children in programs with more hours and more days each year have better outcomes.[43] But ensuring that Head Start programs can provide all children with this robust program will take significant additional investment.
Policymakers provided $294 million in 2016 to begin increasing the number of children attending Head Start for a full school day and year. Unfortunately, they did not provide any additional resources in 2017 to further expand full school day and year program offerings. For all programs to meet the 2019 target as well as other performance standards, while also keeping up with inflation to maintain enrollment, an additional $600 million is needed in 2018. To meet the 2021 target and other performance standards, 2020 funding must be $1.6 billion above the current level (see Figure 10).[44]
While these increases are not enormous in magnitude, securing a $600 million increase in Head Start may be extremely difficult in 2018 if full sequestration cuts take effect and overall NDD funding falls between 2017 and 2018. In 2017, when partial sequestration relief was in place, Congress provided funding to cover some of the cost of inflation, but provided no additional resources to start down the road of meeting the new performance standards.
Internal Revenue Service (Back)
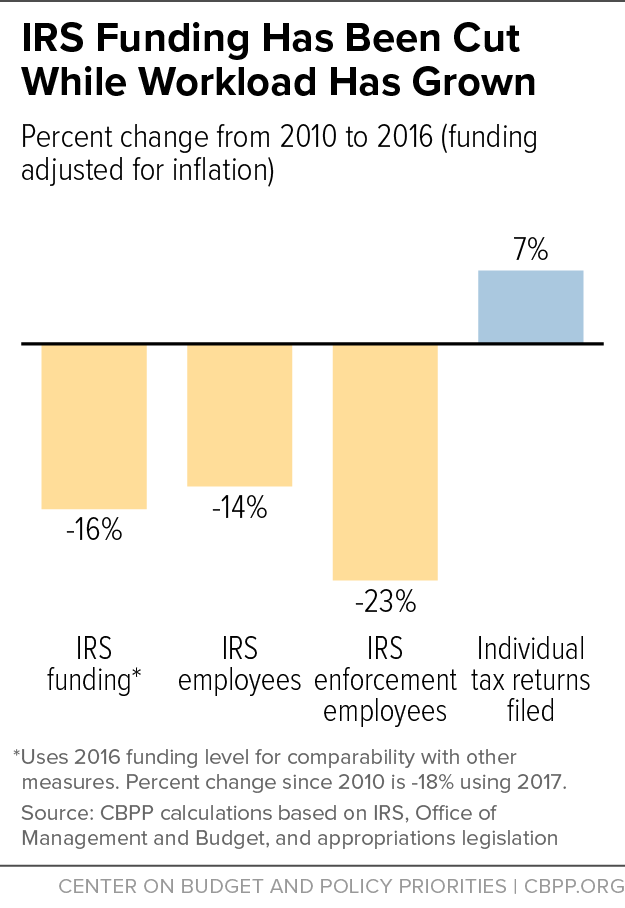
As seven former IRS commissioners from both Republican and Democratic administrations have written: “Over the last fifty years, none of us has ever witnessed anything like what has happened to the IRS appropriations over the last five years and the impact these appropriations reductions are having on our tax system.”[45] While the IRS budget grew modestly between 2001 and 2010, it has been targeted for particularly sharp funding cuts since then — its 2017 budget of $11.2 billion is 18 percent below its 2010 level, after adjusting for inflation. These cuts have weakened the agency’s ability to perform its core functions of collecting taxes and enforcing the nation’s tax laws.
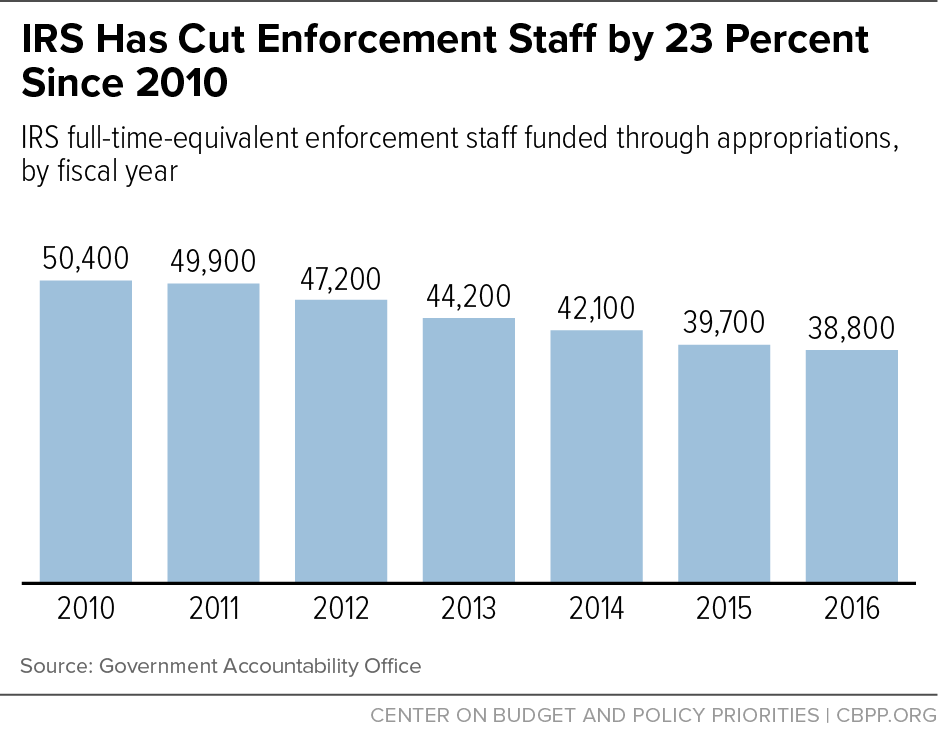
As most IRS funding goes to staffing, the cuts have forced the IRS to dramatically reduce its workforce. Between 2010 and 2016, it lost 14 percent of its workforce, or roughly 13,000 employees. IRS funding and staffing for enforcement have been cut especially sharply – over that same period, enforcement lost 23 percent of its workforce, or roughly 11,000 employees. [46] (See Figure 11.)
These cuts have occurred even as the agency’s responsibilities have grown. In 2016, the IRS processed 10 million more individual tax returns than it did in 2010.[47] It has also dedicated more resources to respond to growing cybersecurity threats from hackers and identity thieves, as well as to implement major new tax legislation.
Cuts to IRS funding and staffing have affected taxpayer services, cybersecurity, and enforcement[9]
- Taxpayer services are at subpar levels. In 2016, the agency answered only 53 percent of taxpayers’ calls and callers waited almost 18 minutes on average for an answer.[48]
- The IRS has had to delay much-needed upgrades to its information technology systems, compromising the security of taxpayer data and weakening its ability to identify and assist victims of identity theft. About 60 percent of its hardware and 28 percent of its software is out of date — and some of its software is at least 50 years old.[49]
- Deep enforcement cuts have reduced the IRS’s ability to go after tax cheats. The IRS audited just 1 of every 140 individual returns in 2016, down from 1 of 90 returns in 2010.[50] IRS Commissioner John Koskinen has stated, “We estimate we’re leaving on the table $10 billion a year in uncollected revenue [from] the audits we can’t do because we don’t have enough people.”[51] Underfunding enforcement is penny-wise and pound-foolish. Treasury estimates that every additional $1 invested in enforcement can produce $6 in additional revenue, and the additional, indirect savings from deterring tax evasion are more than three times that.[52]
- The IRS’s Criminal Investigations division, which investigates activities such as identity theft, tax evasion, money laundering, and terrorist financing, initiated 28 percent fewer investigations in 2016 than it did in 2010.[53]
As its responsibilities continue to grow, IRS funding should grow accordingly. Underfunding the IRS reduces its effectiveness and undermines the public’s trust that the tax laws will be enforced fairly.
Foreign Development and Humanitarian Aid (Back)
U.S. foreign aid has earned high marks for effectiveness and has the support of many military officials, but its level (when measured as a share of the economy) is far below that of other developed countries and the agreed-upon international goal for addressing the world’s development problems. Also, U.S. funding levels have fallen even further behind other countries since 2010, even though extreme poverty and the severe living conditions that result still harm hundreds of millions of people around the world.
U.S. development and humanitarian aid covers areas such as bilateral development aid, global health challenges, contributions to multilateral institutions that can be used for development aid, food aid, emergency relief, migration and refugee assistance, the Peace Corps, and efforts to combat the drug trade. Federal funding for programs in the international development and humanitarian assistance part of the budget, which constitute the heart of U.S. foreign aid, stood at $29.2 billion in 2017.[54] While a slight increase from its 2010 level, spending on these programs amounts to a tiny fraction of total federal spending — less than 1 percent.
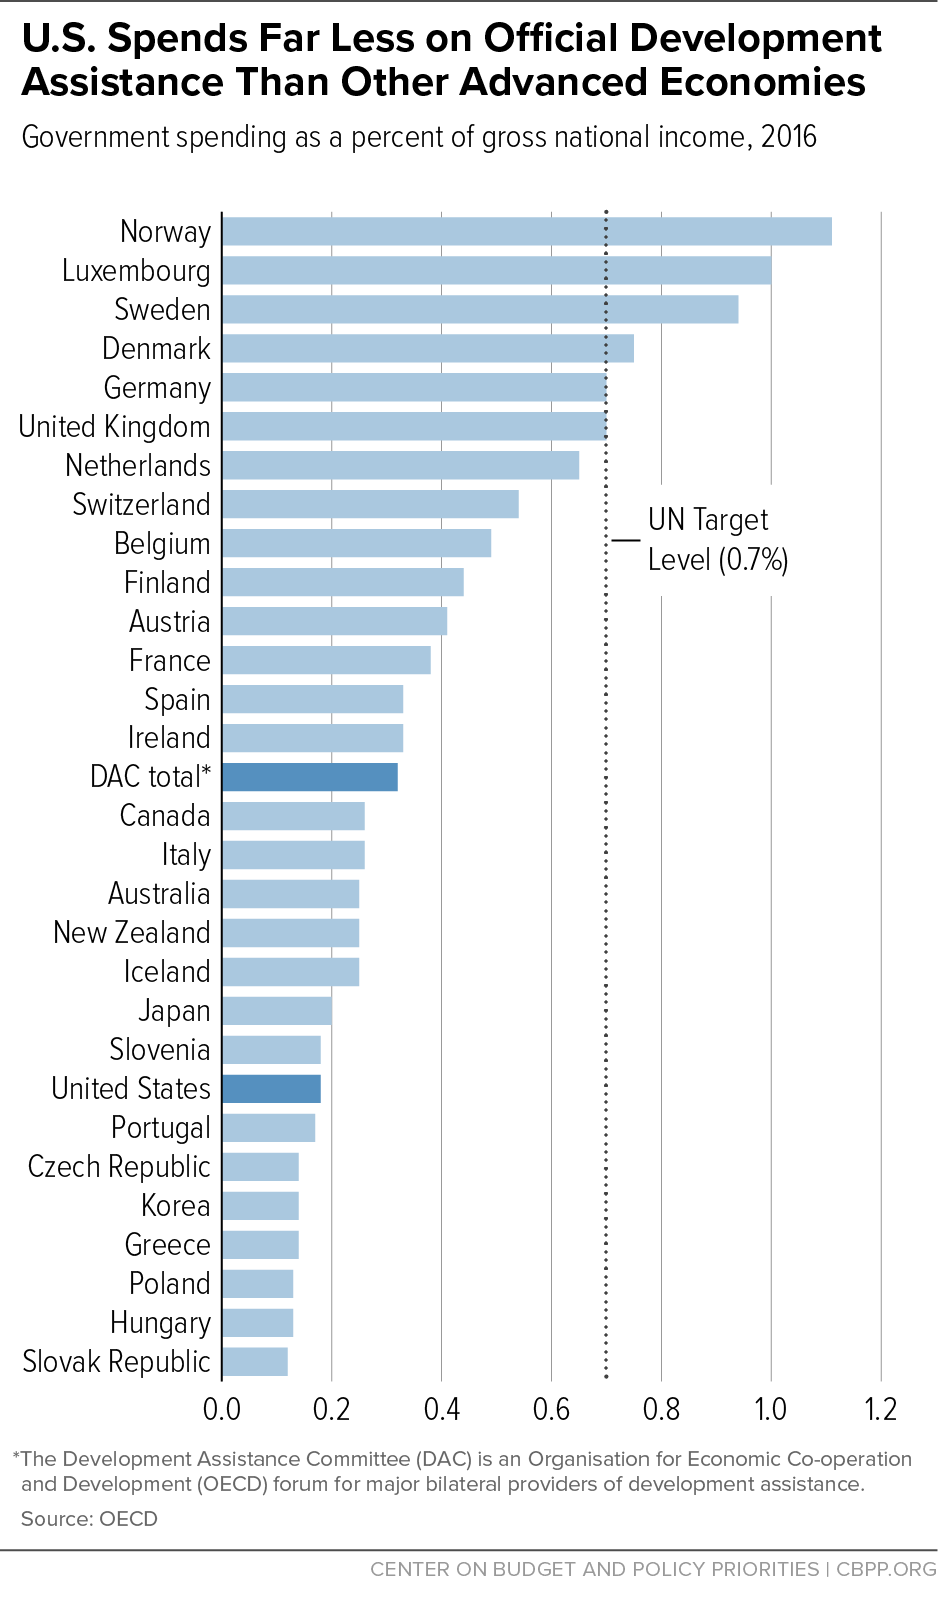
The Organisation for Economic Co-operation and Development (OECD) produces widely used information that compares the Official Development Assistance (ODA), which funds “economic development and welfare of developing countries,” provided by 29 developed nations. (See Figure 13.) The latest OECD data show that U.S. ODA spending totaled $33.6 billion in 2016,[55] and that:
- The United States is the world’s largest donor in absolute dollars, contributing one-third more than Germany, the second-largest donor. But that isn’t the best measure. The United States can afford to donate far more, just as a wealthy person can contribute considerably more dollars to charity than a low- or moderate-income person. The U.S. economy is more than five times the size of Germany’s. Thus, Germany contributes 0.7 percent of its economy to ODA — nearly four times the 0.18 percent the United States contributes.
- Accordingly, international comparisons typically focus on aid as a percent of the economy as a measure of a nation’s commitment to providing ODA to poorer countries. The United States ranks 22nd out of the 29 countries OECD examined in ODA spending as a percent of the economy, lagging all of the other most highly industrialized countries: Canada, France, Germany, Italy, Japan, and the United Kingdom.
- The U.S. ODA contribution of 0.18 percent of its economy compares to a 0.32 percent contribution by the 29 countries as a whole. The United States would need to increase its spending by three-quarters to achieve that 0.32 percent level.
- The gap between the U.S. commitment and that of other high-income nations has grown since 2010, as U.S. ODA has fallen as a percent of the economy while the aggregate ODA of other countries has risen modestly.
Since 1970 the international community has targeted 0.7 percent as the share of their economies that rich nations need to commit to reach international development goals. Six countries (including Germany and the United Kingdom for the past four years) now meet this U.N. target; the U.S. commitment level is little more than one-quarter of this standard.
The development needs of the global poor remain dramatic, even though development aid has contributed to a sharp reduction in “extreme poverty” in recent decades.[56] In its description of its sustainable development goals, the United Nations notes that 836 million people still live in extreme poverty, with incomes of less than $1.25 a day, and that nearly 1,000 children die every day due to preventable water and sanitation-related diseases.[57] Further, the famine threatening the Horn of Africa — which has produced the largest humanitarian crisis since at least 1945, with an estimated 20 million people at risk of starvation — dramatically underscores the need for foreign aid.[58]
The Center for Global Development finds that the United States is particularly effective at targeting its aid on poor countries and being transparent about its efforts.[59] In addition, U.S. military officials are among the strongest supporters of U.S. development aid because it helps address the root causes of many conflicts. As 121 retired generals and admirals wrote congressional leaders earlier this year:[60]
The State Department, USAID, Millennium Challenge Corporation, Peace Corps and other development agencies are critical to preventing conflict and reducing the need to put our men and women in uniform in harm’s way. As [current Defense] Secretary James Mattis said while Commander of U.S. Central Command, “If you don’t fully fund the State Department, then I need to buy more ammunition.” The military will lead the fight against terrorism on the battlefield, but it needs strong civilian partners in the battle against the drivers of extremism — lack of opportunity, insecurity, injustice, and hopelessness.
National Park Maintenance and Repair (Back)
The National Park Service oversees 417 sites covering more than 84 million acres, including national parks, historic areas, battlefields, recreation areas, seashores, and several other categories; over 300 million people visit these places each year. The Park Service reports a backlog of almost $12 billion in maintenance and repair needs at the parks and other sites it operates. (See Figure 14.) The backlog has grown in recent years due to inadequate funding.
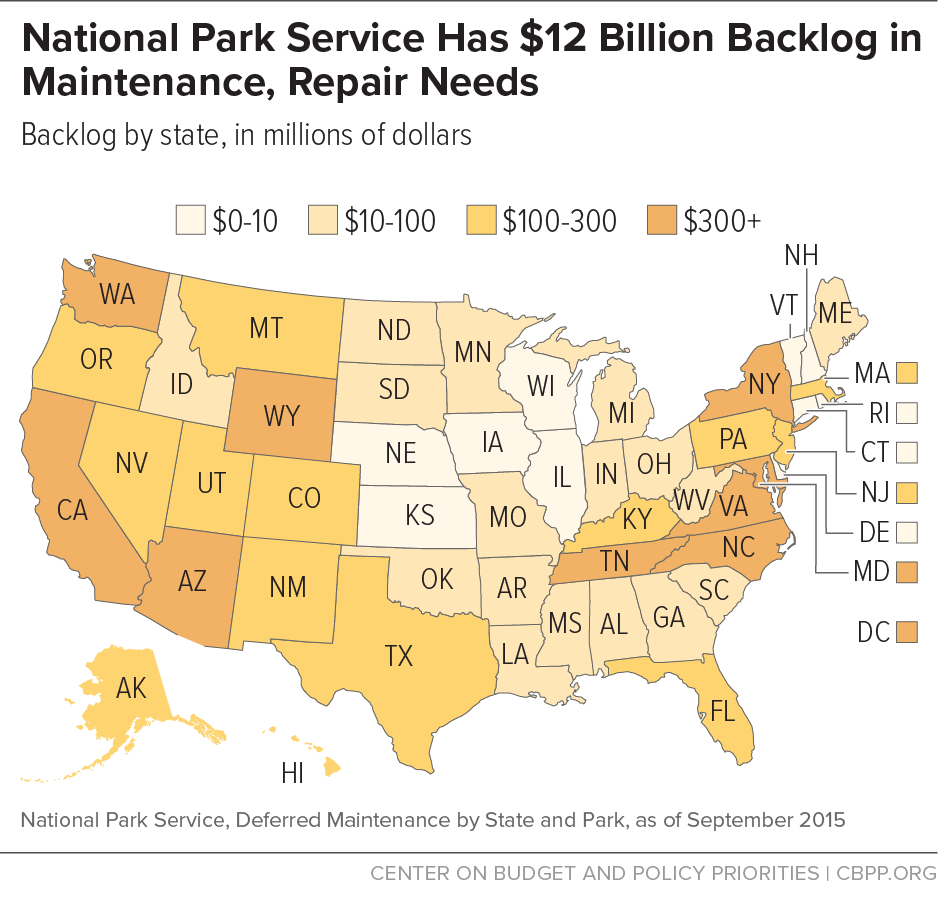
About half of this deferred maintenance backlog involves paved roads, bridges, and tunnels; the rest includes buildings, drinking water and wastewater treatment systems, dams, and historic structures.[61]
One reason for these large needs is that many park facilities and structures were put in place during a major Eisenhower Administration initiative to rehabilitate and improve national park infrastructure over a ten-year period starting in 1956. Others date back to the work of the Civilian Conservation Corps during the 1930s. As a result, many facilities are aging and in need of repair, rehabilitation, or replacement.
Funding for roads, bridges, and tunnels comes largely from the Highway Trust Fund, while other maintenance and repairs are funded through annual appropriations.[62] Larger projects are supported through the Park Service’s construction account, which received just $209 million in 2017 — 62 percent less than in 2001 and 19 percent less than 2010, after adjusting for inflation.
Smaller projects and ongoing maintenance are funded through the Operation of the National Park System account, which also covers personnel and other operating costs. Over the past decade, appropriations for the operation account have not kept pace with the growing number of people visiting Park Service facilities. The problem has worsened in recent years: between 2010 and 2016, funding fell by 5 percent in inflation-adjusted terms, while the number of visitors grew by 18 percent.[63]
The Park Service estimates that maintenance needs are roughly double the annual funding provided to address them; as a result, the maintenance backlog continues to grow.[64] (It grew by $410 million just between 2014 and 2015, after adjusting for inflation.) Without sufficient funding to substantially reduce that backlog, facilities will likely continue to deteriorate, impairing services to visitors and protection of historical and cultural assets — and increasing future costs for repair and replacement.
Maintenance of Federally Funded Tribal Schools (Back)
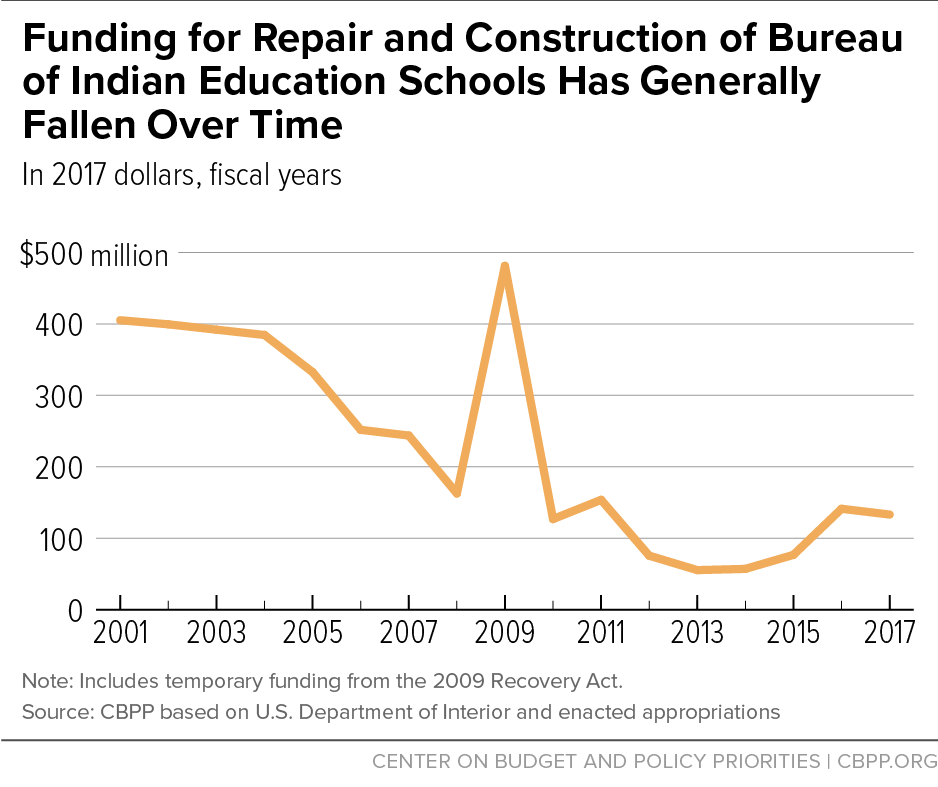
The federal government supports Native American students across the country, either directly through the Interior Department’s Bureau of Indian Education (BIE) schools — which serve about 48,000 elementary and secondary students in 23 states — or indirectly through assistance to public schools from the Department of Education and other agencies. While BIE schools serve a small share of Native American students, they focus on members of tribes that tend to be geographically isolated and face various challenges, including poverty. Many BIE-funded tribal schools are outdated, and construction funding remains insufficient to address current maintenance backlogs.
As a Congressional Research Service report explains: “For at least 20 years, BIE school facilities have been characterized by a very large number of old facilities with a high rate of deficiencies.”[65] Roughly one-quarter of BIE schools were reported to be more than 40 years old in 2011, and some were much older. A Montana tribe, for example, expressed concerns about its school, which was 100 years old in 2014.[66]
Construction funding for BIE schools has generally fallen since 2001, the major exception being additional Recovery Act funding provided in 2009 (see Figure 15). At $133 million, funding in 2017 is 67 percent below the 2001 level but 5 percent above the 2010 level, after adjusting for inflation.
Despite some improvement and temporary relief, BIE schools lack adequate funding for construction to address documented needs. At the end of 2015, BIE school buildings had almost $400 million in deferred maintenance, with 55 elementary and secondary schools (30 percent of all BIE schools) in poor condition. The total backlog, including both schools and employee housing, was about $600 million.[67]
Old and unsafe facilities reduce educational opportunities for BIE students, who are already struggling. Their average reading and math scores in 2015 were 6 to 7 percent lower than those for other Native American students in public schools; the gaps compared to students in other ethnic groups were even wider.[68] Lack of decent employee housing presents a special challenge to BIE schools, which already find recruiting staff difficult. Moreover, failure to address backlogs can place funding pressure on other construction and maintenance projects to ensure a clean and energy-efficient environment for students and staff.
Policymakers have recognized the federal government’s responsibility to support tribal education on several occasions, such as through the Native American Education Improvement Act of 2001. Making the needed investments in these schools will require additional resources.
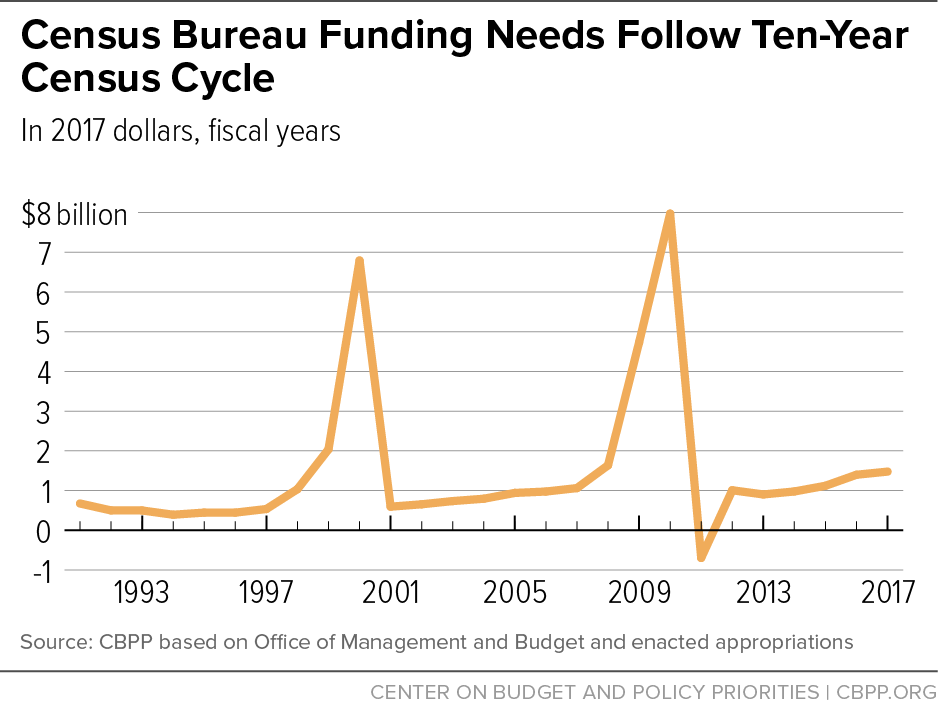
Preparations for the 2020 Census (Back)
The Constitution requires the federal government to take a census of the U.S. population every ten years. This is a massive and complex undertaking, which must accurately count more than 300 million residents living at more than 100 million addresses. An accurate census requires extensive testing, planning, outreach, and logistical preparation throughout the decade, with activities accelerating years before the actual count. Preparations for the 2020 census have already been delayed, curtailed, or canceled due to funding shortfalls, however, and the 2011 Budget Control Act’s tight appropriations caps will likely lead to future shortfalls that worsen the damage.
The census is part of the foundation of the nation’s economy and political system. It enables states and individuals to receive fair representation in Congress, governs the allocation of billions of dollars each year in federal funds, and forms the statistical backbone for numerous surveys that drive fact-based decision-making by businesses, communities, lawmakers, and voters.
The 2017 appropriations for the Census Bureau were $164 million less than the $1.6 billion the Obama Administration had requested for census preparations and other important work — and those appropriations were not enacted until the fiscal year was more than half over. The funding problems have already led to alarming cuts in key planning activities, forcing the bureau to:
- Cancel all on-site portions of the 2017 Census Test, which aimed to evaluate new methods and advanced technologies to improve data collection during the census. As one consequence, the bureau had to cancel the only scheduled tests of new methods for reaching remote and rural communities.
- Reduce its use of large databases to check address lists, forcing the bureau to rely on far costlier door-to-door address canvassing in 2019.
- Delay advertising and outreach that are crucial to building community support. These activities keep costs down by encouraging residents to respond without costly follow-up efforts. They also enhance the accuracy of the census by targeting historically hard-to-count communities with messages from trusted voices.
- Delay opening of three of six regional centers to provide logistical help in running the census.
- Pause a planned 2018 test of the Census Coverage Measurement program, which will measure the accuracy of the census and produce undercount and overcount estimates.
Based on lack of funding and technical challenges, in January the Government Accountability Office added the 2020 census to its “high risk” list of programs and agencies.[69]
The situation could become more acute as the cost of ramping up for the 2020 count collides with the appropriations caps. During the next three years, the Census Bureau will need to test procedures and equipment, check address lists, rent field offices, solicit local support for completing the census, and hire and train staff. Figure 16 shows the pattern of funding needed to prepare for past decennial censuses, with substantial increases beginning several years before the census date. Providing those necessary increases would be difficult under current appropriations constraints, let alone tighter ones.
Census data is vital to fact-based decision-making for businesses, school boards, city planners, voters, public health officials, emergency planners and first responders, and others in society. For this reason, in 2016, diverse interest groups ranging from business groups like realtors and automobile dealers to civil rights groups like the National Association for the Advancement of Colored People (NAACP) urged Congress to properly fund planning for the 2020 Census.[70]
Similarly, in 2015, the Center on Budget and Policy Priorities (CBPP) and American Enterprise Institute scholar Andrew Biggs joined to urge adequate funding for the census, writing:
No policy or philosophical outlook is well-served by a lack of accurate data. The alternative to accurate, detailed data on American households is policy-by-anecdote, in which lawmakers respond to perceived needs without data on how large or widespread a problem might be. Such a process would spend federal funds neither effectively nor wisely.[71]
End Notes
[1] Other CBPP staff contributing to this report include Raheem Chaudhry, Guillermo Herrera, Emily Horton, Sharon Parrott, Douglas Rice, Kathleen Romig, Isaac Shapiro, and Arloc Sherman.
[2] Estimates of needs highlighted are cited in later sections of this paper.
[3] This funding is called “discretionary” because the law creating these agencies and programs has left Congress with discretion to set funding levels through the annual appropriations process, as distinct from entitlement and other “mandatory” programs, where spending is determined by the underlying law governing the program.
[4] Based on Congressional Budget Office (CBO) cost estimate for the Consolidated Appropriations Act, 2017.
[5] The $3 billion reduction is the net result of a $12 billion scheduled increase in the underlying pre-sequestration cap, combined with a $15 billion increase in sequestration due to expiration of the 2015 sequestration relief legislation.
[6] This also includes funds from the Temporary Assistance for Needy Families (TANF) block grant that are transferred into the Child Care and Development Fund (CCDF).
[7] Office of the Assistance Secretary for Planning and Evaluation, “Estimates of Child Care Eligibility and Receipt for Fiscal Year 2012,” Department of Health and Human Services (HHS), November 2015, https://aspe.hhs.gov/pdf-report/estimates-child-care-eligibility-and-receipt-fiscal-year-2012. This includes approximately 690,000 children who are covered through child care assistance that is financed with TANF funds that are not transferred to CCDF and/or with Social Services Block Grant funds.
[8] Participation estimates from Office of Child Care, “Child Care and Development Fund Statistics,” https://www.acf.hhs.gov/occ/resource/ccdf-statistics; poverty estimates from CBPP analysis of Census Bureau’s 2002 and 2016 March Current Population Survey data.
[9] For more information, see: “Overview of 2016 Child Care and Development Fund Final Rule,” https://www.acf.hhs.gov/sites/default/files/occ/ccdf_final_rule_fact_sheet.pdf, and “Child Care and Development Fund Program,” Federal Register 81(190), https://www.gpo.gov/fdsys/pkg/FR-2016-09-30/pdf/2016-22986.pdf.
[10] Stephanie Schmit and Hannah Matthews, “Child Care and Development Block Grant Investment Could Support Bipartisan Reforms, Stop Decline in Children Served,” Center for Law and Social Policy (CLASP), April 2017, http://www.clasp.org/resources-and-publications/publication-1/1.4-Billion-Needed-for-CCDBG-in-2018.pdf.
[11] CLASP analysis of Office of Child Care administrative spending and participation data from https://www.acf.hhs.gov/occ/data, Congressional Budget Office inflation projections, and HHS cost estimates of implementation of the Child Care and Development Block Grant Act of 2014.
[12] For more information, see Department of Labor, “What Works In Job Training: A Synthesis of the Evidence,” July 22, 2014, https://www.dol.gov/asp/evaluation/jdt/jdt.pdf; Center for Postsecondary and Economic Success, “Fast Facts,” Center for Law and Social Policy (CLASP), http://www.clasp.org/issues/postsecondary/fast-facts.
[13] Sarah Burd-Sharps and Kristen Lewis, “Promising Gains, Persistent Gaps: Youth Disconnection In America,” Measure of America, March 2017, http://www.measureofamerica.org/youth-disconnection-2017/. A Congressional Research Service report estimates that there are over 2 million youth in the category, but this does not capture those who recently dropped out of school or had a short stint of employment due to caretaking responsibilities, housing instability, transportation issues, health issues, and other barriers. The Workforce Innovation and Opportunity Act’s definition of out-of-school youth encompasses those that face these barriers and is aligned better with the higher estimate.
[14] CBPP estimate based on CLASP analysis of state administrative data.
[15] Along with the core funding discussed here, recent appropriation bills have provided extra funds exclusively for program integrity work, a special adjustment that lies outside the 2011 Budget Control Act’s annual spending caps.
[16] Field office staff fell from 30,600 at the end of fiscal year 2010 to 28,400 at the end of fiscal year 2016. As of February 17, 2017, staffing fell to 27,400. SSA, “Field Office Historic Staffing;” National Council of Social Security Management.
[17] SSA, “The State of Services,” December 2016.
[18] Ibid.
[19] SSA, “Annual Performance Report, 2014-2016,” http://www.ssa.gov/agency/performance/2016/FINAL_2014_2016_APR_508_compliant.pdf.
[20] Kathleen Romig, “Cuts Weakening Social Security Administration Services,” Center on Budget and Policy Priorities, June 3, 2016, https://www.cbpp.org/research/social-security/cuts-weakening-social-security-administration-services.
[21] SSA, “Hearing Office Average Processing Time Ranking Report, FY 2017 (For Reporting Purposes: 10/01/2016 through 01/27/2017),” https://www.ssa.gov/appeals/DataSets/05_Average_Processing_Time_Report.html.
[22] Kathy Ruffing, “No Surprise: Disability Beneficiaries Experience High Death Rates,” Center on Budget and Policy Priorities, April 4, 2013, https://www.cbpp.org/blog/no-surprise-disability-beneficiaries-experience-high-death-rates.
[23] American Society of Civil Engineers, “2017 Infrastructure Report Card: A Comprehensive Assessment of America’s Infrastructure,” March 2017, http://www.infrastructurereportcard.org/wp-content/uploads/2016/10/2017-Infrastructure-Report-Card.pdf.
[24] Environmental Protection Agency, “Drinking Water Needs Survey and Assessment,” April 2013, https://www.epa.gov/sites/production/files/2015-07/documents/epa816r13006.pdf; “Clean Watersheds Needs Survey 2012,” January 2016, https://www.epa.gov/sites/production/files/2015-12/documents/cwns_2012_report_to_congress-508-opt.pdf.
[25] American Water Works Association, “Buried No Longer: Confronting America’s Water Infrastructure Challenge,” https://www.awwa.org/Portals/0/files/legreg/documents/BuriedNoLonger.pdf.
[26] States, in turn, use those funds to make low-interest loans to localities for water infrastructure projects, along with certain other forms of assistance. As loans are repaid, funds become available to make new loans, thus considerably magnifying the long-term effect of the federal investment. However, given the massive needs for additional infrastructure investments and the long-term nature of many revolving fund loans, additional federal capital contributions continue to be needed.
[27] Center on Budget and Policy Priorities, “Three Out of Four Low-Income At-Risk Renters Do Not Receive Federal Rental Assistance,” https://www.cbpp.org/three-out-of-four-low-income-at-risk-renters-do-not-receive-federal-rental-assistance.
[28] Center on Budget and Policy Priorities, “Policy Basics: Federal Rental Assistance,” https://www.cbpp.org/research/housing/policy-basics-federal-rental-assistance.
[29] Will Fischer, “Research Shows Housing Vouchers Reduce Hardship and Provide Platform for Long-Term Gains Among Children,” Center on Budget and Policy Priorities, October 7, 2015, https://www.cbpp.org/research/housing/research-shows-housing-vouchers-reduce-hardship-and-provide-platform-for-long-term.
[30] Ehren Dohler, “Veterans’ Homelessness Cut in Half Since 2010,” Center on Budget and Policy Priorities, November 8, 2016, https://www.cbpp.org/blog/veterans-homelessness-cut-in-half-since-2010.
[31] Ehren Dohler et al., “Supportive Housing Helps Vulnerable People Live and Thrive in the Community,” Center on Budget and Policy Priorities, May 31, 2016, https://www.cbpp.org/research/housing/supportive-housing-helps-vulnerable-people-live-and-thrive-in-the-community.
[32] Raj Chetty, Nathaniel Hendren, and Lawrence F. Katz, “The Effects of Exposure to Better Neighborhoods on Children: New Evidence from the Moving to Opportunity Experiment,” American Economic Review 2016, 106(4): 855–902.
[33] Department of Housing and Urban Development, “Preview of 2015 Worst Case Housing Needs,” January 2017, https://www.huduser.gov/portal/publications/Preview-2015-Worst-Case-Housing-Needs.html.
[34] ED Data Express, “Total Number of Homeless Students Enrolled in LEAs with or without McKinney-Vento Subgrants — Total: 2014-15,” retrieved from https://eddataexpress.ed.gov/data-elements.cfm.
[35] Low-income is defined as below 200 percent of the federal poverty level. The latest estimate for low-income school-aged children is for 2015 and from the Census Bureau’s Current Population Survey Detailed Tables for Poverty, https://www.census.gov/data/tables/time-series/demo/income-poverty/cps-pov/pov-01.2015.html. The latest estimate for special education is for academic year 2014-15 and from National Center for Education Statistics, “2016 Digest of Education Statistics,” Table 204.30, https://nces.ed.gov/programs/digest/d16/tables/dt16_204.30.asp.
[36] Administration for Children and Families (ACF), “Head Start Program Facts, Fiscal Year 2015,” Department of Health and Human Services (HHS), February 8, 2017, https://eclkc.ohs.acf.hhs.gov/hslc/data/factsheets/docs/head-start-fact-sheet-fy-2015.pdf and 2015 Head Start Program Information Report.
[37] CBPP analysis of Census Bureau data from the 2001-2016 March Current Population Survey.
[38] ACF, “Head Start Program Facts, Fiscal Year 2015.”
[39] National Women’s Law Center calculations based on data on Head Start enrollment in fiscal year 2016 from “Fiscal Year 2017 Administration for Children and Families Justification of Estimates for Appropriations Committees,” p. 111, https://www.acf.hhs.gov/sites/default/files/olab/final_cj_2017_print.pdf and data on the number of children ages 3 and 4 in poverty in 2015 from the Census Bureau’s Current Population Survey Detailed Tables for Poverty, http://www.census.gov/data/tables/time-series/demo/income-poverty/cps-pov/pov-34.html.
[40] National Survey of Early Care and Education, “Number and Characteristics of Early Care and Education (ECE) Teachers and Caregivers,” November 5, 2013, https://www.acf.hhs.gov/opre/resource/number-and-characteristics-of-early-care-and-education-ece-teachers-and.
[41] 45 CFR 1302.21. See “Head Start Performance Standards,” Federal Register 81(172), September 6, 2016, https://www.gpo.gov/fdsys/pkg/FR-2016-09-06/pdf/2016-19748.pdf.
[42] ACF, “Head Start Program Facts, Fiscal Year 2015.”
[43] Christopher Walters, “Inputs in the Production of Early Childhood Human Capital: Evidence from Head Start,” National Bureau of Economic Research, Working Paper 20639, October 2014, http://www.nber.org/papers/w20639.pdf; Abbie Lieberman, “What’s the Secret Sauce for an Effective Head Start Program?” New America, November 20, 2014, http://dev-edcentral.pantheonsite.io/secretsauceheadstart/.
[44] CBPP based on HHS estimates from 45 CFR 1302.21 and Bureau of Labor Statistics inflation data. While the target of 50 percent of all children in each Head Start program participating in a full school day and year program goes into effect in August 2019, the funding would be needed in fiscal year 2018 to meet that standard in August 2019.
[45] Former Internal Revenue Service (IRS) Commissioners Mortimer M. Caplan, Sheldon S. Cohen, Lawrence B. Gibbs, Fred T. Goldberg, Jr., Shirley D. Peterson, Margaret M. Richardson, and Charles O. Rossotti, “Letter to the Honorable Thad Cochran, the Honorable Barbara A. Mikulski, the Honorable Harold Rogers, and the Honorable Nita M. Lowey: IRS Appropriations for Fiscal Year 2016,” November 9, 2015, http://taxprof.typepad.com/files/former-irs-commissioners-letter-on-agency-budget.pdf.
[46] Government Accountability Office, “Internal Revenue Service: Observations on IRS’s Operations, Planning, and Resources,” February 27, 2015, p. 35, http://www.gao.gov/assets/670/668769.pdf; “Internal Revenue Service: Preliminary Observations on the Fiscal Year 2017 Budget Request and 2016 Filing Season Performance,” March 8, 2016, p. 9, http://www.gao.gov/assets/680/675668.pdf.
[47] IRS, “2017 and Prior Year Filing Season Statistics,” https://www.irs.gov/uac/2017-and-prior-year-filing-season-statistics.
[48] Government Accountability Office, “2015 Tax Filing Season: Deteriorating Taxpayer Service Underscores Need for a Comprehensive Strategy and Process Efficiencies,” December 16, 2015, https://www.gao.gov/products/GAO-16-151; National Taxpayer Advocate, “Annual Report to Congress 2016: Executive Summary,” Internal Revenue Service, 2017, https://taxpayeradvocate.irs.gov/2016AnnualReport.
[49] John Koskinen, “Prepared Remarks of John Koskinen Before the National Press Club in Washington, DC, April 5, 2017,” https://www.irs.gov/uac/newsroom/prepared-remarks-of-john-a-koskinen-before-the-national-press-club-washington-dc-april-5-2017; “Koskinen Discusses Major Challenges Facing IRS,” Tax Notes, February 24, 2015.
[50] IRS, “2016 Data Book,” https://www.irs.gov/pub/irs-soi/16databk.pdf; “2010 Data Book,” https://www.irs.gov/pub/irs-soi/10databk.pdf.
[51] William Hoffman, “Koskinen Prefers Permanent Replacement as Brady Calls for Ouster,” Tax Notes, April 6, 2017.
[52] Department of the Treasury, “The Budget of the United States Government, Fiscal Year 2017,” p. 1051, https://obamawhitehouse.archives.gov/sites/default/files/omb/budget/fy2017/assets/tre.pdf.
[53] IRS, “Enforcement Statistics,” https://www.irs.gov/uac/enforcement-statistics-criminal-investigation-ci-enforcement-strategy.
[54] Figure reflects the budget category called subfunction 151.
[55] For data, see Organisation for Economic Co-operation and Development (OECD), “Compare Your Country: Official Development Assistance 2016,” http://www2.compareyourcountry.org/oda?cr=oecd&lg=en. The spending figure from OECD differs from the funding level for programs in subfunction 151 due to differing definitions.
[56] Sarah Rose, “Some Answers to the Perpetual Question: Does US Foreign Aid Work – and How Should the US Government Move Forward with What We Know?” Center for Global Development, April 25, 2017, https://www.cgdev.org/publication/some-answers-perpetual-question-does-us-foreign-aid-work.
[57] See goals 1 and 6 in: United Nations, “Sustainable Development Goals: 17 Goals To Transform Our World,” http://www.un.org/sustainabledevelopment/sustainable-development-goals/.
[58] Faith Karimi, “20 million at risk of starvation in world’s largest crisis since 1945, UN says,” CNN, March 12, 2017. http://www.cnn.com/2017/03/11/africa/un-famine-starvation-aid/.
[59] Center for Global Development, “United States — Commitment to Development Index,” https://www.cgdev.org/cdi-2016/country/USA.
[60] General Keith B. Alexander et al., “Letter to the Honorable Paul Ryan, the Honorable Nancy Pelosi, the Honorable Mitch McConnell, and the Honorable Chuck Schumer,” February 27, 2017, http://www.usglc.org/downloads/2017/02/FY18_International_Affairs_Budget_House_Senate.pdf.
[61] For more information, including totals for individual parks, see: National Park Service (NPS), “NPS Deferred Maintenance Reports,” https://www.nps.gov/subjects/plandesignconstruct/defermain.htm.
[62] Only annual appropriations are subject to the 2011 Budget Control Act caps. Funding provided by the Highway Trust Fund is outside the caps.
[63] Data for number of visitors from NPS, “Annual Summary Report,” https://irma.nps.gov/Stats/Reports/National.
[64] See “NPS Deferred Maintenance Reports.”
[65] Congressional Research Service, “Indian Elementary-Secondary Education: Programs, Background, and Issues,” August 18, 2015, p.41.
[66] Tribal representatives and Federal representatives, “Broken Promises, Broken Schools: Report of the No Child Left Behind School Facilities and Construction Negotiated Rulemaking Committee,” December 2011, https://www.bia.gov/cs/groups/xraca/documents/document/idc1-025523.pdf; “Findings and Recommendations Prepared by the Bureau of Indian Education Study Group Submitted to the Secretaries of the Departments of the Interior and Education,” June 27, 2014, https://bie.edu/cs/groups/xbie/documents/document/idc1-031629.pdf.
[67] Bureau of Indian Affairs, “Budget Justifications, Fiscal Year 2017,” p. IA-CON-ED-5 and IA-CON-ED-8, https://www.doi.gov/sites/doi.gov/files/uploads/FY2017_IA_Budget_Justification.pdf.
[68] National Center for Education Statistics, “National Indian Education Study 2015,” March 2017, https://nces.ed.gov/nationsreportcard/subject/publications/studies/pdf/2017161.pdf.
[69] Government Accountability Office, “High Risk List: 2020 Decennial Census,” http://www.gao.gov/highrisk/2020_decennial_census/why_did_study.
[70] Letters can be accessed at https://thecensusproject.org/letters/.
[71] American Enterprise Institute and Center on Budget and Policy Priorities, “Letter to Chairman Thad Cochran, Chairman Richard Shelby, and Ranking Member Barbara Mikulski,” June 9, 2015, https://www.cbpp.org/sites/default/files/atoms/files/6-10-15_censusletter.pdf.
More from the Authors