Geographic Pattern of Disability Receipt Largely Reflects Economic and Demographic Factors
Disability Benefits Especially Important in South and Appalachia
About 6 percent of the nation’s working-age population receives disability payments from Social Security Disability Insurance (DI) or Supplemental Security Income (SSI), and people who depend on those benefits live in every state, county, and congressional district. Nevertheless, there’s a distinct “geography of disability.” Some states, chiefly in the South and Appalachia, have much higher rates of receipt — nearly twice the national average.[2] In contrast, states along the Washington-to-Boston corridor (where many policymakers and opinion leaders live), on the West Coast, and in the Great Plains and Mountain West have relatively few disability beneficiaries.
While some critics see this disparity as evidence of problems with the programs, it mostly reflects a few key demographic and economic factors. In a nutshell, states with high rates of disability receipt tend to have populations that are less educated, older, and more blue-collar than other states; they also have fewer immigrants. (See Table 1 for state-by-state data.) In fact, those four factors alone are associated with about 85 percent of the variation in disability receipt rates across states.[3] Furthermore, those factors are directly or indirectly related to the programs’ eligibility criteria.
Less-Educated Workforce, Other Factors Affect Disability Receipt
Applicants for Social Security disability benefits must have a severe and long-lasting medical impairment that prevents them from doing substantial work, as documented by clinical findings from acceptable medical sources. Many common measures of health status — such as obesity, smoking, diabetes, cardiovascular disease, and life expectancy — vary by state.[4] Work disability, however, is a matter not just of health but also of job requirements and individual skills. The Social Security Act explicitly provides that a person’s age, education, and work experience are to be considered in determining whether that person has a disability — because they affect whether a person with a condition is able to perform actual jobs — and the Social Security Administration has established detailed criteria for doing so. (See box.)
Defining and Determining Disability
The Social Security Act defines disability as “[the] inability to engage in any substantial gainful activity by reason of any medically determinable physical or mental impairment which can be expected to result in death or which has lasted or can be expected to last for a continuous period of not less than 12 months.” It further requires:
An individual shall be determined to be under a disability only if his physical or mental impairment or impairments are of such severity that he is not only unable to do his previous work but cannot, considering his age, education, and work experience, engage in any other kind of substantial gainful work which exists in the national economy, regardless of whether such work exists in the immediate area in which he lives, or whether a specific job vacancy exists for him, or whether he would be hired if he applied for work [emphasis added].a
Thus, the law expects workers to support themselves by switching to other work — including in another field or at lower pay — if they are able. The Social Security Administration (SSA) implements this guidance through regulations, which aim to assure that disability examiners and judges all use the same criteria in making decisions.
SSA first weighs whether the applicant’s impairment is so severe that it meets a list of extremely disabling conditions, such as the loss of two or more limbs, vision of less than 20/200 even with correction, or a diagnosis of Amyotrophic Lateral Sclerosis (commonly known as Lou Gehrig’s disease).b Older applicants whose ill health doesn’t quite meet those strict criteria may qualify for evaluation according to a medical/vocational “grid” establishing three age brackets (50-54, 55-59, and 60-65) at which SSA applies slightly less exacting standards about the jobs for which applicants are expected to retrain.c The grid chiefly benefits high-school dropouts and, in some cases, high-school graduates who remain capable of limited work but lack transferable skills.
As expected, researchers find small jumps in the number of people qualifying for DI at the grid’s age thresholds of 50, 55, and 60 — the three points at which SSA modestly eases its expectations of applicants’ ability to retrain for other jobs.d
a Social Security Act, section 223 (Disability Insurance); similar language appears in section 1614 (Supplemental Security Income).
b Appendix 1 to Subpart P of Part 404, Code of Federal Regulations.
c Appendix 2 to Subpart P of Part 404, Code of Federal Regulations. The agency offers a plain-English explanation to applicants at http://www.socialsecurity.gov/disability/step4and5.htm#a1=2.
d See Joyce Manchester and Jae Song, “What Can We Learn from Analyzing Historical Data on Social Security Entitlements?,” Social Security Bulletin, vol. 71 no. 4, 2011, http://www.ssa.gov/policy/docs/ssb/v71n4/v71n4p1.html.
Four economic and demographic factors that strongly influence a geographic area’s rate of disability receipt are:
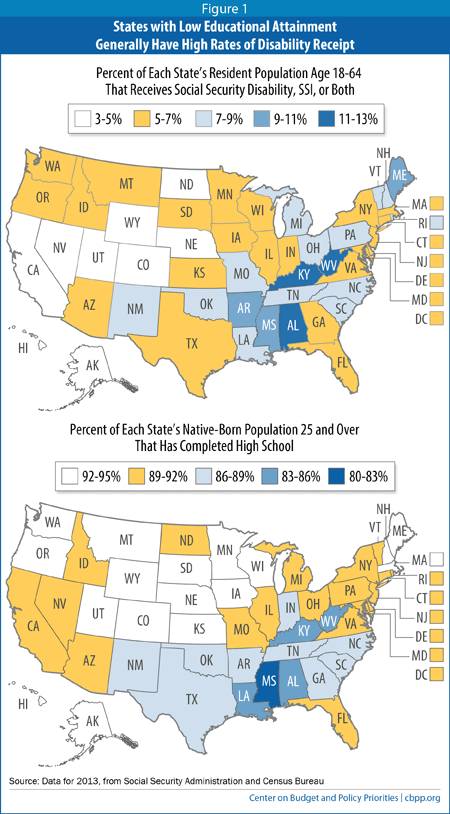
- A less-educated workforce. This is by far the most powerful factor; states with low rates of high-school completion generally have high rates of disability receipt (see Figure 1). That makes sense because the law requires applicants for disability benefits to show not just that they can’t do their past work anymore, but that they can’t realistically switch to other, less demanding work. That adjustment is harder, or even impossible, for severely impaired people with little education. A surgeon who suffers a stroke might become a pathologist or an insurance consultant, but that’s hardly feasible for a 60-year-old waitress without a high-school diploma who has also suffered a stroke. People without a college degree — and especially those who didn’t finish high school — are far more likely to collect DI.[5] As a result, rates of disability receipt are higher in states with high-school completion rates below the U.S. average, chiefly in the South and Appalachia.
- An older workforce. The risk of disability rises sharply with age; the older people become, the more likely they are to develop a disabling condition. A worker is twice as likely to collect DI at age 40 as at age 30, twice as likely at 50 as at 40, and twice as likely at 60 as at 50.
The typical DI beneficiary is in late middle age: 70 percent are over 50, and 30 percent are 60 or older.[6] New England and Appalachia have higher median ages than most of the rest of the country, which boosts their rates of disability receipt compared with the “young” West. - Fewer immigrants. Immigrants, especially recent arrivals, are far less likely than native-born citizens to collect disability benefits.[7] That’s largely a consequence of program rules. DI generally requires applicants to have worked in the United States for at least one-fourth of their adult lives and five of the last ten years, a high bar for recent immigrants. In addition, since 1996, SSI has banned benefits to new immigrants (except for refugees in their first seven years) unless they become naturalized citizens or work for at least ten years in the United States. There’s also some evidence that immigrants are healthier than their U.S.-born counterparts, although that advantage deteriorates with age.[8]
These facts help explain why states with large foreign-born populations — notably California, New York, New Jersey, Florida, Nevada, and Texas — have fewer disability recipients than one would expect based solely on their age and educational characteristics. - Industry-based economy. States where much of the workforce is employed in forestry, certain types of mining, utilities, construction, and manufacturing — such as the industrial Midwest and many southern and Appalachian states —tend to have more disability recipients than states with more service-oriented economies, all else being equal. Such jobs are often physically demanding and involve skills that don’t transfer readily to other, less arduous types of work — factors that the programs’ eligibility rules for older applicants take into account.Imagen
Certain other factors have weaker effects. A state’s poverty rate helps to explain its participation rate in SSI (which is means-tested) but has less bearing on its participation rate in DI (which isn’t). Unemployment rates explain hardly any of the geographic variation. Although higher unemployment boosts disability applications, researchers conclude that those extra applicants are also more likely to be denied. The programs’ eligibility rules are strict and don’t become more lax in periods or areas of high unemployment.[9]
Other, Hard-to-Measure Factors Also Matter
The factors we’ve examined don’t explain all of the variation in disability receipt by state. First, we’ve focused on broad, readily obtainable variables. It’s easy, for example, to find the percentage of each state’s population that’s foreign-born, but more arduous to divide that between refugees and other immigrants or between recent arrivals and long-time residents — factors relevant to disability receipt.
Second, unexamined factors surely help to explain some variation in receipt rates. Public awareness of DI and SSI may differ by state, as may the availability of legal assistance to help file a well-documented application. States’ past (not just current) industrial mix probably matters; disability rates are higher in the “old” mining states of Appalachia than in the booming, “new” mining states of the Plains and Mountain West. Some researchers find that the availability of affordable health insurance — without exclusions for pre-existing conditions — in certain states is associated with fewer disability applications.[10] If so, implementation of the Affordable Care Act may dampen future cost pressures on DI.
Also, we don’t examine variation within states. One scholar recently noted, for example, that in 2011 Virginia simultaneously had five of the nation’s ten counties with the highest rates of DI receipt and four of the ten counties with the lowest rates (in the suburbs surrounding Washington, D.C.).[11] And Alabama’s Hale County has even higher rates of disability receipt than the rest of the state due to factors such as workforce age and education level, as a CBPP analysis showed.[12]
Examining the geographic pattern of disability receipt gives a valuable perspective on how these programs — even with their strict eligibility rules and modest benefits — protect some of the nation’s most vulnerable people. Policymakers should bear these facts in mind as they deal with the need to shore up the DI program’s finances by 2016.[13]
|
Table 1
Rates of Disability Receipt, by State, and Related Factors
|
||||||||
|
|
Social Security Disability Receipt Ratea
|
Social Security and SSI Disability Receipt Rateb
|
High-School Completion Rate, Native-Bornc
|
Median Aged
|
Foreign-born Share of Populatione
|
State Industry Mix (Percent “Blue-Collar”)f
|
Poverty Rateg
|
Unemployment Rateh
|
| United States |
4.8
|
6.4
|
90.0
|
37.6
|
13.0
|
13.5
|
15.8
|
7.4
|
|
|
|
|
|
|
|
|
|
|
| Alabama |
8.5
|
11.0
|
85.2
|
38.4
|
3.4
|
17.1
|
18.7
|
6.5
|
| Alaska |
2.8
|
4.1
|
92.8
|
33.2
|
6.9
|
15.9
|
9.3
|
6.5
|
| Arizona |
4.1
|
5.3
|
91.1
|
36.8
|
13.6
|
11.3
|
18.6
|
8.0
|
| Arkansas |
8.4
|
10.7
|
86.0
|
37.7
|
4.3
|
17.9
|
19.7
|
7.5
|
| California |
3.2
|
4.9
|
91.7
|
35.8
|
27.0
|
12.5
|
16.8
|
8.9
|
| Colorado |
3.3
|
4.2
|
93.7
|
36.4
|
9.9
|
12.3
|
13.0
|
6.8
|
| Connecticut |
4.0
|
5.1
|
91.9
|
40.5
|
13.5
|
12.9
|
10.7
|
7.8
|
| Delaware |
5.1
|
6.2
|
89.7
|
39.5
|
8.7
|
10.7
|
12.4
|
6.7
|
| District of Columbia |
3.4
|
6.6
|
91.2
|
33.8
|
14.3
|
2.4
|
18.9
|
8.3
|
| Florida |
4.9
|
6.4
|
89.9
|
41.5
|
19.5
|
9.2
|
17.0
|
7.2
|
| Georgia |
4.8
|
6.5
|
87.7
|
35.9
|
9.5
|
12.6
|
19.0
|
8.2
|
| Hawaii |
2.9
|
4.1
|
94.6
|
38.0
|
17.9
|
7.5
|
10.8
|
4.8
|
| Idaho |
4.8
|
6.1
|
91.8
|
35.5
|
5.9
|
14.9
|
15.6
|
6.2
|
| Illinois |
4.0
|
5.5
|
91.5
|
37.2
|
13.8
|
12.9
|
14.7
|
9.2
|
| Indiana |
5.5
|
6.9
|
88.5
|
37.4
|
4.6
|
19.7
|
15.9
|
7.5
|
| Iowa |
4.6
|
5.6
|
92.9
|
38.1
|
4.3
|
17.3
|
12.7
|
4.6
|
| Kansas |
4.7
|
5.7
|
92.7
|
36.0
|
6.5
|
16.5
|
14.0
|
5.4
|
| Kentucky |
8.2
|
11.4
|
84.5
|
38.5
|
3.1
|
16.4
|
18.8
|
8.3
|
| Louisiana |
6.1
|
8.8
|
83.6
|
36.1
|
3.6
|
16.6
|
19.8
|
6.2
|
| Maine |
7.7
|
9.6
|
92.4
|
43.9
|
3.3
|
15.3
|
14.0
|
6.7
|
| Maryland |
3.7
|
5.1
|
91.3
|
38.2
|
14.1
|
9.8
|
10.1
|
6.6
|
| Massachusetts |
5.1
|
7.0
|
92.8
|
39.4
|
15.1
|
11.4
|
11.9
|
7.1
|
| Michigan |
6.3
|
8.3
|
90.4
|
39.5
|
6.1
|
16.0
|
17.0
|
8.8
|
| Minnesota |
4.1
|
5.2
|
94.1
|
37.7
|
7.5
|
14.5
|
11.2
|
5.1
|
| Mississippi |
7.9
|
10.7
|
82.7
|
36.5
|
1.9
|
17.2
|
24.0
|
8.6
|
| Missouri |
6.4
|
8.0
|
89.3
|
38.2
|
3.8
|
13.2
|
15.9
|
6.5
|
| Montana |
4.8
|
6.0
|
92.8
|
39.9
|
1.8
|
13.4
|
16.5
|
5.6
|
| Nebraska |
4.0
|
5.0
|
93.6
|
36.2
|
6.6
|
14.3
|
13.2
|
3.9
|
| Nevada |
3.7
|
4.8
|
90.8
|
37.2
|
19.0
|
8.9
|
15.8
|
9.8
|
| New Hampshire |
6.0
|
7.1
|
93.6
|
42.3
|
5.5
|
15.1
|
8.7
|
5.3
|
| New Jersey |
3.9
|
5.1
|
91.9
|
39.4
|
21.2
|
9.8
|
11.4
|
8.2
|
| New Mexico |
5.4
|
7.4
|
88.7
|
36.9
|
9.3
|
12.6
|
21.9
|
6.9
|
| New York |
4.5
|
6.5
|
90.6
|
38.2
|
22.7
|
8.9
|
16.0
|
7.7
|
| North Carolina |
5.7
|
7.3
|
87.8
|
38.1
|
7.7
|
14.7
|
17.9
|
8.0
|
| North Dakota |
3.4
|
4.1
|
91.9
|
35.3
|
2.8
|
17.8
|
11.8
|
2.9
|
| Ohio |
5.4
|
7.5
|
89.5
|
39.3
|
3.8
|
15.9
|
16.0
|
7.4
|
| Oklahoma |
5.8
|
7.6
|
88.8
|
36.2
|
5.6
|
17.9
|
16.8
|
5.4
|
| Oregon |
4.7
|
6.2
|
92.9
|
39.0
|
9.5
|
14.7
|
16.7
|
7.7
|
| Pennsylvania |
5.6
|
7.7
|
90.1
|
40.7
|
6.0
|
14.3
|
13.7
|
7.4
|
| Rhode Island |
6.0
|
8.0
|
89.8
|
39.9
|
13.5
|
12.2
|
14.3
|
9.5
|
| South Carolina |
6.5
|
8.1
|
86.7
|
38.6
|
4.7
|
15.5
|
18.6
|
7.6
|
| South Dakota |
4.1
|
5.2
|
92.1
|
36.8
|
2.7
|
14.7
|
14.2
|
3.8
|
| Tennessee |
6.7
|
8.7
|
86.6
|
38.5
|
4.4
|
14.8
|
17.8
|
8.2
|
| Texas |
3.8
|
5.2
|
88.8
|
34.0
|
16.2
|
15.9
|
17.5
|
6.3
|
| Utah |
3.0
|
3.8
|
94.4
|
30.2
|
8.3
|
14.2
|
12.7
|
4.4
|
| Vermont |
6.1
|
7.6
|
91.8
|
42.4
|
4.2
|
16.5
|
12.3
|
4.4
|
| Virginia |
4.3
|
5.5
|
89.6
|
37.6
|
11.6
|
11.1
|
11.7
|
5.5
|
| Washington |
4.3
|
5.8
|
93.4
|
37.5
|
13.2
|
13.9
|
14.1
|
7.0
|
| West Virginia |
8.9
|
12.5
|
84.6
|
41.9
|
1.4
|
16.6
|
18.5
|
6.5
|
| Wisconsin |
4.9
|
6.2
|
92.1
|
39.0
|
4.6
|
18.7
|
13.5
|
6.7
|
| Wyoming |
3.8
|
4.6
|
94.0
|
36.8
|
3.2
|
20.0
|
10.9
|
4.6
|
| a Social Security disability recipients as a percent of population age 18-64, 2013. Includes disabled workers, disabled widow(er)s, and disabled adult children; the last two categories are relatively small. Data from Table 8, Annual Statistical Report on the Social Security Disability Insurance Program, 2013, Social Security Administration, December 2014, http://www.ssa.gov/policy/docs/statcomps/di_asr/index.html. b Social Security disability and Supplemental Security Income (SSI) recipients as a percent of population age 18-64, 2013. Data from Table 67 of the Annual Statistical Report, op. cit. c High-school graduation rates for U.S.-born adults age 25 or older. Calculated from 2013 American Community Survey, Table B06009 (Place of Birth by Educational Attainment in the United States), available from “American Fact Finder” at http://www.census.gov/acs/www/data_documentation/2013_release/. d State median age as of July 1, 2013, from “American Fact Finder” at http://factfinder2.census.gov/faces/nav/jsf/pages/community_facts.xhtml. e Anna Brown and Eileen Patten, Statistical Portrait of the Foreign-Born Population in the United States, 2012, Pew Research Center, April 29, 2014, http://www.pewhispanic.org/2014/04/29/statistical-portrait-of-the-foreign-born-population-in-the-united-states-2012/. f Percentage of state employment in forestry, fishing, and related activities, mining, utilities, construction, and manufacturing, 2012. Calculated from regional data available from Department of Commerce, Bureau of Economic Analysis, at http://www.bea.gov/iTable/index_regional.cfm. g Alemayehu Bishaw and Kayla Fontenot, “Poverty: 2012 and 2013,” Department of Commerce, American Community Survey brief 13-01, September 2014, http://www.census.gov/content/dam/Census/library/publications/2014/acs/acsbr13-01.pdf. h “Regional and State Unemployment — 2013 Annual Averages,” Department of Labor, Bureau of Labor Statistics, February 28, 2014, http://www.bls.gov/news.release/pdf/srgune.pdf. |
||||||||
End Notes
[1] Bryann Da Silva provided invaluable research assistance.
[2] This analysis focuses on the rate of disability receipt by state — that is, the percentage of each state’s working-age population (age 18-64) that receives DI, SSI, or both. A map depicting the number of disability recipients would look different. Not surprisingly, they’re concentrated in the most populous states, led by California, Texas, New York, Florida, and Pennsylvania. All of those states except Pennsylvania have average or below-average rates of receipt.
Information about the number of disability recipients by state, county, zip code, and congressional district is available at “Geographic Statistics Fact Sheets,” Social Security Administration, http://www.ssa.gov/news/press/statefctshts.html.
[3] For further discussion of the statistical analysis that underpins this result, see the separate technical appendix at https://www.cbpp.org/cms/index.cfm?fa=view&id=5255.
[4] For more information about the geographic patterns of many health indicators, see the Data Hub maintained by the Robert Wood Johnson Foundation at http://www.rwjf.org/en/research-publications/research-features/rwjf-datahub.html.
[5] Melissa M. Favreault, Richard W. Johnson, and Karen E. Smith, “How Important Is Social Security Disability Insurance to U.S. Workers?,” Urban Institute, June 21, 2013, http://www.urban.org/UploadedPDF/412847-how-important-is-social-security.pdf; Michelle Stegman Bailey and Jeffrey Hemmeter, “Characteristics of Noninstitutionalized DI and SSI Program Participants: 2010 Update,” Social Security Bulletin, February 2014, http://www.ssa.gov/policy/docs/rsnotes/rsn2014-02.html.
[6] See Chart Book: Social Security Disability Insurance, Center on Budget and Policy Priorities (CBPP), August 4, 2014, https://www.cbpp.org/cms/index.cfm?fa=view&id=4169. SSI (unlike DI) does not require a work history and serves relatively more young beneficiaries with early-onset mental impairments and intellectual disabilities, but rates of SSI receipt, too, rise with age. See “Policy Basics: Introduction to Supplemental Security Income,” CBPP, February 27, 2014, https://www.cbpp.org/cms/index.cfm?fa=view&id=3370.
[7]Favreault et al., op. cit.
[8] Kathryn Pitkin Derose, José J. Escarce, and Nicole Lurie, “Immigrants And Health Care: Sources Of Vulnerability,” Health Affairs, vol. 26 no. 5, September 2007, http://content.healthaffairs.org/content/26/5/1258.full; The Health of Immigrants in New York City, New York City Department of Health and Mental Hygiene, June 2006, http://www.nyc.gov/html/doh/downloads/pdf/episrv/episrv-immigrant-report.pdf.
[9] Chart Book, CBPP, op. cit.; Stephen C. Goss et al., “Disabled Worker Allowance Rates: Variation Under Changing Economic Conditions,” Social Security Administration, Actuarial Note 153, August 2013, http://www.ssa.gov/OACT/NOTES/pdf_notes/note153.pdf; Kalman Rupp, “Factors Affecting Initial Disability Allowance Rates for the Disability Insurance and Supplemental Security Income Programs: The Role of the Demographic and Diagnostic Composition of Applicants and Local Labor Market Conditions,” Social Security Bulletin, vol. 72 no. 4, 2012, http://www.ssa.gov/policy/docs/ssb/v72n4/v72n4p11.html.
[10] Nicole Maestas, Kathleen J. Mullen, and Alexander Strand, “Disability Insurance and Healthcare Reform: Evidence from Massachusetts,” Michigan Retirement Research Center, Working Paper 2013-289, November 2013, http://www.mrrc.isr.umich.edu/publications/papers/pdf/wp289.pdf; Norma B. Coe et al., “What Explains State Variation in SSDI Application Rates?,” Center for Retirement Research at Boston College, Working Paper 2011-23, December 2011, http://crr.bc.edu/working-papers/what-explains-state-variation-in-ssdi-application-rates/.
[11] Stephan Lindner, “Why are disability benefit rates so different across small areas?,” Urban Institute Metro Trends blog, April 4, 2014, http://blog.metrotrends.org/2014/04/disability-benefit-rates-small-areas/.
[12] Kathy Ruffing, “Not So Hale and Hearty: Explaining Disability Rates in One Alabama County,” Off the Charts blog, April 15, 2013, http://www.offthechartsblog.org/not-so-hale-and-hearty-explaining-disability-rates-in-one-alabama-county/; Trudy Lieberman, “‘This American Life’ piece provides an unfortunate example of incomplete reporting,” Columbia Journalism Review, May 21, 2013, http://www.cjr.org/united_states_project/disability_social_security_and.php?page=all.
[13] Kathy Ruffing and Paul N. Van de Water, Congress Needs to Boost Disability Insurance Share of Payroll Tax by 2016, CBPP, July 31, 2014, https://www.cbpp.org/cms/index.cfm?fa=view&id=4168.
Más de los autores