

Administrative Burden and Procedural Denials in the Supplemental Nutrition Assistance Program
The Supplemental Nutrition Assistance Program (SNAP) is a vital resource for millions of households in the U.S. SNAP is designed to alleviate hunger, improve food security, and provide essential support to low-income households in meeting basic needs. However, the program's effectiveness is hampered by complex administrative processes that create significant barriers for potential participants. These so-called “administrative burdens” take various forms, including learning costs, compliance costs, and psychological costs. Collectively, they deter many eligible families from accessing the benefits they need. While some policymakers have raised concerns about fraud in SNAP, the rates of fraud are very low. Of more concern is that people who are eligible for SNAP are not receiving benefits.[2]
Research has shown that administrative burdens can lead to procedural denials, where applicants are rejected not due to ineligibility, but because they are unable to navigate the complex application and eligibility recertification processes. A large percentage of applicants are unable to complete the necessary steps to secure benefits, resulting in missed assistance and increased risk of food insecurity.[3]
Our analysis examines the prevalence of denials among two groups: new SNAP applicants and current participants undergoing recertification. We also study how denials vary by demographic groups among those who need to recertify. The analysis is based on SNAP administrative data from a state in the mountain-plains region in the 2011-2022 period.
We have the following key findings:
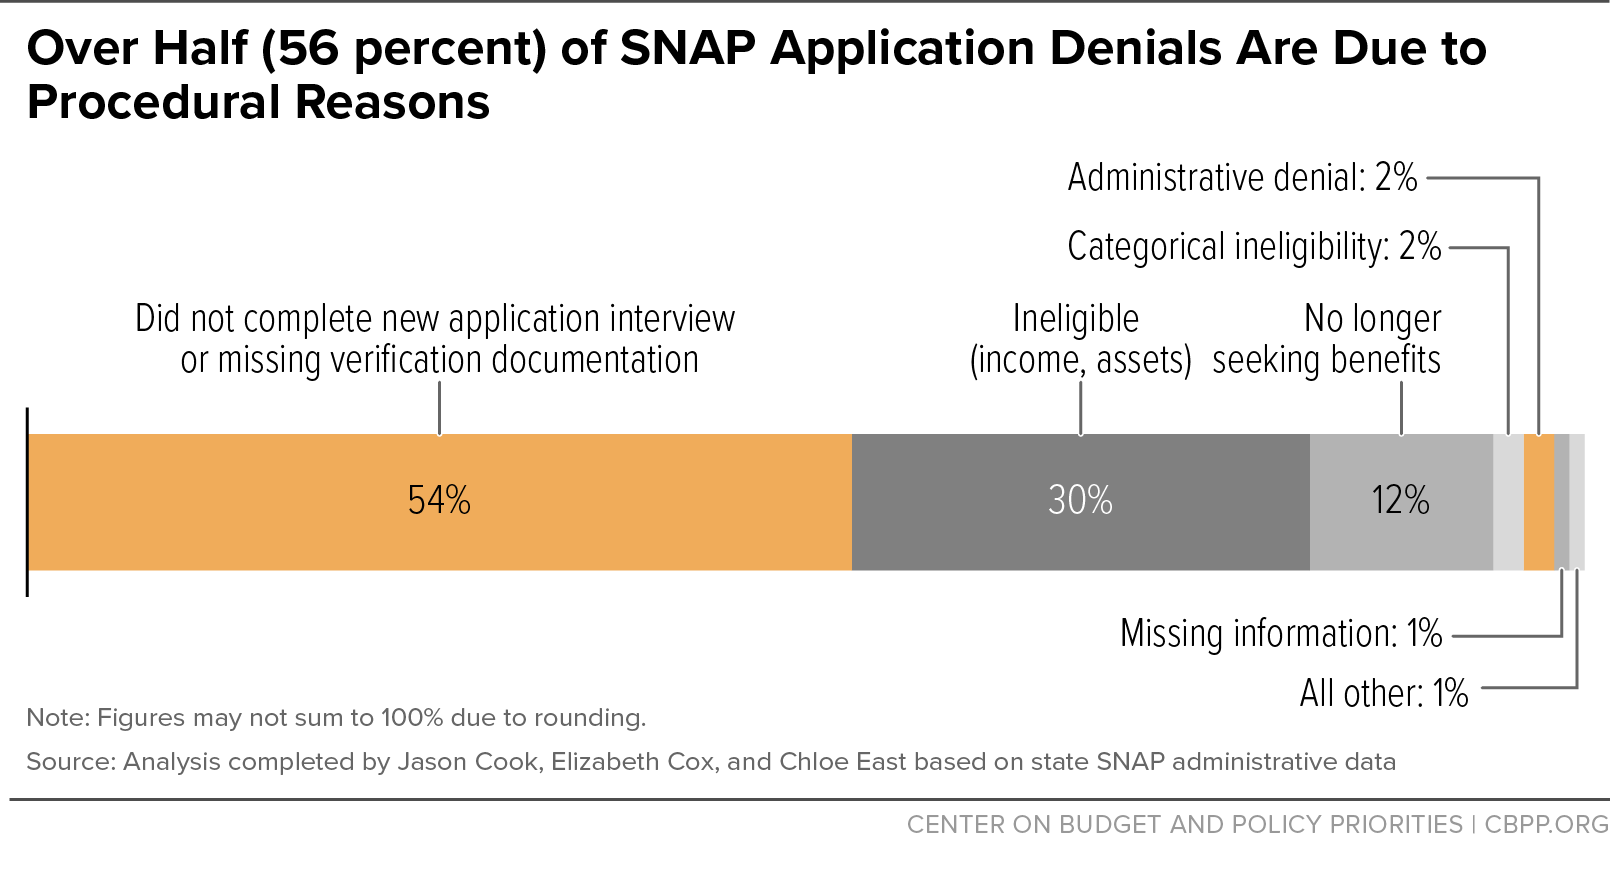
- Nearly two-thirds (63 percent) of new SNAP applicants are denied benefits. More than half (56 percent) of those denials are for procedural reasons.
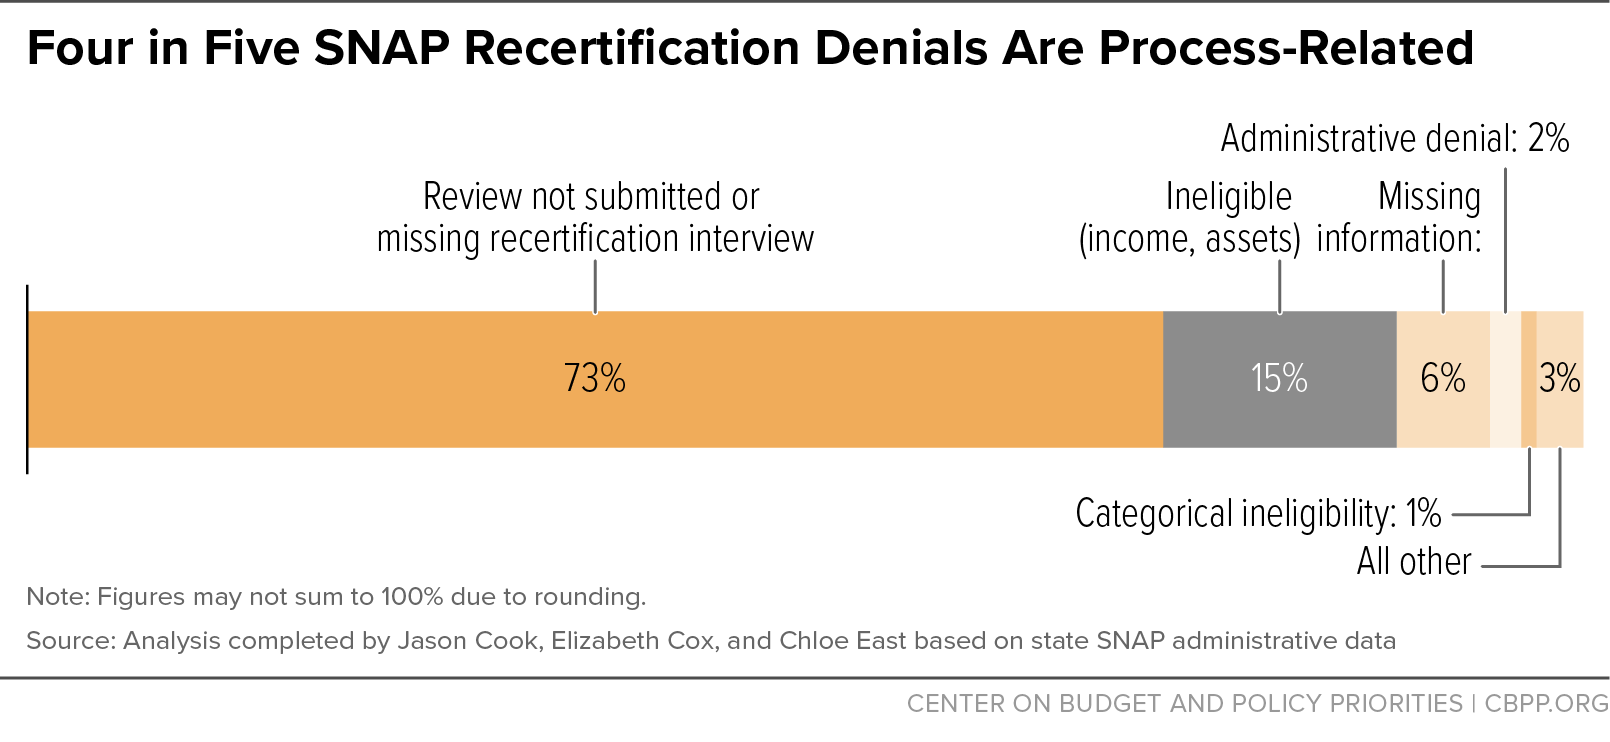
- Two in five (40 percent) SNAP participants are denied continued benefits at eligibility recertification. The majority (81 percent) of those denials are for procedural reasons.
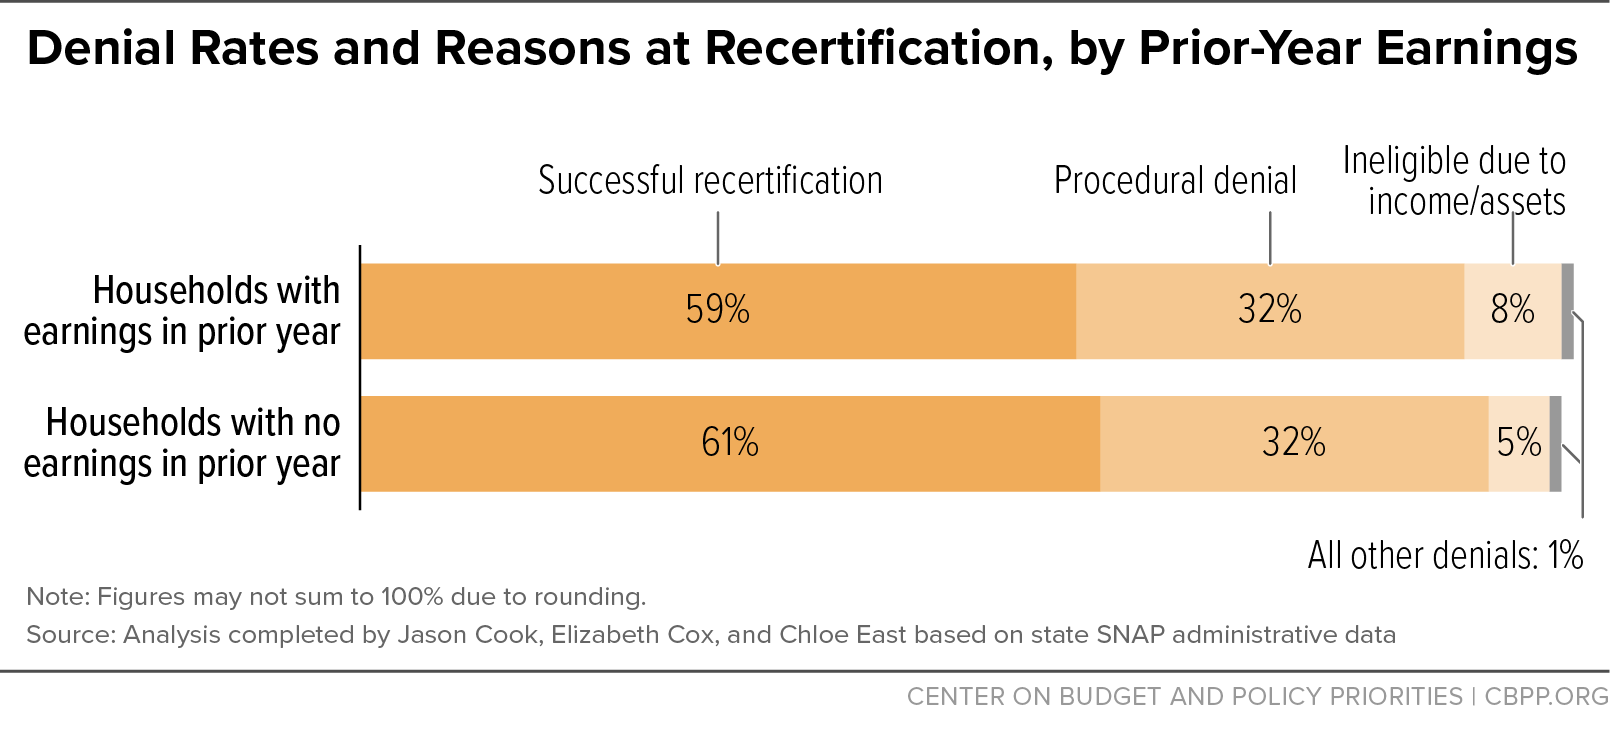
- The median SNAP participant has no earnings in the year prior to recertification, meaning that a clear majority of this group continues to be eligible for SNAP. However, 39 percent of SNAP participants with no earnings are denied at recertification. The majority (82 percent) of those denials are for procedural reasons.
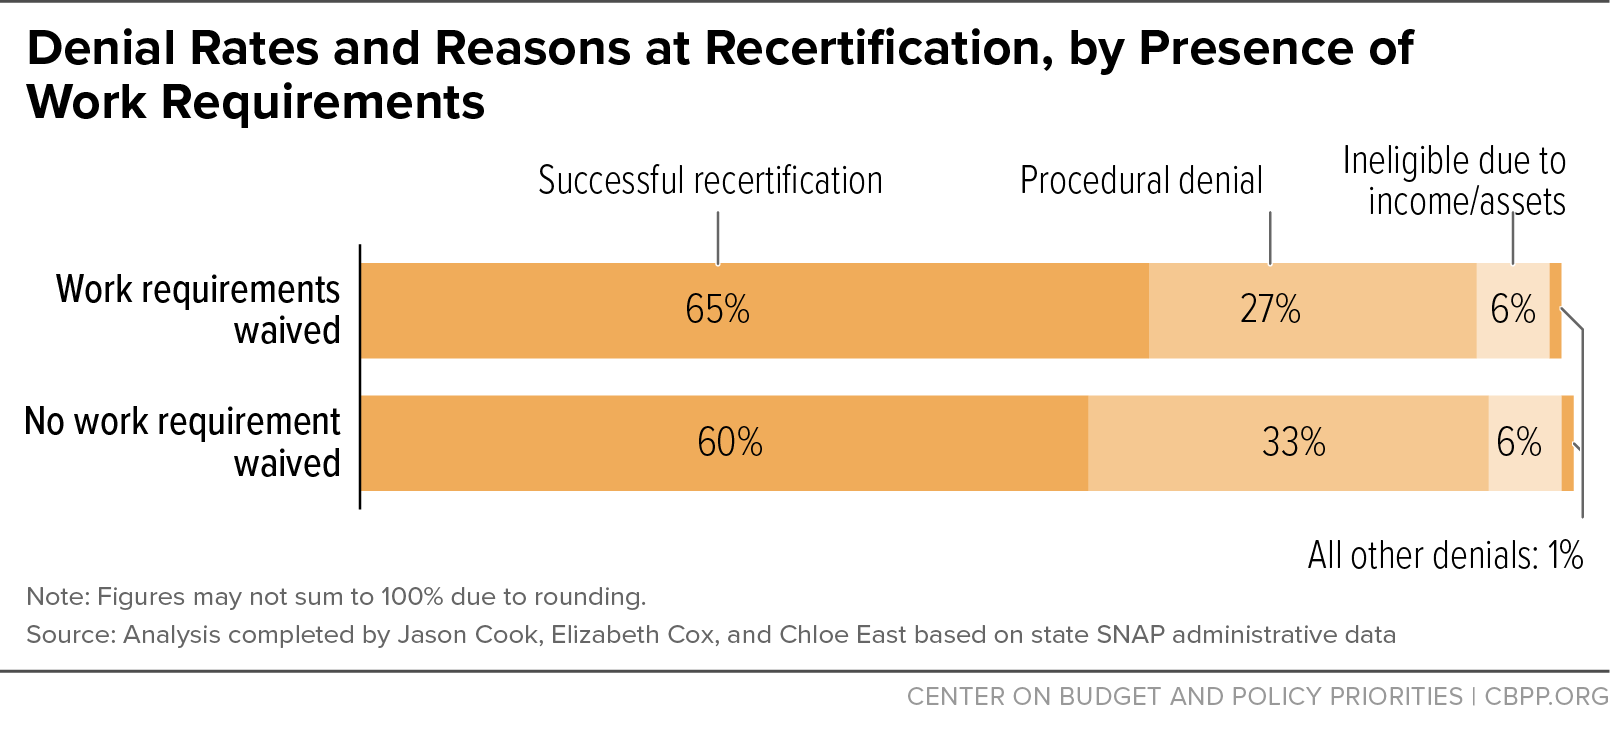
- Work requirements make applying for SNAP and regularly proving eligibility more burdensome because they necessitate additional paperwork to demonstrate compliance with the requirements. When work requirements are waived, denial rates go down by 5 percentage points, entirely due to a reduction in procedural denials.
The harmful 2025 Republican reconciliation law will further increase administrative burdens for people in need of food assistance. The law expands work requirements to millions more people and puts pressure on states to restrict access and increase procedural hurdles to lower their payment error rates. States will need to adopt thoughtful approaches to improve payment accuracy without jeopardizing access for families and individuals who need SNAP to put food on the table.
Despite the many challenges presented by the reconciliation law, policymakers can still reduce administrative burdens and preserve access to SNAP among those who are eligible for the program, through such measures as:
- simplifying the application and recertification processes;
- streamlining interview processes;
- providing more flexibility in arranging interviews with caseworkers;
- maximizing the use of data sources to verify income;
- improving applications, forms, and notices;
- reducing the frequency of recertifications; and
- enhancing outreach and assistance.
What Is SNAP?
SNAP is a means-tested transfer program that provides food benefits to qualifying households. To be eligible for SNAP, a household must have gross income below 130 percent of the federal poverty line (in some states gross income can be up to 200 percent of the federal poverty line). Further details about SNAP eligibility and benefits can be found in the Center on Budget and Policy Priorities’ SNAP “Quick Guide.”[4]
SNAP provides necessary resources to households that are facing financial hardship due to layoffs and other cuts to their income or increases in their expenses.[5] SNAP benefits help households weather these financial challenges and lead to improvements in their food security, health outcomes, and educational outcomes of children.[6]
How Do Eligible Households Access SNAP?
An estimated 88 percent of eligible households participated in SNAP in fiscal year 2022.[7] Participation rates vary widely by household type, with a very high share of children participating, compared to just over half of eligible elderly individuals.[8] Participation rates increased between fiscal years 2019 and 2022, which coincided with a pandemic-induced lessening of hurdles to access SNAP, such as waiving interview requirements, reducing paperwork requirements, and extending the eligibility certification period.[9] However, participation rates will likely decline due to the 2025 reconciliation law, given that a number of states have started trying to reduce their payment errors by ramping up burdensome paperwork requirements.[10]
In SNAP, as in many means-tested transfer programs in the U.S., the burden of proving eligibility is placed on the potential participants. They must learn about the program and whether they might be eligible, and then go through the application process, which includes an interview with a caseworker to prove their eligibility. Applications can be completed online or in person. Some parts of the process, including the interview, can be done over the phone. In addition to filling out long application forms, individuals must prove the information on the form is accurate by providing supporting documentation such as pay stubs, utility bills, and child care bills. Code for America and the U.S. Department of Agriculture (USDA) have produced best practices guidelines for how to design state SNAP applications and notices to maximize readability and comprehension.[11]
A USDA-commissioned survey of SNAP applicants in 2000 confirms the complexity and cost of the application process, though administrative changes since that time, such as online applications and phone interviews, have streamlined it somewhat.[12] Applicants spent an average of 3.9 hours in SNAP (then called the Food Stamp Program) offices completing the application process. They took an average of 2.4 trips to the office as well as 1.2 trips to additional locations to acquire necessary documentation. Thirty-nine percent of working households said they had to miss work to complete the application. This study also found that applicants were more likely to complete their application if they were at a SNAP office with a supervisor who is supportive of program participation.
Once people receive SNAP, they must regularly prove they remain eligible to continue to receive benefits. States have some flexibility in how long to certify SNAP households; most households that receive SNAP must recertify every six or 12 months. Households in which all adults are age 60 or older or have disabilities can have longer certification periods. Recertification involves updating a participant’s application paperwork, providing any necessary documentation, and often completing an interview with a caseworker.
While SNAP is a federal program, states have flexibility in determining the exact application and recertification processes, as well as in determining how accessible program information is. States — and in some cases, localities — can decide:
- how much to spend on outreach;
- how many offices to have and where to locate them;
- what days and hours the offices will be open, including any hours outside of standard business hours;
- whether to design applications and forms that use plain language and are accessible; and
- whether interviews with caseworkers are only pre-scheduled or flexible in timing.
Given the variation in SNAP administrative policy across states, it is perhaps unsurprising that there is large variation across states in the share of eligible households that receive SNAP. For example, less than 65 percent of eligible people in Arkansas and Wyoming were estimated to receive SNAP in fiscal year 2022, compared to a significantly higher share (estimates approaching 100 percent) of eligible people in several states, including Illinois, Massachusetts, New Mexico, Oregon, Pennsylvania, and Wisconsin.[13]
What Is Administrative Burden?
Administrative burden encompasses the costs imposed on applicants and participants associated with applying for, recertifying, and participating in government benefit programs. It should be considered when designing policy. Recent work in political science and other disciplines has turned attention to the role of administrative burden in determining program access. Donald Moynihan, Pamela Herd, and Hope Harvey have divided administrative burden into three categories, listed below along with examples of each from SNAP.[14]
- Learning costs, which arise because individuals must collect information about public programs and assess the information relevant to them.
- Potential participants must learn that SNAP exists, how to apply, and whether they are likely to be eligible.
- Current participants must learn about the recertification process, when they must recertify eligibility, and how to do so.
- Compliance costs, which encompass all the steps people must take to comply with administrative rules and requirements.
- Individuals who decide to apply for SNAP must complete complicated application forms and provide supporting documentation for the information they include on the forms.
- Applicants must find a time to complete the mandatory interview with a caseworker.
- Those who are currently receiving SNAP must do all this again at regular intervals to remain eligible.
- Those subject to additional work requirements under SNAP must ensure they are meeting the requirements and provide supporting documentation to caseworkers.[15]
- Psychological costs, which can include the stigma of applying for or participating in a program with negative perceptions, a feeling of a loss of autonomy when dealing with these programs, and the stress of navigating administrative processes.[16]
- Applicants and participants report that SNAP caseworkers can be patronizing and stigmatizing during interviews.
- Many states have delays in their SNAP payments. Nationally, in 2023, nearly 1 in 5 (18 percent) of applications were not approved in a timely manner, defined as 30 days for normal applications and 7 days for expedited applications.[17] Going without food assistance can add to household stress.
Administrative burden can help to explain why participation in SNAP and other means-tested transfer programs is never 100 percent. Individuals must be willing and able to overcome all these hurdles to receive the benefits.
These hurdles may be harder to surmount for some people than for others. For example, many forms and policy documents are complex and hard to decipher, so people with the lowest literacy levels may have particular difficulty understanding them. Similarly, even as program administration continues to move online, many people still lack internet access or do not know how to navigate online interfaces. Additionally, older adults with cognitive challenges may have trouble accessing the program. This may be one reason why the SNAP participation rate among elderly households is much lower than that of working-age households.[18]
Literature Review
A growing body of research shows that increasing or reducing administrative burden in SNAP can meaningfully affect program participation.
One set of papers tackles the learning costs in SNAP by providing information about SNAP to people who are likely eligible but not currently participating.[19] This research uses high-quality experimental methods to isolate the causal effect of informational interventions on SNAP participation.
These studies find that providing people with information about SNAP and telling them they may be eligible increase applications and benefit receipt. For example, elderly Medicaid participants who received information about SNAP were almost twice as likely to enroll as those who did not receive this information. The same study also looked at providing application assistance, which can increase program participation by reducing compliance costs. If completing the application process is high-cost, then providing assistance should make a difference. Indeed, those who are given application assistance on top of information about the program are even more likely to both apply for and receive SNAP benefits.[20] Another paper found increased SNAP enrollment under broad-based categorical eligibility, a policy that allows states to raise income eligibility limits somewhat so that low-income working families can receive help affording food.[21]
Other studies look at the role of SNAP caseworkers in helping applicants overcome compliance costs. One paper, written by the authors of this CBPP piece, studied the assistance provided by SNAP caseworkers.[22] The results point to meaningful differences in how willing different caseworkers are to walk applicants through the complicated process. Being assigned a more helpful caseworker increased the likelihood an applicant completes the process and is approved to receive SNAP. Importantly, more helpful caseworkers were not more lenient in approving applications; they simply did more to help guide applicants through the process.
Another study found that when Indiana tried to automate the assistance previously provided by caseworkers, SNAP enrollment decreased by 15 percent.[23] Automating the application and recertification process can reduce the costs to states of administering SNAP. But the research highlights that automation without companion reforms to simplify the application and recertification processes is likely to reduce participation.
The mandatory interview with a caseworker is another key dimension of the application and recertification process. States vary in how they conduct these interviews. However, states are increasingly waiving the requirement for an in-person interview and offering a phone option, after evidence suggested that phone interviews helped increase SNAP participation.[24]
Several studies explore what happens when states waive the interviews or give more flexibility to applicants to complete the interviews. The first paper studied the effect of an experiment in Los Angeles County to move away from pre-scheduled phone interviews and create a call line that applicants can use at their convenience to complete the interview.[25] The findings are striking. Previously, 1 in 3 SNAP applicants were denied simply because of missing the interview rather than being ineligible; the change to flexible interviews increased SNAP participation by 13 percent.
Another experimental study examined the policy in Oregon and Utah of waiving the interview requirement altogether but still providing interviews upon request. Caseworkers could also contact clients if they had questions about the application.[26] Waiving initial interviews had little impact on overall program participation. This is likely because while some applicants were able to complete the application process more quickly, others had a harder time because they didn’t get guidance from caseworkers. This study reinforces the value of assistance from caseworkers, given the complexity of the application process.
This same study found that waiving recertification interviews reduced program churn by 3 percentage points. Churn happens when a participant falls off SNAP at recertification and re-enrolls within a few months. These people are likely eligible for SNAP the entire time, but they bear the cost of going without benefits for a few months due to the administrative burden of recertifying. Churn is also costly for program administrators since re-enrolling a case costs twice as much as recertifying.[27]
Recertifications are a common time for SNAP participants to fall off the program. While this could be because they have become ineligible, the evidence points to another important factor: the compliance costs associated with recertification. A 2024 study found that most people who stop receiving SNAP at recertification remain eligible.[28] The study shows that lengthening the amount of time between recertifications would be an effective way to increase SNAP participation, consistent with other research.[29] Similarly, other research finds that giving more flexibility and more time to complete a recertification interview increases the likelihood that people recertify and remain on the program by 22 percent.[30]
More generally, several other studies find increased participation in SNAP when compliance costs are lowered through reducing reporting requirements and introducing an online case management tool to complement existing help from caseworkers.[31]
Psychological costs like stigma may also play an important role in determining SNAP participation. Changing SNAP outreach messaging to talk about SNAP in positive terms increases people’s interest in learning more about the program by 21 percent.[32]
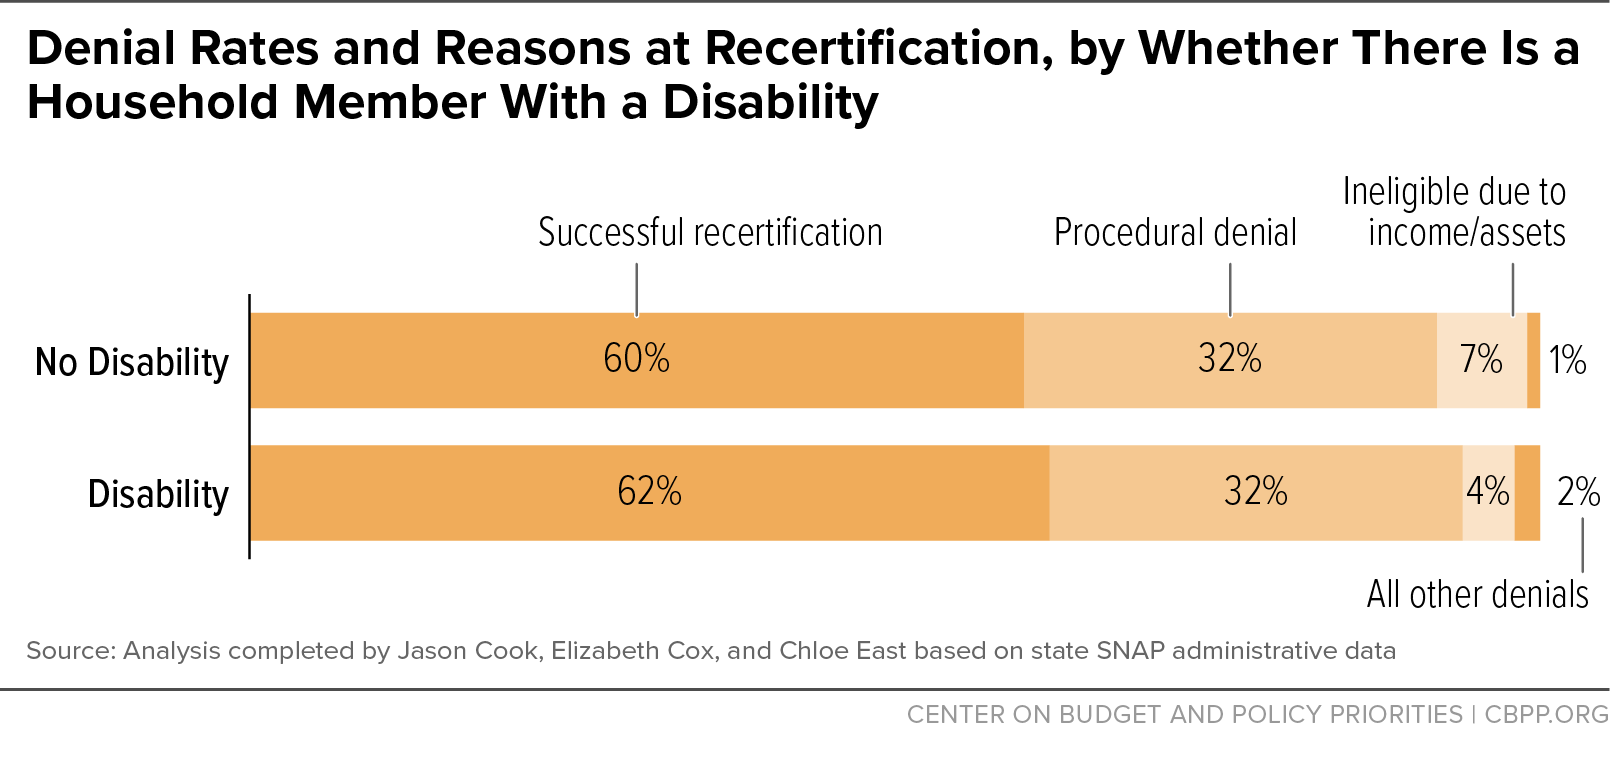
Finally, SNAP work requirements impose additional learning, compliance, and psychological costs on potential participants. Moreover, these additional costs affect many people beyond their intended targets. For example, people who reported having a disability — who likely should have been exempt from work requirements — lost SNAP at the same rate as people without a disability, one study found.[33]
Our Research Approach
One of the most salient measures of administrative burden in SNAP is whether eligible people are excluded from the program simply because it’s too complicated or costly to complete the process required to be granted benefits. These “procedural denials” can happen at initial applications and at recertifications.
This study examines procedural denials by analyzing 13 years of SNAP administrative data from a single state in the mountain-plains region. We observe whether applications or recertifications were denied and if so, whether they were denied due to ineligibility or for procedural reasons. We present more details about the various denial categories and reasons in Appendix Table A1. Our analysis is somewhat constrained by the denial classification system used by the state. But where possible, we specify where common causes of denial, such as a missed interview, fall under this system.
We tabulate overall denial rates and the percentage of denials that are for procedural reasons for new applications and recertifications for the full sample from 2011 to 2022, and by demographic subgroups for recertifications. By definition, everyone in our data has already taken the first step by applying for SNAP, overcoming any initial administrative burden (specifically, the learning costs related to finding out about the program and the application process).
We show demographic characteristics of SNAP applicants and those recertifying who were denied in Appendix Table A2. In our past work, we have shown that these data are representative of people interacting with the SNAP system at the national level, except that the mountain-plains state is less racially diverse, particularly due to the small size of its Black population.[34]
Our Results
We begin by looking at denial rates and reasons for denials, for new applications and separately for recertifications. We show the outcomes of new applications and eligibility recertifications in Figures 1 and 2 and Appendix Table A3.

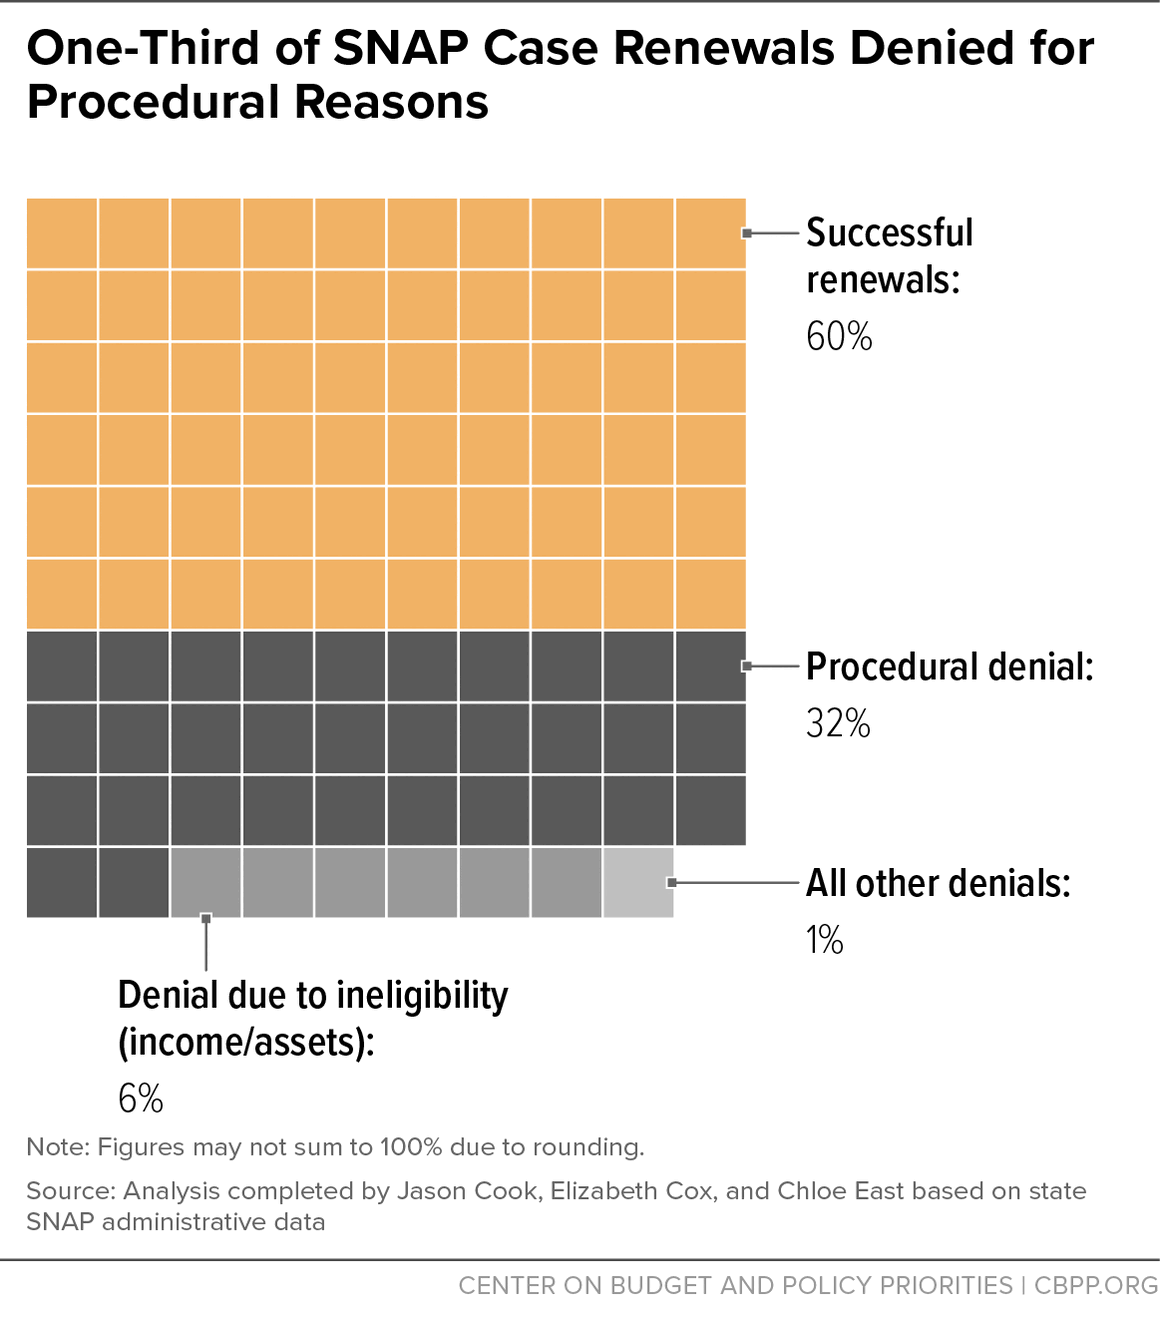
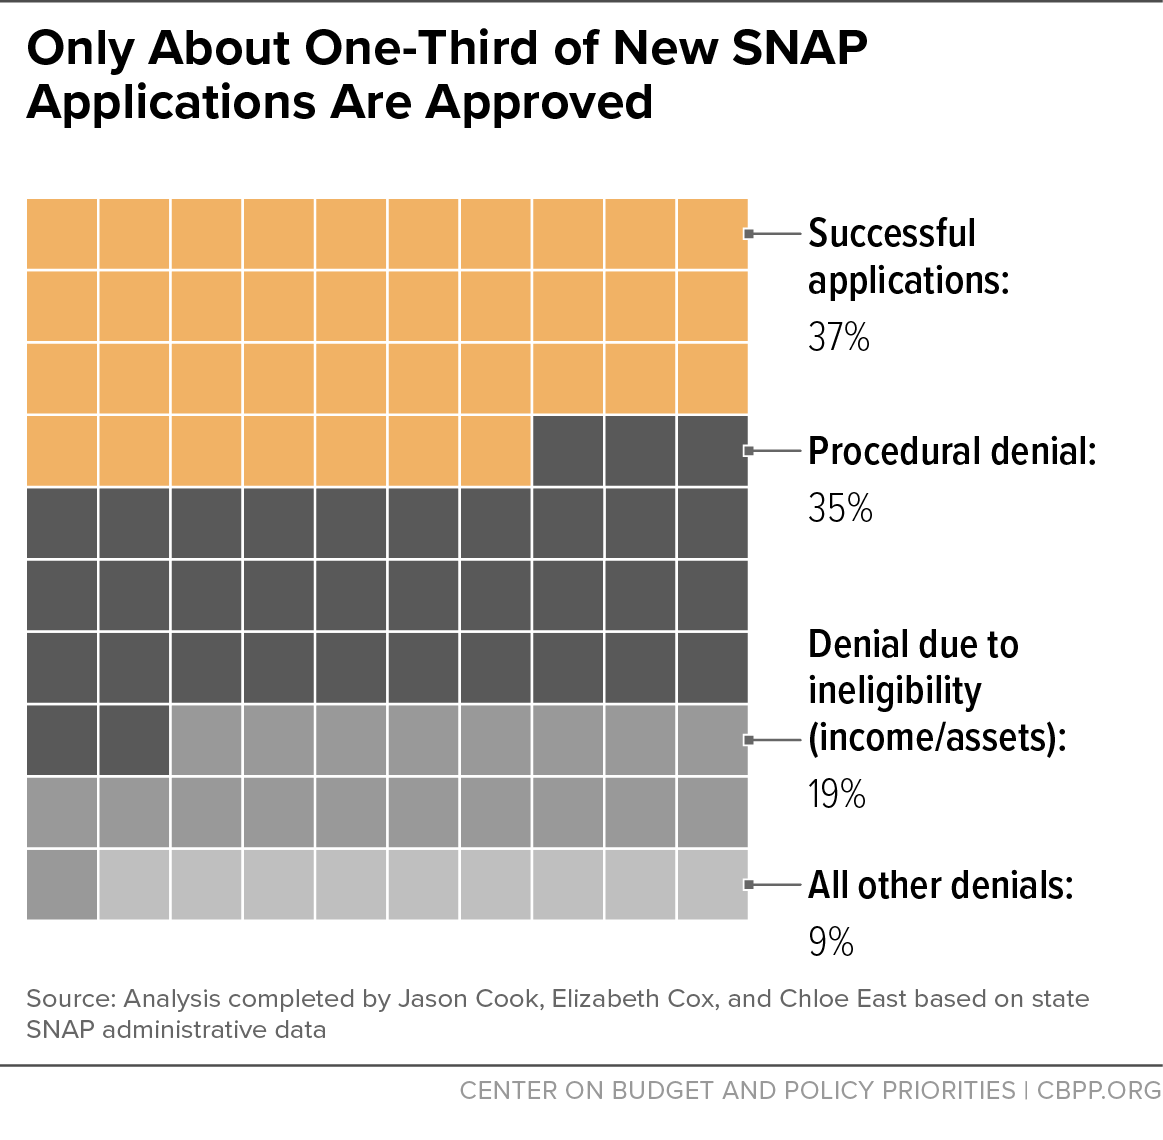
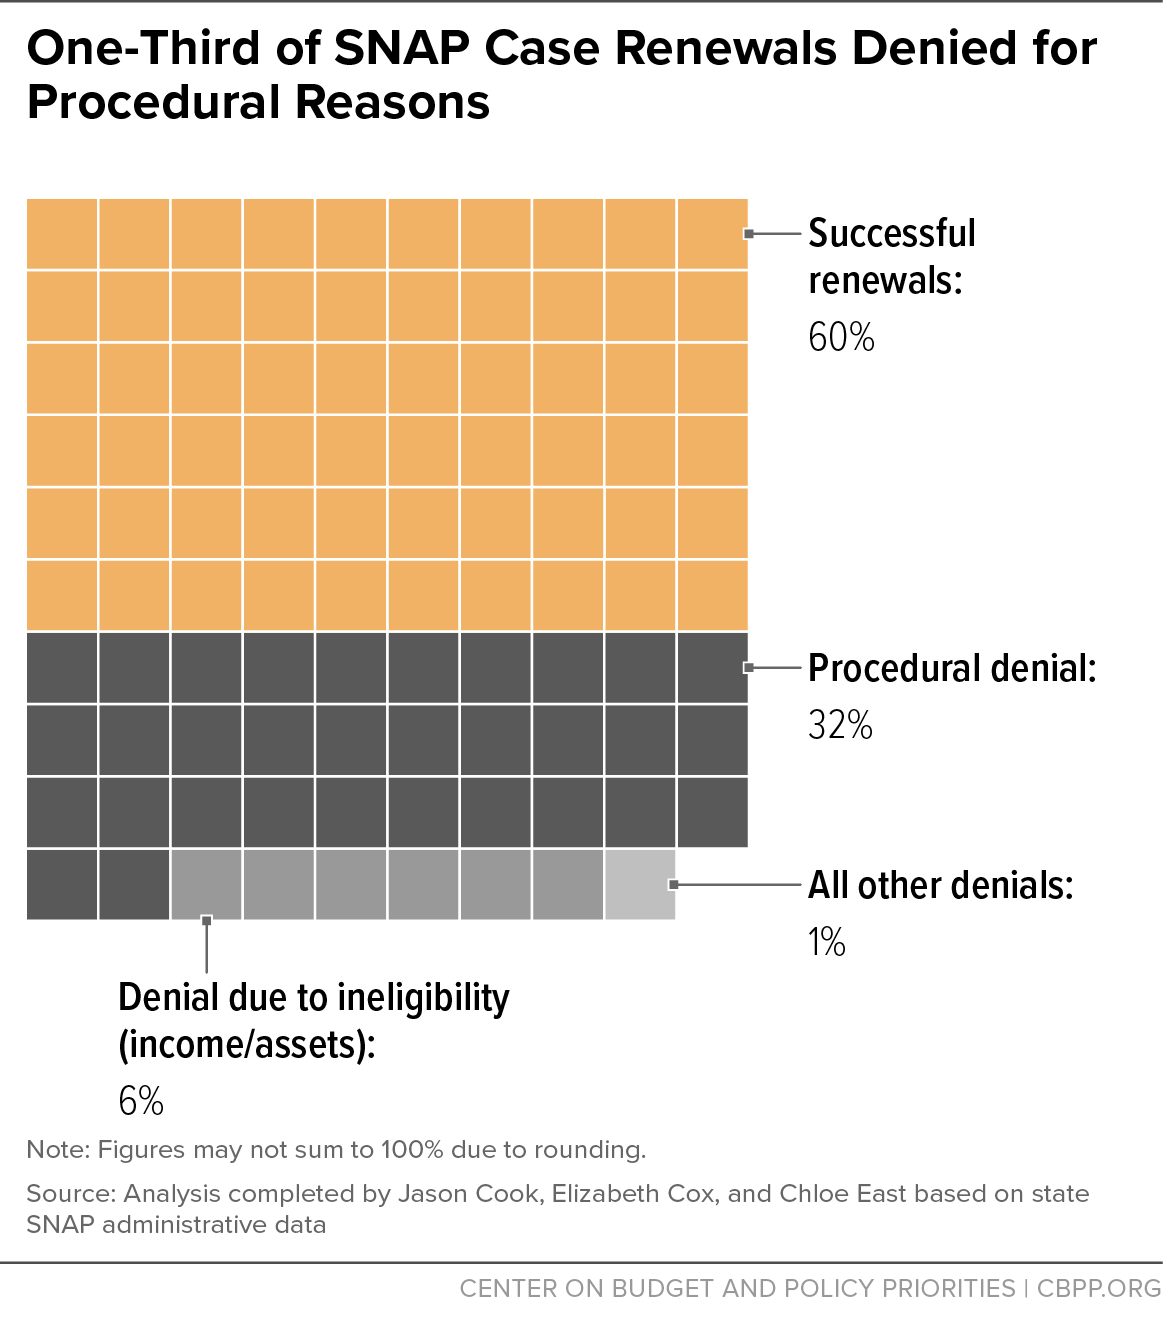
Overall, 63 percent of new applications and 40 percent of recertifications were denied. The denial rate of SNAP recertifications is lower than that of new applications likely because those individuals have already overcome many of the relevant learning costs and been approved for the program. Additionally, households participating in SNAP for more than one recertification cycle have experience navigating a recertification and therefore the learning, compliance, and psychological costs of recertifying again are expected to be lower. Finally, those that are recertifying have been eligible for SNAP for at least the past six months and may be more likely to remain eligible than new applicants.
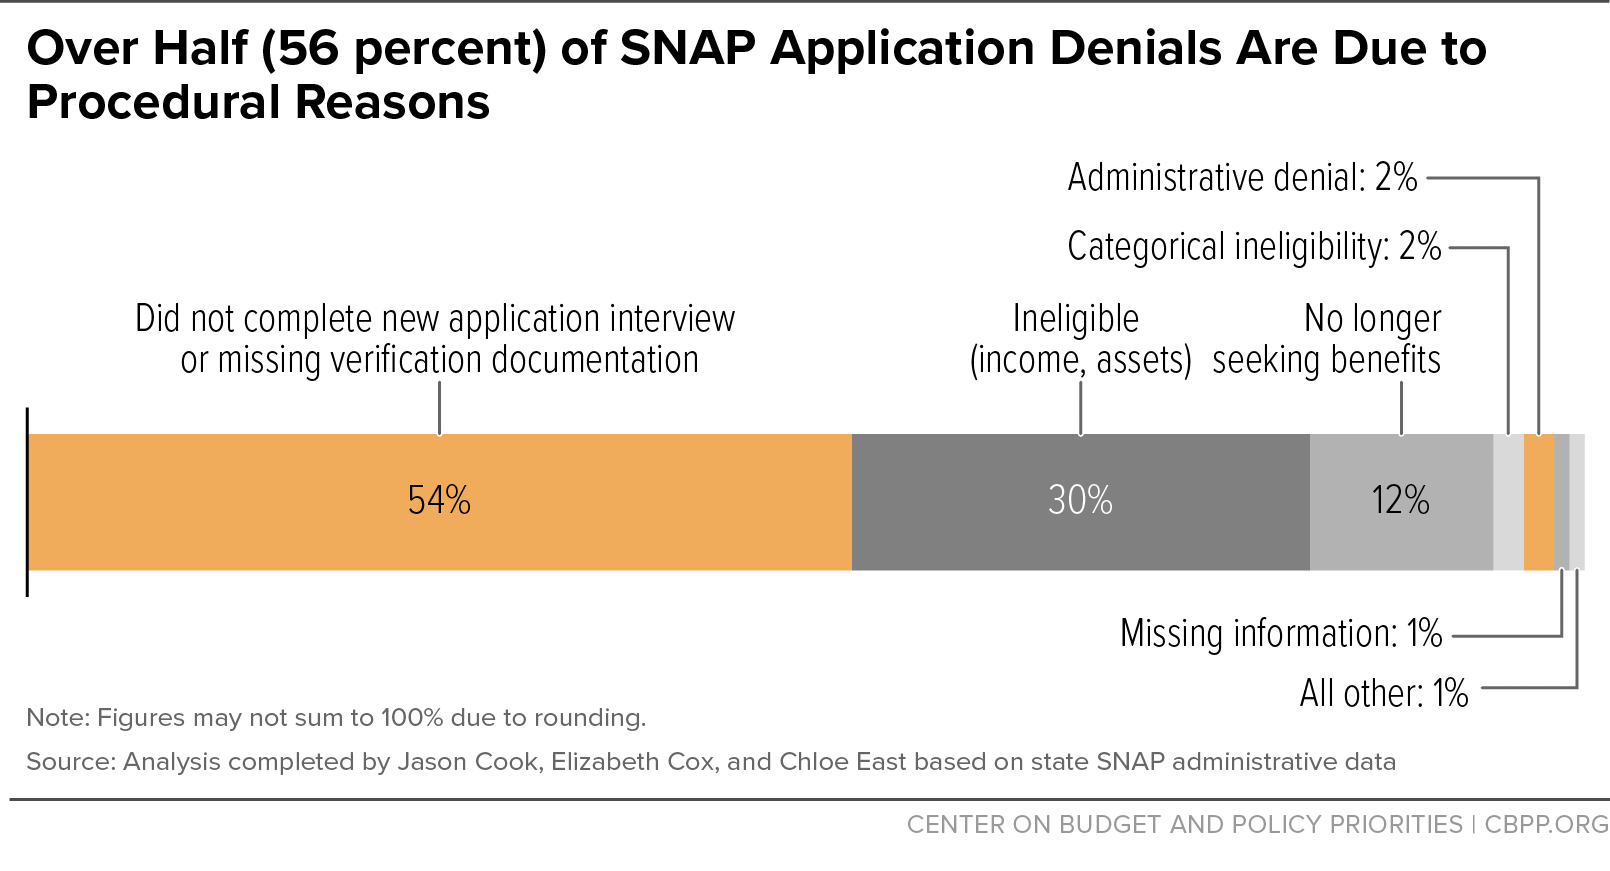
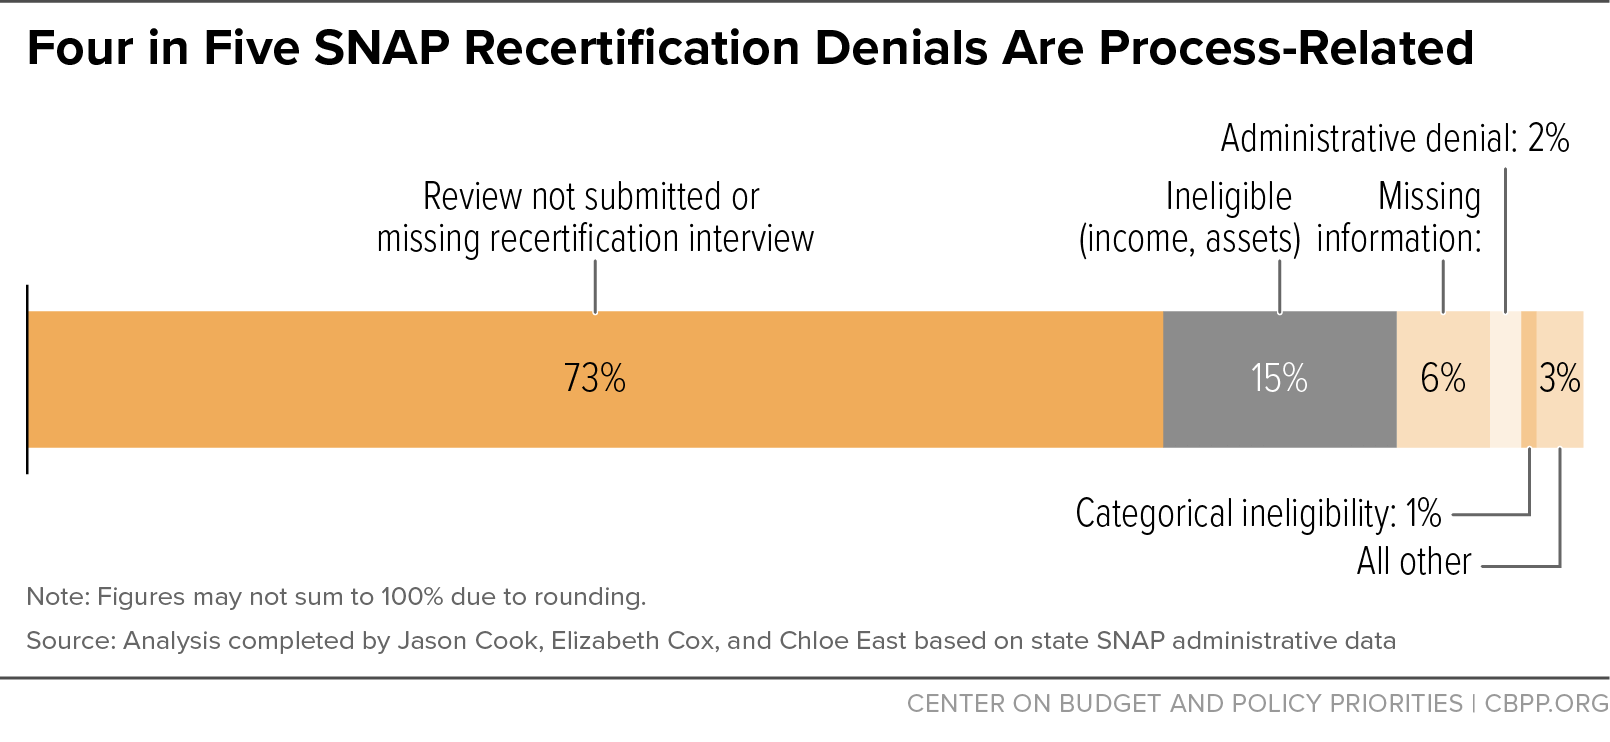
Fifty-six percent of denials on new applications were for procedural reasons, while 30 percent were due to household resources (income or assets) exceeding the eligibility thresholds. Eighty-one percent of denials at recertification were for procedural reasons, and the most common reason was the review or recertification form not being submitted.
Breaking down the different reasons for denials on new applications (see Figure 3), we find that the most common reason was not completing the interview or not providing all of the verification documentation. In our data, we cannot separate cases denied due to incomplete interviews from those denied due to missing verification documentation; this latter category includes not filling out the entire application form (e.g., initially, the household fills out information such as name and address and submits the application, but then does not follow up with the additional required information) and not providing all necessary supporting documentation. However, past research that was able to separate these components found that 33.7 percent of SNAP applicants missed the interview in Los Angeles County, whereas only 8.1 percent did not complete income verification information on the application.[35] Thus, the interview is likely a particularly important barrier.
One possible reason why many applicants do not complete the interview or provide documentation is that they learn they are likely ineligible as they go through the process. However, the research suggests this is not the main driver. For example, as discussed above, more helpful caseworkers have higher application completion rates. If applicants dropped out because they decided they would be ineligible, their caseworker’s behavior wouldn’t impact whether they complete the process. Additionally, procedural denial rates are very high among households with no earnings, a group with high rates of SNAP eligibility. (See Appendix Table A10.)
In Figure 4, we show the most common reasons for denials in recertifications. Seventy-three percent of these denials were because the review was not submitted completely or the recertification interview was not completed.
In the remainder of the analysis, we break the recertification sample down by demographic subgroups. We focus on recertifications because we have more detailed information about household income and demographics for those who do receive SNAP at some point.
Denial Reasons by Earnings Levels
The richness of the data allows us to observe whether the head of household was working before recertification. Many SNAP applicants and participants face barriers to work, plus about half of SNAP participants are below age 18 or above age 64. But working-age participants who can work generally do work.[36] Among a nationally representative sample of SNAP households with working-age adults who are not disabled, 85 percent worked within a given year. Those who do not work report caring for members of their household, having a health condition that limits their ability to work, being in school, or not being able to find work.
We compare the denial rates and reasons across households with no earnings and those with earnings in the four quarters before application or recertification. Those who did have positive earnings have quite low earnings — their median annual earnings were only $18,637 in 2023 dollars. For comparison, median earnings in the U.S. among all workers in 2023 were $50,310.[37]
Figure 5 and Appendix Table A4 show outcomes at recertification, splitting the sample by past earnings. Since almost everyone in the no-earnings group is eligible for SNAP, it is particularly striking that 32 percent were denied for procedural reasons.
Eight percent of those with earnings were denied because household resources exceeded eligibility limits and 32 percent were denied for procedural reasons, which is equivalent to 80 percent of all those denied. This is consistent with past research which found that over 70 percent of SNAP participants remain eligible even after they stop receiving SNAP benefits, having exited due to procedural barriers rather than loss of eligibility.[38]
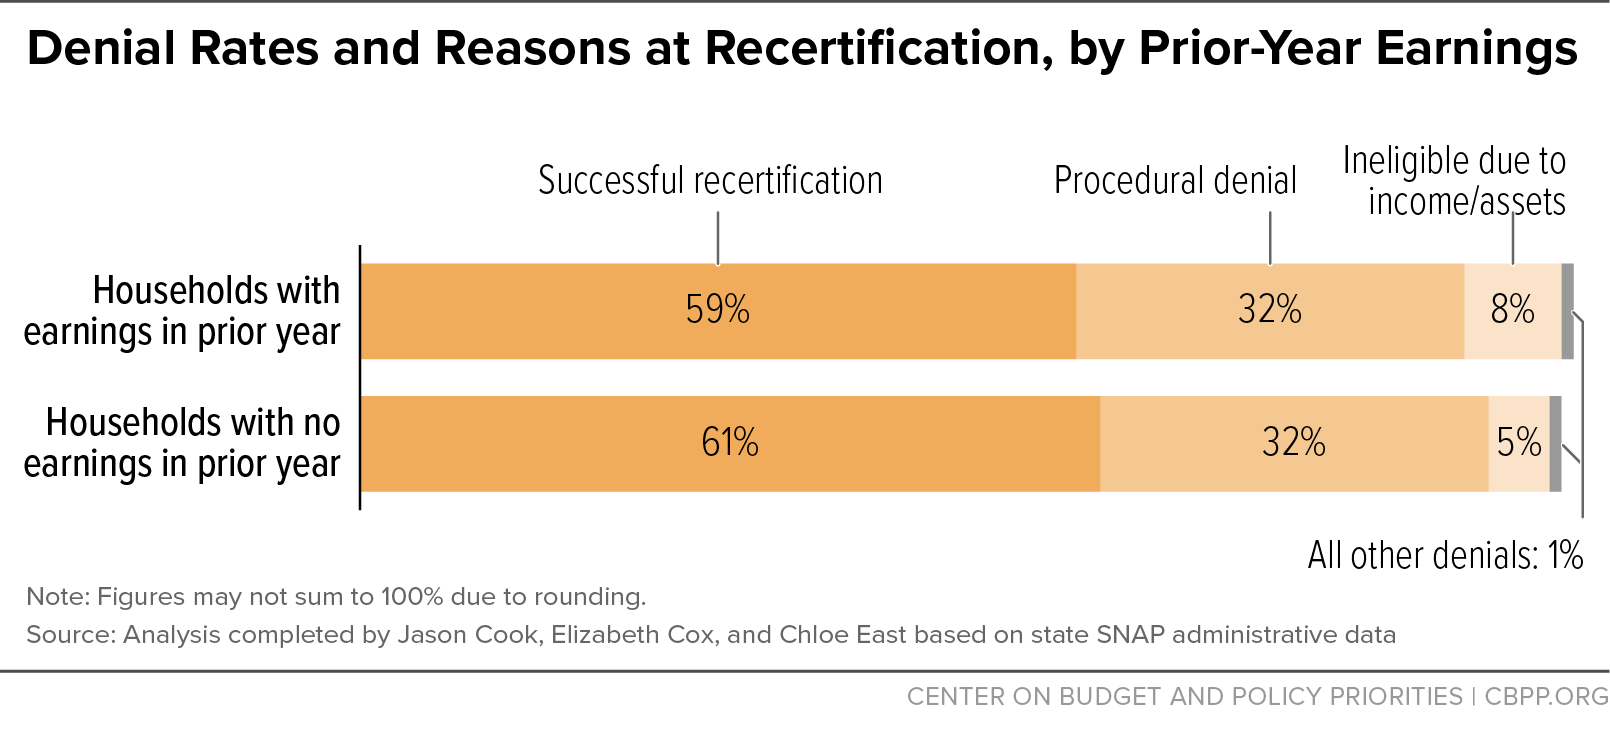
It is also striking that procedural denial rates were so high across both groups (those with and without earnings), given that these households are already familiar with SNAP and most remain eligible after recertification. This suggests that the burden of completing the recertification process is a large barrier to SNAP participation.
The Role of Work Requirements
Less than 1 percent of new applicants and those seeking to recertify were denied for failing to work the required 80 hours a month. (See Appendix Tables A9 and A14.) However, this may undercount the total number of people not receiving SNAP due to work requirements. This is because individuals may choose not to apply for SNAP or recertify because of the work requirements. They may also be more likely to be denied for procedural reasons due to the additional paperwork burdens associated with proving compliance with the work requirements.
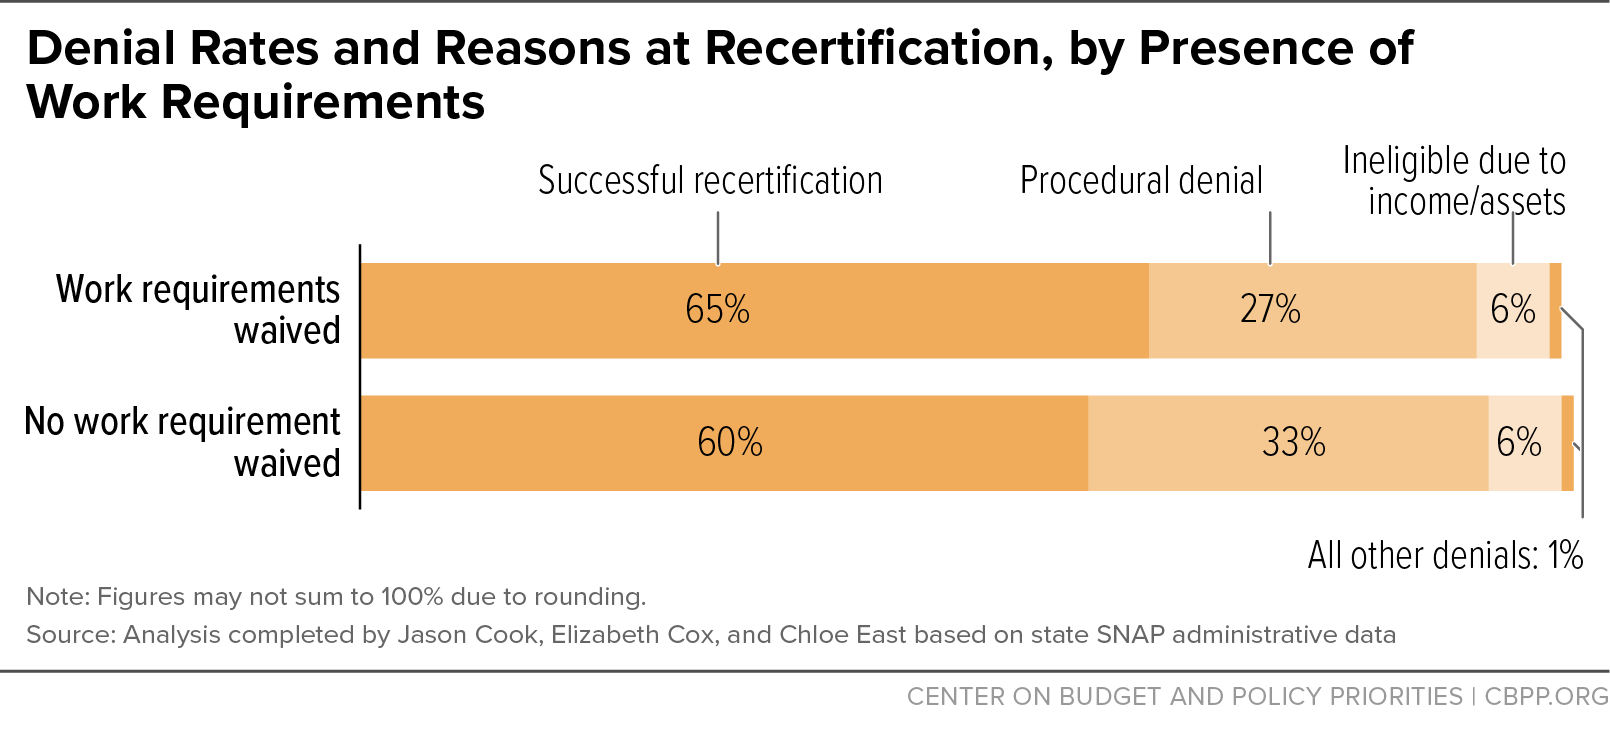
To better understand this potential mechanism, we split the sample by whether a waiver of work requirements for able-bodied adults without dependents (“ABAWDs”) was in effect in the local area at the time of recertification. We find that the overall denial rate was higher when work requirements were in effect (65 percent) compared to when work requirements were waived (60 percent). This can be explained entirely by differences in the frequency of procedural denials; in areas with work requirements, 33 percent were denied for procedural reasons, compared to only 27 percent in areas where the requirements were waived. Additional research by the authors of this piece identify the causal effects of work requirements on denials, and conclude they increase procedural denials by 19 to 26 percent and overall denials by 4 to 10 percent.[39]
Policymakers should end or severely limit work requirements, given that they have large administrative burdens but little impact on employment or wages.[40] Research consistently shows that work requirements cut many people off SNAP without increasing employment or earnings. Research also shows that many people who lose SNAP are working or should have qualified for an exemption, but the bureaucratic red tape made documenting their employment or proving their exemption too difficult.[41] Policymakers should end or limit work requirements and instead advance policies that support employment opportunities without increasing red tape and leaving people hungrier.
Denial Reasons by Other Demographics
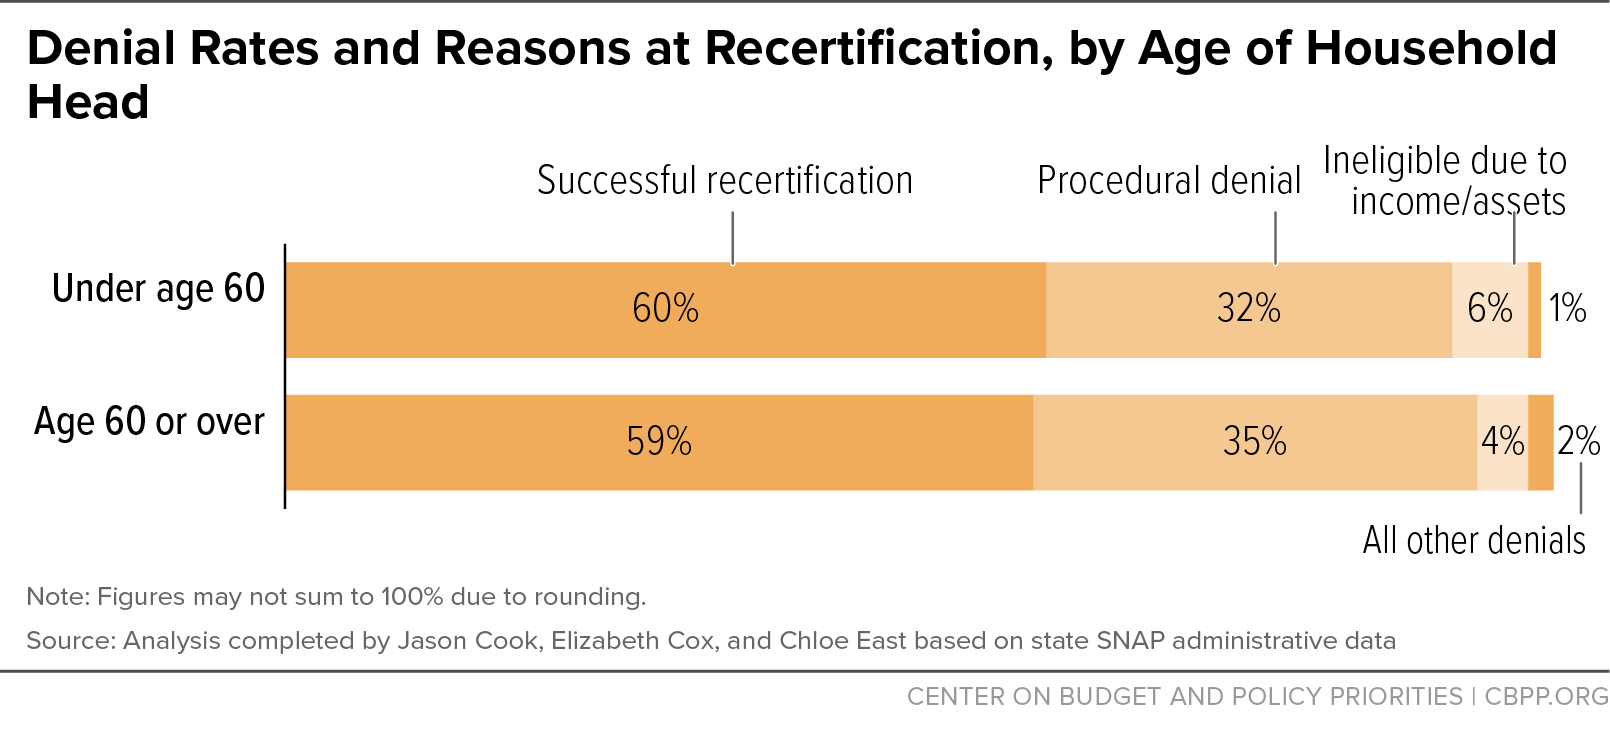
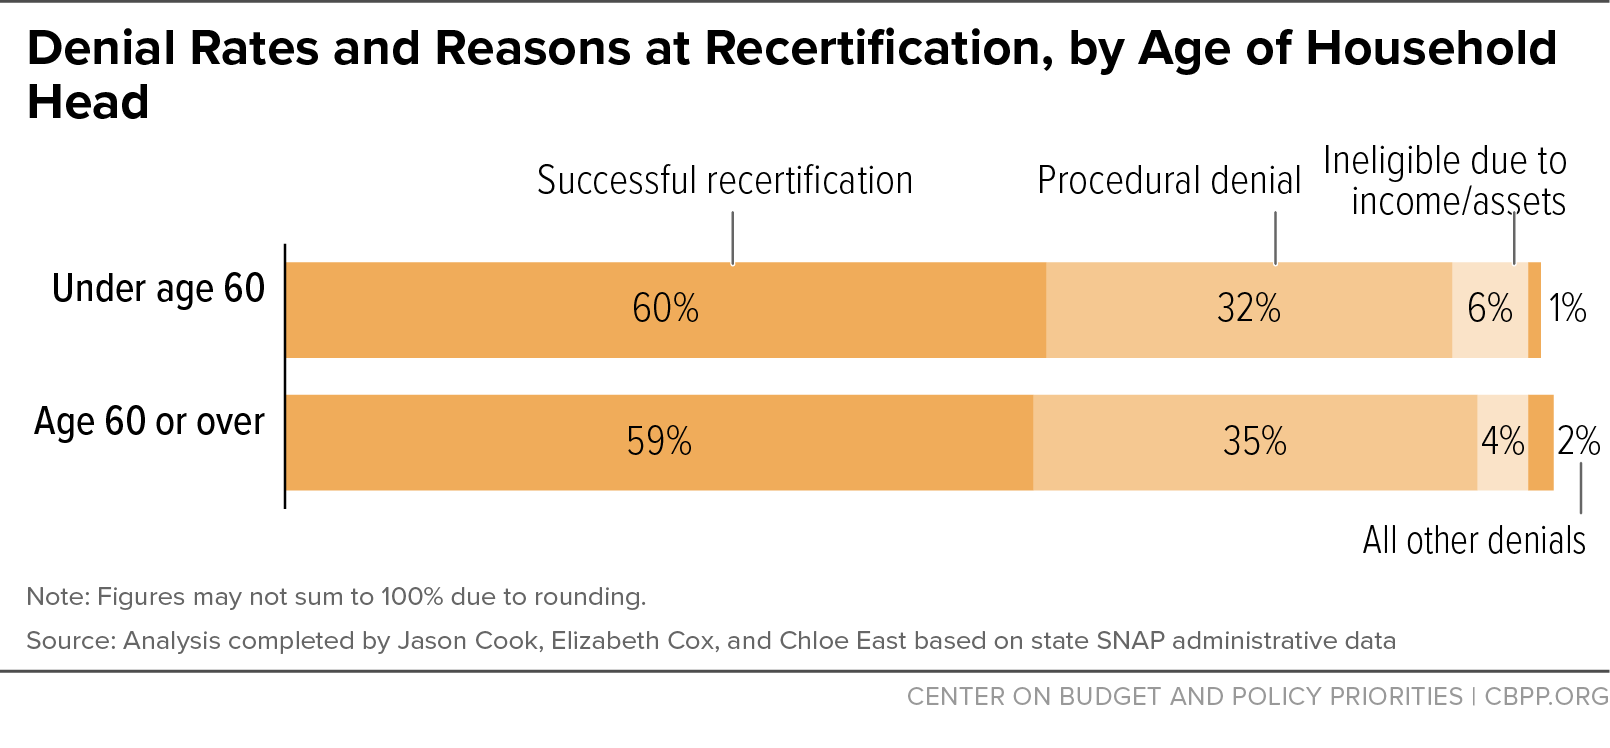
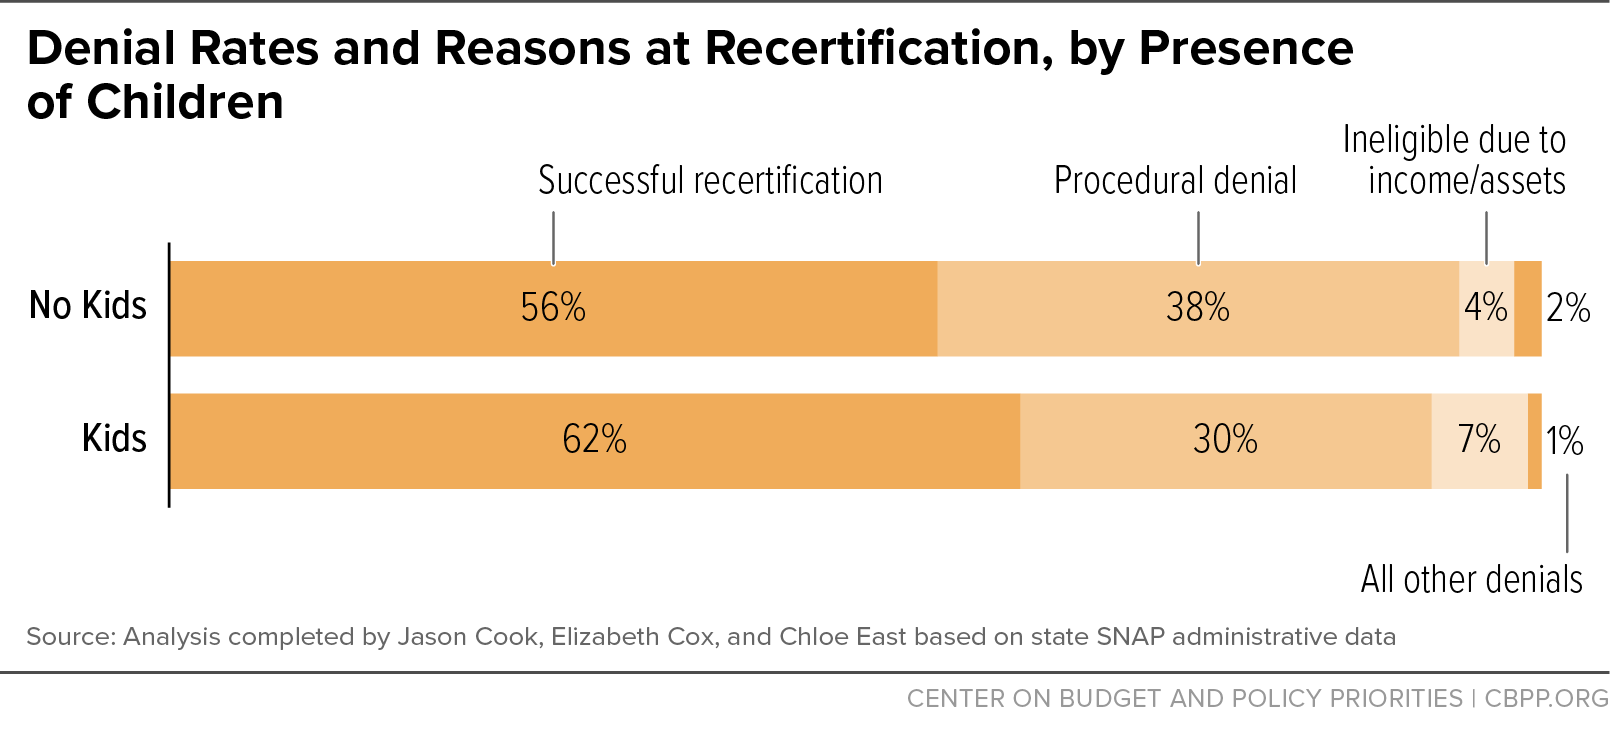
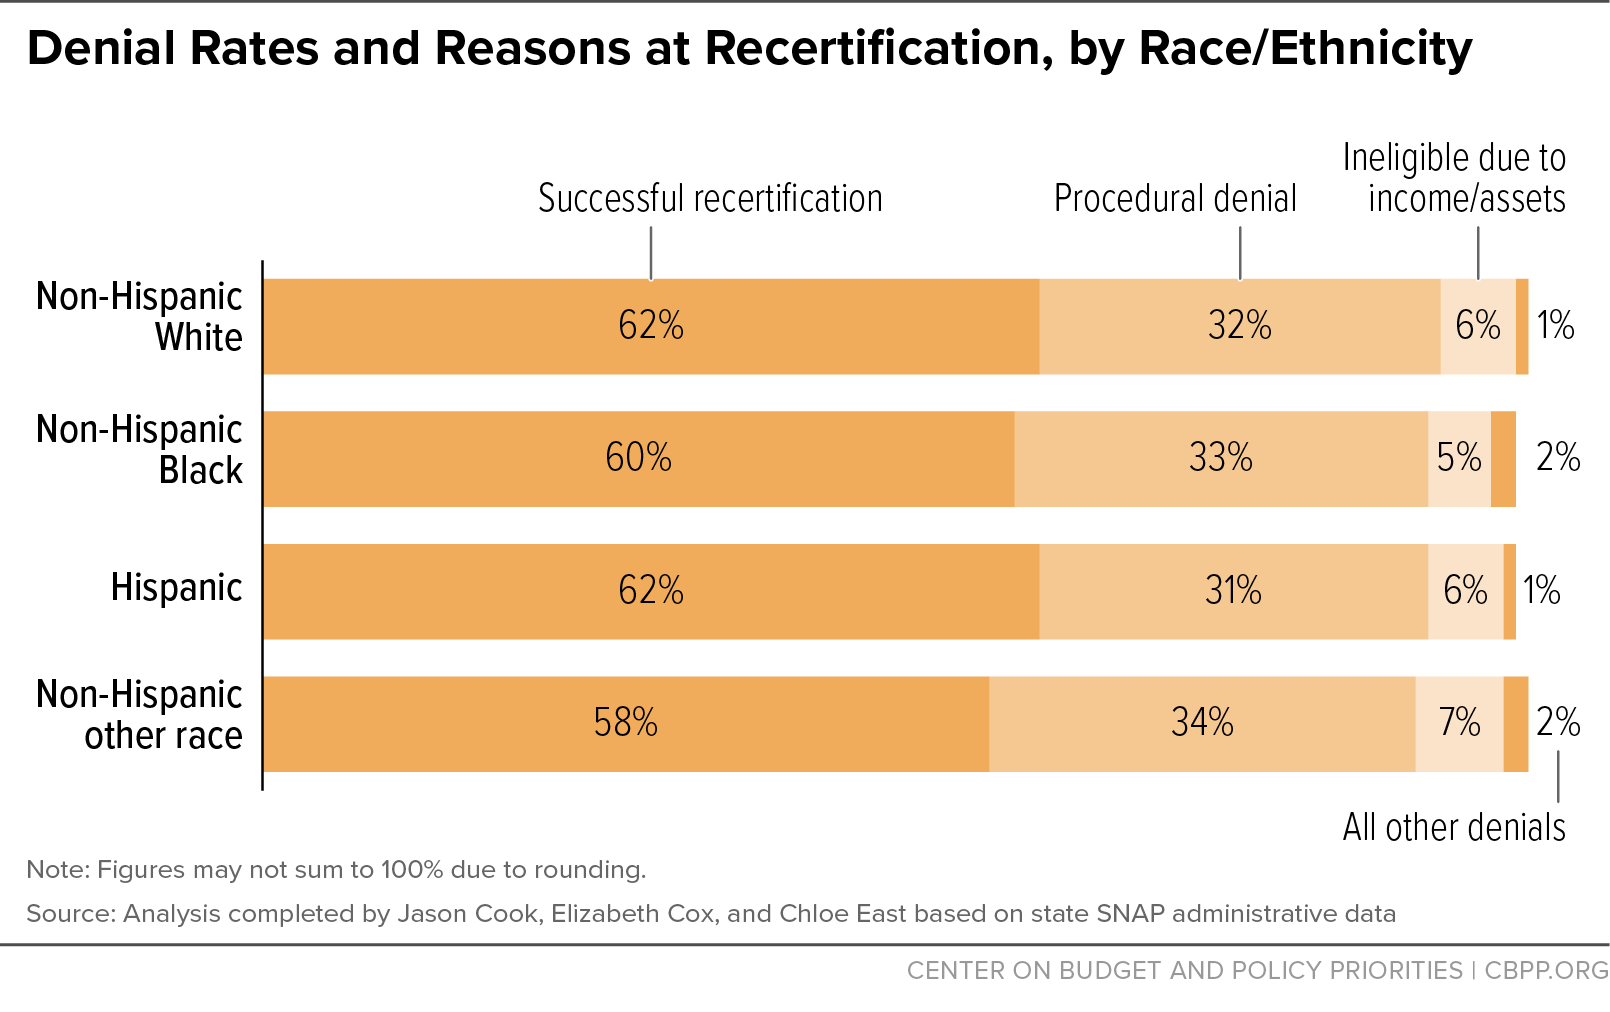
We have also explored denial reasons by demographic characteristics observed before recertification. These include the age of the head of household (above or below age 60), the presence of children in the household, the presence of anyone with a disability in the household, and the race/ethnicity of the head of household.
Generally, we see similar results across demographic groups. One notable result is that households with no children present were more likely to be denied, and more likely to be denied for procedural reasons, than households with children. This may be at least partly related to the fact that households with children are exempt from work requirements, and as such households with no children would be more likely to face the administrative burdens associated with work requirements.[42] Detailed results are provided in Appendix Figures A1-A4.
Appendix
Our analysis uses administrative SNAP application data. These data consist of new SNAP applications and recertification information, regardless of whether the household ended up receiving benefits. We observe the reason for denial of benefits even if the application or recertification was not successful. In these data, there are over 40 unique reasons for which individuals are denied SNAP benefits. We reclassified these reasons for denial into nine primary categories: administrative denial; those who did not complete the new application interview or were missing verification documentation; missing information; household resources exceed limits; categorical ineligibility; ineligible because fails to meet work requirements; no longer seeking benefits, review not submitted or missing recertification interview; and other miscellaneous reasons.
We look at denial reasons using two primary samples: a sample of new applications and another of eligibility recertifications. We define denied new applicants as people who did not receive benefits in the six months before the application date.
To calculate earnings history, we rely on linked state quarterly UI records. We calculate earnings in the quarter before the application or recertification and split the sample based on whether they had any earnings. We only observe earnings of the head of household, but we have shown in other work that two-thirds of applicants in our sample are households headed by a single adult and it is very rare for there to be more than one potential earner in a SNAP household.[43]


| TABLE A1 | |
|---|---|
Details on Denial Reasons | |
| Denial Category | Reasons |
| Administrative denial |
|
| Did not complete new application interview or missing verification documentation |
|
| Missing information |
|
| Ineligible (income, assets, not meeting requirements) |
|
| Ineligible because of work requirements |
|
| Categorical ineligibility (e.g.,. Non-citizens) |
|
| No longer seeking benefits |
|
| Review not submitted or missing recertification interview |
|
| All other |
|
Note: Denial categories and reasons are based on the state’s eligibility system documentation. We do not have additional information or detail about the individual reasons provided here. | |
| TABLE A2 | ||
|---|---|---|
Shares of New Applications and Recertifications That Are Denied | ||
| (1) New applications | (2) Recertifications | |
| White | 34.939% | 44.805% |
| Black | 1.911% | 2.302% |
| Hispanic | 11.723% | 15.156% |
| Other race | 51.427% | 37.737% |
| Has kids | 47.138% | 72.064% |
| No kids | 52.862% | 27.936% |
| HH-size: 1 | 51.277% | 25.857% |
| HH-size: 2 | 16.351% | 17.853% |
| HH-size: 3 | 12.736% | 18.797% |
| HH-size: 4+ | 19.635% | 37.493% |
| Under age 60 | 94.846% | 94.510% |
| Age 60+ | 5.154% | 5.490% |
| No time limit waiver | 89.338% | 95.849% |
| Waived time limit | 10.662% | 4.151% |
| Urban | 75.659% | 74.424% |
| Rural | 22.309% | 23.867% |
| Not during COVID | 75.727% | 94.511% |
| During COVID | 24.273% | 5.489% |
| No baseline earnings | 64.532% | 70.735% |
| Positive baseline earnings | 35.468% | 29.265% |
| Observations | 627609 | 374397 |
Notes: Uses administrative data from the mountain-plains state and includes new applications and recertifications that were denied between 2012-2021. Column (1) uses a sample of denied new applications, and column (2) shows demographics for denied recertifications. | ||
| TABLE A3 | ||
|---|---|---|
Reasons for Denial of New SNAP Applications and Recertifications | ||
| (1) Denied new applications | (2) Denied recertifications | |
| Administrative denial | 1.095% | 0.885% |
| Did not complete new application interview or missing verification documentation | 33.736% | 0.258% |
| Missing information | 0.250% | 2.376% |
| Review not submitted or missing recertification interview | 0.000% | 28.851% |
| Procedural denial | 35.081% | 32.370% |
| Ineligible (income or assets) | 18.930% | 6.101% |
| Ineligible from work requirements | 0.003% | 0.291% |
| Categorical ineligibility (e.g., non-citizens) | 1.464% | 0.478% |
| No longer seeking benefits | 7.299% | 0.343% |
| All other | 0.177% | 0.209% |
| % Denied | 62.954% | 39.792% |
| Observations | 627639 | 374371 |
Notes: Uses administrative data from the mountain-plains state and includes new applications and recertifications that were denied between 2012-2021. Column (1) uses a sample of denied new applications, and column (2) shows denial reasons for denied recertifications. Administrative data include over 40 unique reasons for denial, which we reclassify into the shown denial categories. | ||
Detailed Tables on Denial Reasons for Recertifications by Demographic Group
| TABLE A4 | |||
|---|---|---|---|
Reason for Denial of SNAP Recertification - By Work History | |||
| (1) All | (2) No baseline earnings | (3) Positive baseline earnings | |
| Administrative denial | 0.885% | 0.868% | 0.928% |
| Did not complete new application interview or missing verification documentation | 0.258% | 0.236% | 0.310% |
| Missing information | 2.376% | 2.074% | 3.103% |
| Review not submitted or missing recertification interview | 28.851% | 29.249% | 27.889% |
| Procedural denial | 32.370% | 32.427% | 32.231% |
| Ineligible (income or assets) | 6.101% | 5.266% | 8.117% |
| Ineligible from work requirements | 0.291% | 0.286% | 0.302% |
| Categorical ineligibility (e.g., non-citizens) | 0.478% | 0.557% | 0.289% |
| No longer seeking benefits | 0.343% | 0.377% | 0.261% |
| All other | 0.209% | 0.246% | 0.119% |
| % Denied | 39.792% | 39.160% | 41.319% |
| Observations | 374371 | 264716 | 109655 |
Notes: Uses administrative data from the mountain-plains state and includes recertifications that were denied between 2012-2021. Administrative data denial reasons are reclassified into the shown denial categories. Column (1) shows the results for all work histories, column (2) shows the results for those with no earnings at baseline, column (3) shows those with earnings at baseline. Earnings are calculated using UI quarterly earnings from the quarter proceeding the SNAP application date. | |||
| TABLE A5 | |||
|---|---|---|---|
Reason for Denial of SNAP Recertification - By Work History | |||
| (1) All | (2) Under Age 60 | (3) Age 60 | |
| Administrative denial | 0.885% | 0.868% | 0.928% |
| Did not complete new application interview or missing verification documentation | 0.258% | 0.236% | 0.310% |
| Missing information | 2.376% | 2.074% | 3.103% |
| Review not submitted or missing recertification interview | 28.851% | 29.249% | 27.889% |
| Procedural denial | 32.370% | 32.427% | 32.231% |
| Ineligible (income or assets) | 6.101% | 5.266% | 8.117% |
| Ineligible from work requirements | 0.291% | 0.286% | 0.302% |
| Categorical ineligibility (e.g., non-citizens) | 0.478% | 0.557% | 0.289% |
| No longer seeking benefits | 0.343% | 0.377% | 0.261% |
| All other | 0.209% | 0.246% | 0.119% |
| % Denied | 39.792% | 39.160% | 41.319% |
| Observations | 374371 | 264716 | 109655 |
Notes: Uses administrative data from the mountain-plains state and includes recertifications that were denied between 2012-2021. Administrative data denial reasons are reclassified into the shown denial categories. Column (1) shows the results for all recertifications, column (2) shows the results only among those under age 60, and column (3) shows the results only among those 60 and up. | |||
| TABLE A6 | |||
|---|---|---|---|
Reason for Denial of SNAP Recertification - By Presence of Children in the Household | |||
| (1) All | (2) Children | (3) No Children | |
| Administrative denial | 0.885% | 0.880% | 0.899% |
| Did not complete new application interview or missing verification documentation | 0.258% | 0.024% | 0.862% |
| Missing information | 2.376% | 2.532% | 1.974% |
| Review not submitted or missing recertification interview | 28.851% | 26.790% | 34.165% |
| Procedural denial | 32.370% | 30.227% | 37.898% |
| Ineligible (income or assets) | 6.101% | 6.962% | 3.882% |
| Ineligible from work requirements | 0.291% | 0.138% | 0.686% |
| Categorical ineligibility (e.g., non-citizens) | 0.478% | 0.409% | 0.658% |
| No longer seeking benefits | 0.343% | 0.255% | 0.571% |
| All other | 0.209% | 0.113% | 0.455% |
| % Denied | 39.792% | 38.103% | 44.150% |
| Observations | 374371 | 269786 | 104585 |
Notes: Uses administrative data from the mountain-plains state and includes recertifications that were denied between 2012-2021. Administrative data denial reasons are reclassified into the shown denial categories. Column (1) shows the results for all recertifications, column (2) shows the results only among those with children, and column (3) shows the results only among those with no children. | |||
| TABLE A7 | |||
|---|---|---|---|
Reason for Denial of SNAP Recertification - By Disability | |||
| (1) All | (2) Disability | (3) No disability | |
| Administrative denial | 0.885% | 0.846% | 0.894% |
| Did not complete new application interview or missing verification documentation | 0.258% | 0.111% | 0.291% |
| Missing information | 2.376% | 1.558% | 2.559% |
| Review not submitted or missing recertification interview | 28.851% | 29.588% | 28.685% |
| Procedural denial | 32.37% | 32.103% | 32.429% |
| Ineligible (income or assets) | 6.101% | 4.180% | 6.531% |
| Ineligible from work requirements | 0.291% | 0.111% | 0.331% |
| Categorical ineligibility (e.g., non-citizens) | 0.478% | 0.701% | 0.429% |
| No longer seeking benefits | 0.343% | 0.481% | 0.313% |
| All other | 0.209% | 0.435% | 0.158% |
| % Denied | 39.792% | 38.011% | 40.191% |
| Observations | 374371 | 68467 | 305904 |
Notes: Uses administrative data from the mountain-plains state and includes recertifications that were denied between 2012-2021. Administrative data denial reasons are reclassified into the shown denial categories. Column (1) shows the results for all recertifications, column (2) shows the results only among those with person with a disability in the household, and column (3) shows the results only among those with no disability in the household. | |||
| TABLE A8 | ||||||
|---|---|---|---|---|---|---|
Reason for Denial of Recertification - By Race | ||||||
| (1) All | (2) White | (3) Black | (4) Hispanic | (5) Other | ||
| Administrative denial | 0.885% | 0.826% | 0.893% | 0.967% | 0.923% | |
| Did not complete new application interview or missing verification documentation | 0.258% | 0.262% | 0.360% | 0.187% | 0.276% | |
| Missing information | 2.376% | 2.228% | 3.237% | 2.311% | 2.525% | |
| Review not submitted or missing recertification interview | 28.851% | 28.170% | 28.855% | 27.448% | 30.222% | |
| Procedural denial | 32.370% | 31.485% | 33.345% | 30.913% | 33.946% | |
| Ineligible (income or assets) | 6.101% | 5.773% | 5.163% | 6.004% | 6.588% | |
| Ineligible from work requirements | 0.291% | 0.309% | 0.278% | 0.187% | 0.311% | |
| Categorical ineligibility (e.g., non-citizens) | 0.478% | 0.400% | 0.812% | 0.299% | 0.623% | |
| No longer seeking benefits | 0.343% | 0.236% | 0.278% | 0.287% | 0.498% | |
| All other | 0.209% | 0.186% | 0.325% | 0.178% | 0.241% | |
| % Denied | 39.792% | 38.389% | 40.202% | 37.868% | 42.206% | |
| Observations | 374371 | 167707 | 8619 | 56766 | 141279 | |
Notes: Uses administrative data from the mountain-plains state and includes recertifications that were denied between 2012-2021. Administrative data denial reasons are reclassified into the shown denial categories. Column (1) shows the results for all recertifications, column (2) shows the results for non-Hispanic whites, column (3) shows the results for non-Hispanic Blacks, column (4) shows the results for Hispanics, and column (5) shows the results for non-Hispanic other races. | ||||||
| TABLE A9 | |||
|---|---|---|---|
Reason for Denial of SNAP Recertification - By ABAWD Time Limit Waiver | |||
| (1) All | (2) No time limit waiver | (3) Time limit waived | |
| Administrative denial | 0.885% | 0.899% | 0.566% |
| Did not complete new application interview or missing verification documentation | 0.258% | 0.252% | 0.399% |
| Missing information | 2.376% | 2.387% | 2.124% |
| Review not submitted or missing recertification interview | 28.851% | 29.046% | 24.342% |
| Procedural denial | 32.370% | 32.584% | 27.431% |
| Ineligible (income or assets) | 6.101% | 6.113% | 5.825% |
| Ineligible from work requirements | 0.291% | 0.286% | 0.405% |
| Categorical ineligibility (e.g., non-citizens) | 0.478% | 0.477% | 0.502% |
| No longer seeking benefits | 0.343% | 0.344% | 0.328% |
| All other | 0.209% | 0.213% | 0.103% |
| % Denied | 39.792% | 40.017% | 34.595% |
| Observations | 374371 | 358834 | 15537 |
Notes: Uses administrative data from the mountain-plains state and includes new applications and recertifications that were denied between 2012-2021. Administrative data denial reasons are reclassified into the shown denial categories. Column (1) shows the results for all new recertifications, column (2) shows the results for areas with no time limit waiver, and column (3) shows the results for areas with an ABAWD time limit waiver in place. | |||
Detailed Tables on Denial Reasons for New Applications by Demographic Group
| TABLE A10 | |||
|---|---|---|---|
Reason for Denial of New SNAP Applications - By Work History | |||
| (1) All | (2) No baseline earnings | (3) Positive baseline earnings | |
| Administrative denial | 1.095% | 1.203% | 0.899% |
| Did not complete new application interview or missing verification documentation | 33.736% | 33.193% | 34.722% |
| Missing information | 0.250% | 0.285% | 0.186% |
| Review not submitted or missing recertification interview | 0.000% | 0.000% | 0.000% |
| Procedural denial | 35.081% | 34.682% | 35.807% |
| Ineligible (income or assets) | 18.930% | 17.474% | 21.579% |
| Ineligible from work requirements | 0.003% | 0.003% | 0.003% |
| Categorical ineligibility (e.g., non-citizens) | 1.464% | 2.159% | 0.199% |
| No longer seeking benefits | 7.299% | 7.082% | 7.695% |
| All other | 0.177% | 0.218% | 0.101% |
| % Denied | 62.954% | 61.618% | 65.385% |
| Observations | 627639 | 405001 | 222638 |
Notes: Uses administrative data from the mountain-plains state and includes new applications that were denied between 2012-2021. Administrative data denial reasons are reclassified into the shown denial categories. Column (1) shows the results for those with all work histories, column (2) shows the results for those with no earnings at baseline, column (3) shows those with earnings at baseline. Earnings are calculated using UI quarterly earnings from the quarter proceeding the SNAP application date. | |||
| TABLE A11 | |||
|---|---|---|---|
Reason for Denial of New SNAP Applications - By Age | |||
| (1) All | (2) Under age 60 | (3) Age 60+ | |
| Administrative denial | 1.095% | 1.066% | 1.638% |
| Did not complete new application interview or missing verification documentation | 33.736% | 34.255% | 24.188% |
| Missing information | 0.250% | 0.253% | 0.192% |
| Review not submitted or missing recertification interview | 0.000% | 0.000% | 0.000% |
| Procedural denial | 35.081% | 35.574% | 26.018% |
| Ineligible (income or assets) | 18.93% | 18.285% | 30.790% |
| Ineligible from work requirements | 0.003% | 0.002% | 0.012% |
| Categorical ineligibility (e.g., non-citizens) | 1.464% | 1.417% | 2.321% |
| No longer seeking benefits | 7.299% | 7.293% | 7.422% |
| All other | 0.177% | 0.168% | 0.340% |
| % Denied | 62.954% | 62.739% | 66.904% |
| Observations | 627639 | 595288 | 32351 |
Notes: Uses administrative data from the mountain-plains state and includes new applications that were denied between 2012-2021. Administrative data denial reasons are reclassified into the shown denial categories. Column (1) shows the results for all new applications, column (2) shows the results only among those age 60, and column (3) shows the results only among those 60 and up. | |||
| TABLE A12 | |||
|---|---|---|---|
Reason for Denial of New SNAP Applications - By Presence of Children in the Household | |||
| (1) All | (2) Children | (3) No Children | |
| Administrative denial | 1.095% | 1.231% | 0.974% |
| Did not complete new application interview or missing verification documentation | 33.736% | 33.480% | 33.963% |
| Missing information | 0.250% | 0.342% | 0.168% |
| Review not submitted or missing recertification interview | 0.000% | 0.000% | 0.000% |
| Procedural denial | 35.081% | 35.054% | 35.106% |
| Ineligible (income or assets) | 18.930% | 23.382% | 14.960% |
| Ineligible from work requirements | 0.003% | 0.001% | 0.005% |
| Categorical ineligibility (e.g., non-citizens) | 1.464% | 1.536% | 1.400% |
| No longer seeking benefits | 7.299% | 9.062% | 5.728% |
| All other | 0.177% | 0.067% | 0.274% |
| % Denied | 62.954% | 69.102% | 57.472% |
| Observations | 627639 | 295846 | 331793 |
Notes: Uses administrative data from the mountain-plains state and includes new applications that were denied between 2012-2021. Administrative data denial reasons are reclassified into the shown denial categories. Column (1) shows the results for all new applications, column (2) shows the results only among those with children, and column (3) shows the results only among those with no children. | |||
| TABLE A13 | ||||||
|---|---|---|---|---|---|---|
Reason for Denial of Recertification - By Race | ||||||
| (1) All | (2) White | (3) Black | (4) Hispanic | (5) Other | ||
| Administrative denial | 1.095% | 0.970% | 0.993% | 1.520% | 1.088% | |
| Did not complete new application interview or missing verification documentation | 33.736% | 33.488% | 29.535% | 32.207% | 34.409% | |
| Missing information | 0.250% | 0.235% | 0.259% | 0.393% | 0.228% | |
| Review not submitted or missing recertification interview | 0.000% | 0.000% | 0.000% | 0.000% | 0.000% | |
| Procedural denial | 35.081% | 34.693% | 30.787% | 34.120% | 35.724% | |
| Ineligible (income or assets) | 18.930% | 18.879% | 16.749% | 20.620% | 18.660% | |
| Ineligible from work requirements | 0.003% | 0.001% | 0.000% | 0.003% | 0.004% | |
| Categorical ineligibility (e.g., non-citizens) | 1.464% | 1.122% | 2.419% | 1.459% | 1.662% | |
| No longer seeking benefits | 7.299% | 7.094% | 5.263% | 7.577% | 7.451% | |
| All other | 0.177% | 0.187% | 0.317% | 0.178% | 0.164% | |
| % Denied | 62.954% | 61.976% | 55.534% | 63.957% | 63.665% | |
| Observations | 627639 | 219213 | 11989 | 73626 | 322811 | |
Notes: Uses administrative data from the mountain-plains state and includes new applications that were denied between 2012-2021. Administrative data denial reasons are reclassified into the shown denial categories. Column (1) shows the results for all new applications, column (2) shows the results for non-Hispanic whites, column (3) shows the results for non-Hispanic Blacks, column (4) shows the results for Hispanics, and column (5) shows the results for non-Hispanic other races. | ||||||
| TABLE A14 | |||
|---|---|---|---|
Reason for Denial of New SNAP Applications - By ABAWD Time Limit Waiver | |||
| (1) All | (2) No time limit waiver | (3) Time limit waived | |
| Administrative denial | 0.920% | 0.897% | 1.104% |
| Did not complete new application interview or missing verification documentation | 35.693% | 36.462% | 29.507% |
| Missing information | 0.168% | 0.146% | 0.341% |
| Review not submitted or missing recertification interview | 0.000% | 0.000% | 0.000% |
| Procedural denial | 36.781% | 37.505% | 30.952% |
| Ineligible (income or assets) | 12.910% | 12.983% | 12.315% |
| Ineligible from work requirements | 0.004% | 0.003% | 0.013% |
| Categorical ineligibility (e.g., non-citizens) | 1.238% | 1.194% | 1.588% |
| No longer seeking benefits | 5.632% | 5.169% | 9.358% |
| All other | 0.257% | 0.273% | 0.124% |
| % Denied | 62.954% | 63.351% | 59.627% |
| Observations | 283727 | 252375 | 31352 |
Notes: Uses administrative data from the mountain-plains state and includes new applications that were denied between 2012-2021. Administrative data denial reasons are reclassified into the shown denial categories. Column (1) shows the results for all new applications, column (2) shows the results for areas with no time limit waiver, and column (3) shows the results for areas with an ABAWD time limit waiver in place. | |||
End Notes
[1] Jason Cook is a professor of economics at the University of Utah. Elizabeth Cox is a professional research assistant at the University of Colorado Boulder. Chloe East is a professor of economics at the University of Colorado Boulder. The authors submitted this report to CBPP in July 2025.
[2] Katie Bergh, “Republican Plans to Slash Food Assistance Aren’t About ‘Program Integrity,’” CBPP, May 1, 2025, https://www.cbpp.org/blog/republican-plans-to-slash-food-assistance-arent-about-program-integrity.
[3] Steven Carlson and Joseph Llobrera, “SNAP Is Linked With Improved Health Outcomes and Lower Health Care Costs,” CBPP, December 14, 2022, https://www.cbpp.org/research/food-assistance/snap-is-linked-with-improved-health-outcomes-and-lower-health-care-costs.
[4] CBPP, “A Quick Guide to SNAP Eligibility and Benefits,” updated October 3, 2025, https://www.cbpp.org/research/food-assistance/a-quick-guide-to-snap-eligibility-and-benefits.
[5] Elizabeth Cox, Chloe East, and Isabelle Pula, “Beyond hunger: The role of SNAP in alleviating financial strain for low-income households,” Hamilton Project, June 20, 2024, https://www.hamiltonproject.org/publication/post/beyond-hunger-the-role-of-snap-in-alleviating-financial-strain-for-low-income-households/.
[6] Carlson and Llobrera, op. cit.; Steven Carlson et al., “SNAP Works for America’s Children,” CBPP, September 29, 2016, https://www.cbpp.org/research/snap-works-for-americas-children.
[7] Food and Nutrition Administration (FNA, formerly Food and Nutrition Service), U.S. Department of Agriculture, “Trends in Supplemental Nutrition Assistance Program Participation Rates: Fiscal Year 2020 and Fiscal Year 2022,” October 2024, https://fna-bwbufwdzbabpezgc.z01.azurefd.us/sites/default/files/resource-files/ops-snap-trendsfy20-fy22-report.pdf.
[8] Ibid. Because the data source used to estimate the number of SNAP participants (the numerator of the participation calculation) is different from the data source used to estimate the number of eligible individuals (the denominator), this can result in estimated participation rates of 100 percent or more, which is the case for participation rates among children.
[9] CBPP, “States Are Using Much-Needed Temporary Flexibility in SNAP to Respond to COVID-19 Challenges,” updated January 25, 2023, https://www.cbpp.org/research/food-assistance/most-states-are-using-new-flexibility-in-snap-to-respond-to-covid-19.
[10] Katie Bergh and Dottie Rosenbaum, “New Data Underscore SNAP Cost Shift’s Harm to Low-Income Families and State Budgets,” CBPP, July 23, 2026, https://www.cbpp.org/research/food-assistance/new-data-underscore-snap-cost-shifts-harm-to-low-income-families-and-state.
[11] Code for America, “The Benefits Enrollment Field Guide,” updated September 2025, https://codeforamerica.org/explore/benefits-enrollment-field-guide/#explore-states; FNA, “SNAP Model Notice Toolkit,” https://fna-bwbufwdzbabpezgc.z01.azurefd.us/sites/default/files/resource-files/SNAP-Model-Notice-Toolkit-Introduction.pdf.
[12] Susan Bartlett et al., “Food Stamp Program Access Study: Final Report,” Economic Research Service, U.S. Department of Agriculture, November 17, 2004, https://www.ers.usda.gov/publications/pub-details/?pubid=43407. Administrative changes to the program since 2000 have streamlined this process somewhat (e.g., creating online applications and replacing in-person interviews with over-the-phone ones).
[13] FNA, “Estimates of State Supplemental Nutrition Assistance Program Participation Rates in 2022,” February 2025, https://fna-bwbufwdzbabpezgc.z01.azurefd.us/sites/default/files/resource-files/ear-snap-Reaching-Those-in-Need-2022.pdf. Some states may have estimated participation rates of 100 percent or more, but this is due to differences in the data sources used to estimate the numerator and denominator of the participation rate measure.
[14] Donald Moynihan, Pamela Herd, and Hope Harvey, “Administrative Burden: Learning, Psychological, and Compliance Costs in Citizen-State Interactions,” Journal of Public Administration Research and Theory, Vol. 25, No. 1, January 2015, https://www.jstor.org/stable/24484941?seq=3.
[15] Lauren Bauer and Chloe N. East, “A primer on SNAP work requirements,” Hamilton Project, April 9, 2026, https://www.hamiltonproject.org/publication/paper/a-primer-on-snap-work-requirements/; LaDonna Pavetti et al., “Expanding Work Requirements Would Make It Harder for People to Meet Basic Needs,” CBPP, March 15, 2023, https://www.cbpp.org/research/poverty-and-inequality/expanding-work-requirements-would-make-it-harder-for-people-to-meet.
[16] Moynihan, Herd, and Harvey, op. cit.
[17] FNA, “SNAP Application Processing Timeliness,” 2023, https://www.fna.usda.gov/snap/qc/timeliness.
[18] Amy Finkelstein and Matthew J. Notowidigdo, “Take-Up and Targeting: Experimental Evidence from SNAP,” Quarterly Journal of Economics, Vol. 134, No. 3, August 2019, https://doi.org/10.1093/qje/qjz013.
[19] Beth Osborne Daponte, Seth Sanders, and Lowell Taylor, “Why Do Low-Income Households not Use Food Stamps? Evidence from an Experiment,” Journal of Human Resources, Vol. 34, No. 3, Summer 1999, https://doi.org/10.2307/146382; Finkelstein and Notowidigdo, op. cit.
[20] Finkelstein and Notowidigdo, op. cit.
[21] Jenna Anders and Charlie Rafkin, “The Welfare Effects of Eligibility Expansions: Theory and Evidence from SNAP,” American Economic Journal: Economic Policy, Vol. 18, No. 3, August 2026, https://www.aeaweb.org/articles?id=10.1257/pol.20220738&&from=f.
[22] Jason B. Cook and Chloe N. East, “The Effect of Means-Tested Transfers on Work: Evidence from Quasi-Randomly Assigned SNAP Caseworkers,” National Bureau of Economic Research, revised May 2025, https://www.nber.org/papers/w31307.
[23] Derek Wu and Bruce D. Meyer, “Certification and Recertification in Welfare Programs: What Happens When Automation Goes Wrong?” National Bureau of Economic Research, July 2023, https://www.nber.org/papers/w31437.
[24] Peter Ganong and Jeffrey B. Liebman, “The Decline, Rebound, and Further Rise in SNAP Enrollment: Disentangling Business Cycle Fluctuations and Policy Changes,” American Economic Journal: Economic Policy, Vol. 10, No. 4, November 2018, https://www.aeaweb.org/articles?id=10.1257/pol.20140016.
[25] Eric Giannella et al., “Administrative Burden and Procedural Denials: Experimental Evidence from SNAP,” American Economic Journal: Economic Policy, Vol. 16, No. 4, November 2024, https://www.aeaweb.org/articles?id=10.1257/pol.20220701.
[26] Gretchen Rowe et al., “Assessment of the Contributions of an Interview to SNAP Eligibility and Benefit Determinations: Final Report,” FNA, May 2015, https://fna-bwbufwdzbabpezgc.z01.azurefd.us/sites/default/files/ops/SNAPInterview.pdf.
[27] Giannella et al., op. cit.
[28] Matthew Unrath, “Targeting, Screening, and Retention: Evidence from the Supplemental Nutrition Assistance Program in California,” March 2024, https://mattunrath.github.io/files/research/Unrath_SNAP.pdf.
[29] Ganong and Liebman, op. cit.
[30] Tatiana Homonoff and Jason Somerville, “Program Recertification Costs: Evidence from SNAP,” American Economic Journal: Economic Policy, Vol. 13, No. 4, November 2021, https://www.aeaweb.org/articles?id=10.1257/pol.20190272.
[31] Maria J. Hanratty, “Has the Food Stamp Become More Accessible? Impacts of Recent Changes in Reporting Requirements and Asset Eligibility Limits,” Journal of Policy Analysis and Management, Vol. 25, No. 3, Summer 2006, https://www.jstor.org/stable/30162743; Colin Gray, “Leaving benefits on the table: Evidence from SNAP,” Journal of Public Economics, Vol. 179, November 2019, https://www.sciencedirect.com/science/article/abs/pii/S004727271930115X.
[32] Hilary W. Hoynes and Diane Schanzenbach, “Consumption Responses to In-Kind Transfers: Evidence from the Introduction of the Food Stamp Program,” American Economic Journal: Applied Economics, Vol. 1, No. 4, October 2009, https://www.aeaweb.org/articles?id=10.1257/app.1.4.109.
[33] Bauer and East, op. cit.; Erin Brantley, Drishti Pillai, and Leighton Ku, “Association of Work Requirements With Supplemental Nutrition Assistance Program Participation by Race/Ethnicity and Disability Status, 2013-2017,” JAMA Network Open, Vol. 3, No. 6, June 2020, https://jamanetwork.com/journals/jamanetworkopen/fullarticle/2767673.
[34] Cook and East, op. cit.
[35] Giannella et al., op. cit.
[36] Joseph Llobrera and Lauren Hall, “SNAP Provides Critical Benefits to Workers and Their Families,” CBPP, updated April 28, 2025, https://www.cbpp.org/research/food-assistance/snap-provides-critical-benefits-to-workers-and-their-families.
[37] Gloria Guzman and Melissa Kollar, “Income in the United States: 2023,” U.S. Census Bureau, U.S. Department of Commerce, September 2024, https://www2.census.gov/library/publications/2024/demo/p60-282.pdf.
[38] Unrath, op. cit.
[39] Jason Cook, Elizabeth Cox, and Chloe East, “SNAP Work Requirements, Administrative Burden, and Procedural Denials,” AEA Papers and Proceedings, Vol. 116, May 2026, https://www.aeaweb.org/articles?id=10.1257/pandp.20261086.
[40] Bauer and East, op. cit.
[41] Erin Brantley, Drishti Pillai, and Leighton Ku, “Association of Work Requirements With Supplemental Nutrition Assistance Program Participation by Race/Ethnicity and Disability Status, 2013-2017,” JAMA Network Open, Vol. 3, No. 6, June 2020, https://jamanetwork.com/journals/jamanetworkopen/fullarticle/2767673.
[42] Under the 2025 reconciliation law, households without children under the age of 14 are now subject to the work requirements.
[43] Cook and East, op. cit.