Senate Tax Bill’s Child Tax Credit Increase Provides Only Token Help to Millions of Children in Low-Income Working Families
The recently revised Senate Republican tax bill would increase the maximum Child Tax Credit (CTC) from the current $1,000 to $2,000 per child – up from $1,650 in the prior version — but low-income working families would largely miss out on the increase, just as in the earlier version. Indeed, in revising the proposal, Senate Finance Committee Chair Orrin Hatch increased the cost of the proposal by about $13 billion per year, but did nothing for the millions of low- and moderate-income working families that would get only token help under the prior proposal.
10 million children whose parents work for low pay live in families that would receive a token benefit of $75 or less.Republicans have highlighted the CTC expansion as their plan’s signature benefit for working families. But 10 million children whose parents work for low pay — about 1 in 7 of all U.S. children in working families — live in families that would receive a token benefit of $75 or less from the proposal. Another 16 million children in working families would receive more than $75 but less than the full $1,000-per-child increase in the credit (in most cases, much less). Altogether, well more than 1 in 3 children in low- and moderate-income working families would receive less than the full proposed CTC increase.
Under the Senate Republicans’ proposal, more than 30 percent of children in working families in almost every state would receive less than the full increase. In 15 states, at least 45 percent of these children would get less than the full increase: Alabama, Arizona, Arkansas, Florida, Georgia, Idaho, Louisiana, Mississippi, Nevada, New Mexico, North Carolina, Oklahoma, South Carolina, Tennessee, and Texas.
Senate Republicans’ decision to provide a token or partial increase to these 26 million children is especially striking because they also chose to newly extend the CTC (in whole or in part) to families with higher incomes. Married couples with two children with incomes between $115,000 and $500,000 (and single parent families with incomes between $75,000 and $500,000) would become newly eligible for the full credit.
When House Republicans introduced their similar CTC proposal, some Senate Republicans rightly criticized it for leaving out millions of children in low-income working families. Yet the Senate proposal takes almost the same approach, offering those same families just $75 of help, while proposing to increase the CTC for high-income families even more than the House bill.
The Senate bill would also cut or eliminate the CTC for about 1 million children in low-income immigrant families, nearly all of them Dreamers, creating further economic hardship for this group of families. (See text box.)
And even as the Senate CTC proposal provides token or partial benefits to millions of low- and moderate-income children, it provides large new tax cuts for the wealthiest families and profitable corporations while increasing deficits by $1.5 trillion over the next decade and undermining health coverage for millions of Americans. Congressional Republicans are likely to use rising deficits as an excuse to come back as soon as next year and seek large budget cuts in areas such as Medicaid, food assistance for struggling families, and education. These cuts will be borne heavily by the same families that receive no or only modest benefits from the tax bill, leaving them worse off when the tax cuts and subsequent budget cuts are considered together.
The CTC Proposal in the Senate Tax Bill
The CTC now provides a maximum tax credit of $1,000 per eligible child under age 17. The credit is “partially refundable,” meaning that it is partly, but not entirely, available to families with incomes below a certain level. Specifically, the refundable portion of the CTC is limited to 15 percent of a family’s earnings over $3,000. Thus, a single mother with two children and earnings of $10,000 is eligible for a CTC of $1,050, or $525 per child, rather than for the $2,000 ($1,000 per child) that a middle-income family with two children receives. Because of the credit’s slow phase-in for working families with low incomes, families with two children do not receive the full credit of $1,000 per child until their earnings reach $16,333. The poorest children consequently qualify for only a very small CTC or none at all.
The revised Senate tax plan proposes to increase the maximum CTC to $2,000 per child and make the credit newly available to children under 18, allowing 17-year-olds to qualify. But it only slightly increases the refundability of the existing credit, which would be limited to 15 percent of earnings over $2,500. Moreover, as explained below, the Senate bill limits low-income families’ access to its CTC increase, capping the amount of the credit that is refundable at $1,000, adjusted only for inflation going forward (and rounded to $1,100 in 2018). The maximum refundable amount would not reach $2,000 for three decades. Like nearly all of the individual-level tax provisions in the Senate bill, the CTC expansion would expire after 2025, while the various corporate tax cuts would remain in effect permanently.
While doing virtually nothing to strengthen the CTC for the lowest-income working families, the plan calls for increasing the income levels at which the CTC begins to phase out for higher-income families, thereby making more families with six-figure incomes eligible for the credit.
Millions of Low-Income Working Families Would Be Left Out
To see how the Senate bill’s CTC expansion would affect children in low- and moderate-income working families, consider two examples.
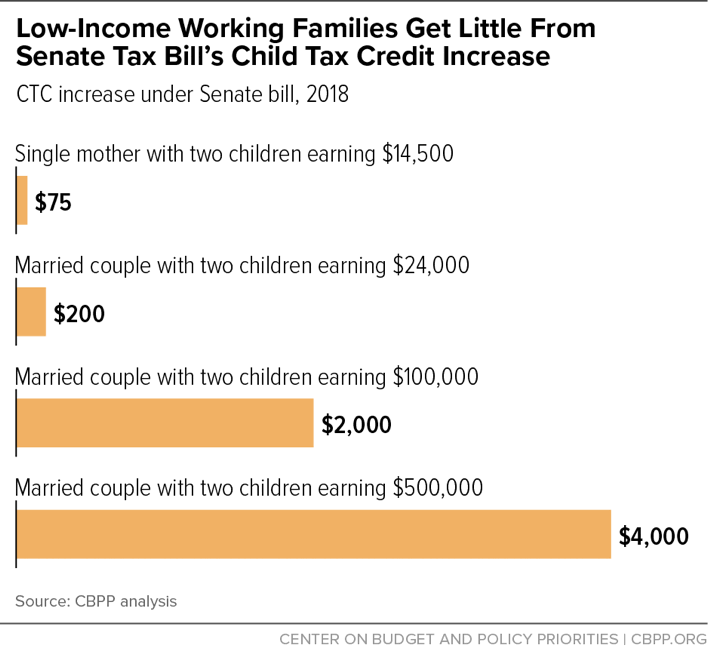
- A single mother with two children working full time as a home health aide at the federal minimum wage earns $14,500. Based on her earnings, her total refundable credit is capped at $1,725, less than the current-law $1,000-per-child credit. Under the Senate bill, her refundable credit would be $1,800, a token increase of just $75.
- A married couple with two children earns $24,000. Based on their earnings, this couple could qualify for a total refundable credit of $3,225, so it would seem they could receive a significant benefit, though less than the $1,000-per-child increase. But because the bill would cap refundability at $1,100 per child in 2018, the family would benefit by only $100 per child ($200 total) next year.
We estimate that 10 million children under 17 in low-income working families (about 1 in 7 of all U.S. children in working families) are in families that would receive $75 or less from the CTC increase, with situations similar to the first example above.[1] Another 16 million children in low-income working families would benefit by more than $75 but less than the full $1,000-per-child increase in the credit; 60 percent of these children are in families that would benefit by less than $400 per child in 2018.[2] In total, 26 million children under 17 in working families — well more than 1 in 3 children in working families — would receive a token or partial CTC increase. This includes:
- 7.5 million children in working-poor families, 1.6 million of whom live in deep poverty (i.e., below half the poverty line);
- 9.7 million children under age 6;
- 9.7 million Latino children, 9.5 million white children, 5.0 million African American children, and 700,000 Asian children; and
- 4.2. million children who live in rural counties, and 22.2 million children in metropolitan ones.[3]
(See Table 1. For detailed methodology and state-by-state estimates of children who would receive token or partial benefit, see the appendix.)
| TABLE 1 | |||
|---|---|---|---|
| Children Under Age 17 in Working Families Left Out of Full CTC Increase in Revised Senate Tax Bill Due to Low Income, in Millions | |||
| Receive only token increase ($75 or less) | Receive more than $75 but less than full increase | Total receiving less than full increase | |
| Latino | 3.7 | 6.0 | 9.7 |
| White (non-Latino) | 3.3 | 6.2 | 9.5 |
| African American (non-Latino) | 2.3 | 2.7 | 5.0 |
| Asian (non-Latino) | 0.2 | 0.5 | 0.7 |
| Other | 0.7 | 0.8 | 1.5 |
| Total | 10.3 | 16.2 | 26.4 |
| Including | |||
| Under age 6 | 3.9 | 5.8 | 9.7 |
| In poverty | 3.8 | 2.5 | 6.3 |
| In deep poverty (below half the poverty line) | 1.1 | 0.2 | 1.2 |
| Living in rural counties | 1.6 | 2.6 | 4.2 |
| Living in metropolitan counties | 8.6 | 13.6 | 22.2 |
The average income of working families with children that would be left out of the full CTC increase is about $25,000. Among these working families, 7 in 10 include at least one parent who works full time for most of the year.[4] The parents in families receiving less than the full credit work in a range of occupations, many of which pay low or modest wages (see Table 2).
| TABLE 2 | ||
|---|---|---|
| Top Occupations of Working Parents Left Out of Full CTC Increase in Revised Senate Tax Bill Due to Low Income | ||
| Number of working parents | ||
| Office and administrative support | 1,540,000 | |
| Sales | 1,467,000 | |
| Food preparation and serving | 1,260,000 | |
| Building and grounds cleaning and maintenance | 1,217,000 | |
| Construction and extraction | 1,199,000 | |
| Transportation and material moving | 1,156,000 | |
| Manufacturing | 1,129,000 | |
| Personal care and service | 993,000 | |
| Health care support | 733,000 | |
As noted, the bill would extend CTC eligibility to children who are 17 years old. More than 1 million 17-year-olds made eligible would get less than the full credit, while about 2.7 million 17-year-olds would qualify for the full credit.
Large Share of Children in Every State Would Receive Token or Partial Benefit
In almost every state, at least 1 in 10 children in working families would receive only token help from the Senate bill’s CTC increase (see Appendix Table 1). And in almost every state, at least 30 percent of children in working families would receive less than the full increase.
But in many states, generally higher-poverty, lower-wage states, a much larger share of children would be left out. In 15 states, at least 45 percent of children in working families would receive less than the Senate bill’s $1,000-per-child CTC increase: Alabama, Arizona, Arkansas, Florida, Georgia, Idaho, Louisiana, Mississippi, Nevada, New Mexico, North Carolina, Oklahoma, South Carolina, Tennessee, and Texas.
Appendix Table 2 shows the number and share of children in working families in each state receiving only a token ($75 or less) increase (due to low income) who live in metropolitan and rural counties. Nationally, 1.6 million children receiving a token increase live in rural counties while 8.6 million live in metropolitan counties. Appendix Table 3 shows the number of children in working families in each state who live in rural and metropolitan counties and receive less than the full $1,000-per-child CTC increase. Nationally, 47 percent of children in working families in rural counties do not get the full benefit, while 40 percent of children in metropolitan counties do not.
Children Left Out Are Those Who Would Benefit the Most
The children who would receive a token or partial increase from the proposed CTC changes are those whose families experience the greatest financial hardship, and those for whom additional help would likely make the most difference in helping make ends meet and creating a more stable environment for children. They are also those for whom, extensive research indicates, a CTC boost could make the most difference over the long run.
- Research indicates that income from the Earned Income Tax Credit (EITC)[5] and the CTC yields benefits for many children at virtually every stage of life.[6] Starting from infancy — when larger refundable tax credits have been linked with more prenatal care, less maternal stress, and signs of better infant health — children who benefit from tax-credit expansions have been found to do better than similar children who don’t benefit. They have higher odds of finishing high school and therefore going on to college, and the added income from the credits has been linked to significant increases in college attendance by making college more affordable for families with high-school seniors. Researchers note that the education and skill gains associated with the EITC and CTC are likely to keep paying off through higher earnings and employment in adulthood.
- Research also shows that income gains from sources that include tax credits matter the most for the poorest children. “[T]here is very strong evidence that increases in income have a bigger impact on outcomes for those at the lower end of the income distribution,” a systematic review of the research literature on the effects of income during childhood, conducted by researchers at the London School of Economics and Political Science, concluded. All 13 of the relevant studies the researchers examined supported this finding[7] One study found, for example, that the EITC’s effect in increasing children’s math and reading test scores was almost three times larger for the lowest quartile of its sample than for other low- and moderate-income families.[8] These findings are consistent with the view of many experts that the adverse effects of poverty on children are most pronounced for children who live below half of the poverty line[9]
Many Families With Six-Figure Incomes Would Be Made Newly Eligible for the Credit or Receive the Largest CTC Increases
While the lowest-income working families would get only a token increase from the CTC proposal in the Senate tax bill, those who earn substantial salaries would qualify for the maximum CTC boost (see Figure 1). Of particular note, the proposal would increase the income level at which the CTC begins to phase out, making more filers with six-figure incomes eligible for the credit.
- Married couples with two children and incomes between $150,000 and $580,000 would become newly eligible for a CTC. (Currently, the CTC phases out at $150,000 for married filers with two children.)
- Married couples with two children and incomes between $115,000 and $500,000 (and single parents with incomes between $75,000 and $500,000) would become newly eligible for the maximum CTC. A married couple with two children with income of $500,000 would receive a $4,000 CTC increase; its CTC would rise from zero today to $4,000 under the plan.
Senate Bill Fails to Fix Fundamental Problems in House CTC Proposal
When House Republicans introduced their CTC proposal, some Senate Republicans rightly criticized it for excluding children in low-income working families.[10] Yet the Senate proposal takes almost the same approach, at least with regard to low- and moderate-income children. Where the House bill leaves out 10 million children in low-income working families, the Senate bill offers those same families a token benefit of at most $75. And in both bills, millions of additional families would receive more than $75 but less than the full CTC increase.[11]
At the same time, the Senate bill goes even further than the House bill in extending the CTC to high-income families. Where the House proposal would make married couples with two children with incomes between $150,000 and $294,000 newly eligible for the credit, the Senate extends eligibility to couples with incomes up to $580,000.
Rubio-Lee Proposal Would Help But Still Fall Short
Republican Senators Marco Rubio and Mike Lee criticized the original Senate CTC proposal for doing too little to help low-income working families — and this new proposal continues to provide only token help to 10 million children.[12] And, in recent days, Senator Rubio has reiterated that the CTC should be strengthened for low-income families.[13]
A proposal from Senators Rubio and Lee, also endorsed by a number of other Republican senators, would more significantly increase the amount of the CTC that would be refundable, in addition to increasing the credit to $2,000 per child.[14] The proposal thus would provide a more meaningful CTC boost — about $500 — to the poorest working families. Even so, those families still would receive only a fraction of the proposed increase in the maximum per-child credit and much smaller increases than those families higher up the income scale.
The Rubio-Lee proposal would change the refundable amount of the CTC to 15.3 percent of a family’s total earnings — that is, it would start phasing in with the first dollar of earnings — instead of the credit equaling 15 percent of earnings over $3,000, as at present. The impact of these changes would be positive but modest. For example, if the Rubio-Lee refundability proposal were added to the House Republican bill, a single parent with two children working full time at the federal minimum wage, earning $14,500 annually, would receive a CTC increase of $494, rather than zero as under the House bill. But this would be only a quarter of the $2,000 CTC increase that two-child families at higher income levels would receive under the Rubio-Lee CTC design.
CTC reforms could be designed to more significantly strengthen the credit for lower-income families. The current CTC could be made fully refundable so families with very low or no earnings could receive the full CTC. A more modest improvement would begin phasing in the credit with the first dollar of earnings, as the Rubio-Lee proposal would do, and raise the phase-in rate significantly above 15 percent, at least for families with a young child, so that working-poor families would receive a more adequate CTC. The amount of the maximum CTC could also be increased further, especially for young children. Children under 6 tend to be poorer than other children, and the research literature is particularly clear that young children would benefit significantly from the additional income that such CTC improvements could provide. These and other CTC improvements are included in bills introduced by Rep. Rosa DeLauro, Senators Sherrod Brown and Michael Bennet, and other lawmakers.[15]
CTC Changes Can’t Overcome Senate Bill’s Larger Problems
Improvements like these would substantially improve the CTC proposal in the Senate tax bill. But they would not alter the two overriding shortcomings in the overall plan — its heavy tilt toward the highest-income households and profitable corporations, and its impact in substantially increasing budget deficits and debt. Rising deficits in turn would lead to increased pressure to make deep budget cuts in areas such as health care, food assistance for struggling families, and education — cuts that would fall heavily on low- and middle-income families and render them net losers, even if the plan’s CTC provisions are strengthened.
Overall, the Senate tax bill is heavily skewed toward high-income households and profitable corporations. In 2021 (before individual tax cuts sunset), filers with annual incomes over $1 million would see tax cuts averaging roughly $57,000, compared to modest tax cuts and tax increases overall for households with earnings of less than $50,000.[16] Even a substantially improved CTC would only modestly mitigate this extreme tilt.
Congressional leaders and the Trump Administration have made clear their plans to seek large budget cuts after the tax bill is completed. Congressional leaders have pointed to existing budget deficits — even before any new tax cuts are enacted — to justify proposed steep cuts in basic assistance programs on which struggling families rely to obtain health care and help make ends meet, as well as cuts in a broad set of programs important to children’s future prospects, such as education and job training. If such cuts were made to offset the cost of the tax cuts, most families with children would likely end up worse, rather than better, off. [17]
Tax Bill’s Child Tax Credit Change Would Hurt 1 Million Children
In addition to largely excluding millions of children from its CTC increase, the Senate tax bill would harm 1 million low-income children in working families by denying them the Child Tax Credit (CTC) because they lack a Social Security Number (SSN).
People who work in the United States must pay taxes on their income, regardless of their immigration status. Immigrant workers lacking an SSN file their income tax return using an ITIN. ITIN filers are generally subject to the same tax rules as other filers and are eligible for the same tax benefits, such as the CTC (including the “refundable” part that goes to those who earn too little to owe federal income tax). The Senate bill, however, would allow filers to claim the refundable CTC only for children who have an SSN rather than an ITIN.
Proponents describe this CTC change as an “anti-abuse” measure. It isn’t: it’s a major eligibility cut for working families who are doing nothing wrong by claiming the credit. Roughly 1 million children, most of them in low-income working families, would lose eligibility for the CTC, based on data from the Pew Hispanic Center. These children are overwhelmingly Dreamers — undocumented children who were brought to the United States by their immigrant parents. Their parents use the credit to help feed their families and keep a roof over their heads, and it goes only to working families, including many in which the parents work in tough jobs that often lack basic protections that most other workers take for granted. Many of these individuals pick crops, clean houses and offices, or care for other Americans’ children or grandparents.
The children who would lose the tax credit will continue to be part of our communities and the economy as adults. All Americans thus have a stake in ensuring that these children get the resources they need to become productive workers. Taking the CTC’s income away from poor children would not only increase poverty and hardship immediately, but would also affect school performance and make it less likely that these children will finish high school and go on to college, recent research indicates.a The CTC changes thus could increase poverty both today and in the future.
The IRS is already acting to prevent error and fraud concerning ITINs and the CTC, and Congress took action as well. But the CTC provision in the House bill isn’t designed to strengthen tax compliance. It’s an attempt to deny the credit to 1 million children in immigrant families.
a Arloc Sherman and Tazra Mitchell, “Economic Security Programs Help Low-Income Children Succeed Over Long Term, Many Studies Find,” Center on Budget and Policy Priorities, July 17, 2017, https://www.cbpp.org/research/poverty-and-inequality/economic-security-programs-help-low-income-children-succeed-over.
| APPENDIX TABLE 1 | ||||||
|---|---|---|---|---|---|---|
| Children Under 17 in Working Families Left Out of Full Child Tax Credit Increase in Senate Tax Bill Due to Low Income, by State | ||||||
| Receive only token increase ($75 or less) | Receive more than $75 but less than full increase | Total receiving less than full increase | ||||
| Number | Percent | Number | Percent | Number | Percent | |
| US Total | 10.3 million | 16 | 16.2 million | 25 | 26.4 million | 41 |
| Alabama | 181,000 | 19 | 249,000 | 27 | 430,000 | 46 |
| Alaska | 22,000 | 13 | 32,000 | 19 | 54,000 | 32 |
| Arizona | 264,000 | 19 | 399,000 | 29 | 663,000 | 48 |
| Arkansas | 119,000 | 20 | 185,000 | 31 | 305,000 | 51 |
| California | 1,336,000 | 17 | 2,162,000 | 27 | 3,498,000 | 44 |
| Colorado | 134,000 | 12 | 267,000 | 24 | 400,000 | 36 |
| Connecticut | 67,000 | 10 | 119,000 | 18 | 186,000 | 27 |
| Delaware | 29,000 | 16 | 39,000 | 22 | 68,000 | 38 |
| Dist. of Columbia | 14,000 | 16 | 21,000 | 23 | 35,000 | 39 |
| Florida | 586,000 | 17 | 1,039,000 | 30 | 1,625,000 | 47 |
| Georgia | 422,000 | 20 | 576,000 | 27 | 998,000 | 46 |
| Hawaii | 31,000 | 11 | 65,000 | 23 | 96,000 | 35 |
| Idaho | 56,000 | 15 | 123,000 | 32 | 179,000 | 46 |
| Illinois | 388,000 | 15 | 621,000 | 24 | 1,008,000 | 38 |
| Indiana | 230,000 | 17 | 361,000 | 26 | 591,000 | 43 |
| Iowa | 86,000 | 13 | 147,000 | 23 | 233,000 | 36 |
| Kansas | 90,000 | 14 | 166,000 | 26 | 256,000 | 40 |
| Kentucky | 150,000 | 18 | 217,000 | 26 | 367,000 | 43 |
| Louisiana | 194,000 | 21 | 241,000 | 26 | 435,000 | 46 |
| Maine | 29,000 | 13 | 55,000 | 25 | 85,000 | 38 |
| Maryland | 129,000 | 11 | 231,000 | 19 | 360,000 | 30 |
| Massachusetts | 121,000 | 10 | 196,000 | 16 | 317,000 | 26 |
| Michigan | 325,000 | 17 | 452,000 | 24 | 777,000 | 41 |
| Minnesota | 134,000 | 12 | 229,000 | 20 | 364,000 | 31 |
| Mississippi | 133,000 | 22 | 178,000 | 30 | 311,000 | 52 |
| Missouri | 198,000 | 16 | 299,000 | 25 | 497,000 | 41 |
| Montana | 31,000 | 16 | 47,000 | 24 | 79,000 | 40 |
| Nebraska | 61,000 | 14 | 104,000 | 24 | 164,000 | 39 |
| Nevada | 98,000 | 17 | 181,000 | 31 | 279,000 | 48 |
| New Hampshire | 20,000 | 8 | 42,000 | 17 | 62,000 | 26 |
| New Jersey | 209,000 | 12 | 330,000 | 19 | 538,000 | 30 |
| New Mexico | 91,000 | 21 | 131,000 | 31 | 222,000 | 53 |
| New York | 569,000 | 16 | 842,000 | 23 | 1,411,000 | 39 |
| North Carolina | 355,000 | 18 | 557,000 | 28 | 911,000 | 46 |
| North Dakota | 17,000 | 11 | 27,000 | 18 | 44,000 | 29 |
| Ohio | 389,000 | 17 | 542,000 | 24 | 931,000 | 41 |
| Oklahoma | 142,000 | 17 | 246,000 | 30 | 388,000 | 47 |
| Oregon | 125,000 | 17 | 195,000 | 26 | 320,000 | 42 |
| Pennsylvania | 313,000 | 14 | 517,000 | 22 | 830,000 | 36 |
| Rhode Island | 24,000 | 13 | 42,000 | 23 | 65,000 | 36 |
| South Carolina | 176,000 | 19 | 252,000 | 27 | 428,000 | 47 |
| South Dakota | 24,000 | 13 | 46,000 | 24 | 70,000 | 37 |
| Tennessee | 248,000 | 19 | 346,000 | 27 | 594,000 | 47 |
| Texas | 1,184,000 | 19 | 1,759,000 | 28 | 2,943,000 | 47 |
| Utah | 99,000 | 12 | 217,000 | 26 | 317,000 | 38 |
| Vermont | 12,000 | 12 | 21,000 | 20 | 34,000 | 32 |
| Virginia | 194,000 | 12 | 339,000 | 21 | 534,000 | 32 |
| Washington | 179,000 | 13 | 332,000 | 24 | 510,000 | 36 |
| West Virginia | 57,000 | 18 | 81,000 | 26 | 138,000 | 44 |
| Wisconsin | 158,000 | 14 | 260,000 | 22 | 418,000 | 36 |
| Wyoming | 13,000 | 11 | 27,000 | 21 | 40,000 | 32 |
| APPENDIX TABLE 2 | ||||
|---|---|---|---|---|
| Children Under 17 in Working Families Receiving Only a Token Child Tax Credit Increase ($75 Or Less) Under Senate Tax Bill, by Metropolitan and Rural Counties | ||||
| Living in Metropolitan Counties | Living in Rural Counties | |||
| Number | Percent | Number | Percent | |
| US Total | 8.6 million | 16 | 1.6 million | 18 |
| Alabama | 134,000 | 19 | 47,000 | 22 |
| Alaska | 11,000 | 10 | 11,000 | 20 |
| Arizona | 243,000 | 18 | 21,000 | 29 |
| Arkansas | 66,000 | 17 | 54,000 | 25 |
| California | 1,314,000 | 17 | 22,000 | 16 |
| Colorado | 113,000 | 11 | 20,000 | 16 |
| Connecticut | 65,000 | 10 | (b) | (b) |
| Delaware | 29,000 | 16 | (a) | (a) |
| Dist. of Columbia | 14,000 | 16 | (a) | (a) |
| Florida | 559,000 | 17 | 27,000 | 23 |
| Georgia | 340,000 | 19 | 81,000 | 24 |
| Hawaii | 24,000 | 11 | 7,000 | 15 |
| Idaho | 35,000 | 14 | 21,000 | 17 |
| Illinois | 344,000 | 15 | 44,000 | 15 |
| Indiana | 183,000 | 17 | 47,000 | 15 |
| Iowa | 52,000 | 13 | 34,000 | 13 |
| Kansas | 61,000 | 14 | 29,000 | 14 |
| Kentucky | 85,000 | 16 | 64,000 | 20 |
| Louisiana | 156,000 | 20 | 38,000 | 25 |
| Maine | 16,000 | 12 | 13,000 | 15 |
| Maryland | 124,000 | 11 | 5,000 | 18 |
| Massachusetts | 120,000 | 10 | (b) | (b) |
| Michigan | 267,000 | 17 | 58,000 | 18 |
| Minnesota | 101,000 | 11 | 34,000 | 13 |
| Mississippi | 57,000 | 20 | 76,000 | 25 |
| Missouri | 135,000 | 15 | 63,000 | 21 |
| Montana | 13,000 | 18 | 19,000 | 15 |
| Nebraska | 41,000 | 15 | 20,000 | 14 |
| Nevada | 91,000 | 17 | 7,000 | 13 |
| New Hampshire | 11,000 | 7 | 9,000 | 11 |
| New Jersey | 209,000 | 12 | (a) | (a) |
| New Mexico | 57,000 | 20 | 34,000 | 24 |
| New York | 528,000 | 16 | 41,000 | 17 |
| North Carolina | 267,000 | 17 | 87,000 | 22 |
| North Dakota | 7,000 | 10 | 10,000 | 13 |
| Ohio | 301,000 | 17 | 87,000 | 19 |
| Oklahoma | 94,000 | 17 | 48,000 | 18 |
| Oregon | 102,000 | 16 | 23,000 | 20 |
| Pennsylvania | 275,000 | 13 | 38,000 | 15 |
| Rhode Island | 24,000 | 13 | (a) | (a) |
| South Carolina | 143,000 | 18 | 33,000 | 25 |
| South Dakota | 10,000 | 11 | 14,000 | 14 |
| Tennessee | 192,000 | 19 | 56,000 | 20 |
| Texas | 1,048,000 | 19 | 136,000 | 21 |
| Utah | 88,000 | 12 | 11,000 | 12 |
| Vermont | (b) | (b) | 9,000 | 13 |
| Virginia | 162,000 | 11 | 32,000 | 18 |
| Washington | 157,000 | 12 | 22,000 | 17 |
| West Virginia | 34,000 | 17 | 23,000 | 20 |
| Wisconsin | 121,000 | 14 | 37,000 | 13 |
| Wyoming | (b) | (b) | 10,000 | 11 |
| APPENDIX TABLE 3 | ||||
|---|---|---|---|---|
| Children Under 17 in Working Families Receiving Less Than the Full Child Tax Credit Increase Under Senate Bill, by Metropolitan and Rural Counties | ||||
| Living in Metropolitan Counties | Living in Rural Counties | |||
| Number | Percent | Number | Percent | |
| US Total | 22.2 million | 40 | 4.2 million | 47 |
| Alabama | 318,000 | 44 | 113,000 | 53 |
| Alaska | 31,000 | 28 | 23,000 | 40 |
| Arizona | 617,000 | 47 | 46,000 | 63 |
| Arkansas | 178,000 | 47 | 126,000 | 58 |
| California | 3,433,000 | 44 | 66,000 | 48 |
| Colorado | 341,000 | 34 | 59,000 | 45 |
| Connecticut | 179,000 | 28 | 6,000 | 20 |
| Delaware | 68,000 | 38 | (a) | (a) |
| Dist. of Columbia | 35,000 | 39 | (a) | (a) |
| Florida | 1,557,000 | 46 | 68,000 | 57 |
| Georgia | 811,000 | 45 | 186,000 | 54 |
| Hawaii | 74,000 | 33 | 22,000 | 43 |
| Idaho | 113,000 | 44 | 66,000 | 51 |
| Illinois | 889,000 | 38 | 119,000 | 42 |
| Indiana | 456,000 | 42 | 135,000 | 44 |
| Iowa | 131,000 | 34 | 102,000 | 38 |
| Kansas | 166,000 | 38 | 90,000 | 44 |
| Kentucky | 211,000 | 41 | 156,000 | 48 |
| Louisiana | 354,000 | 45 | 81,000 | 52 |
| Maine | 45,000 | 33 | 40,000 | 45 |
| Maryland | 350,000 | 30 | 11,000 | 39 |
| Massachusetts | 314,000 | 26 | 3,000 | 26 |
| Michigan | 624,000 | 39 | 153,000 | 48 |
| Minnesota | 269,000 | 30 | 95,000 | 37 |
| Mississippi | 137,000 | 48 | 174,000 | 56 |
| Missouri | 338,000 | 37 | 159,000 | 53 |
| Montana | 30,000 | 42 | 49,000 | 39 |
| Nebraska | 102,000 | 37 | 62,000 | 42 |
| Nevada | 258,000 | 48 | 22,000 | 41 |
| New Hampshire | 36,000 | 23 | 26,000 | 32 |
| New Jersey | 538,000 | 30 | (a) | (a) |
| New Mexico | 145,000 | 52 | 78,000 | 54 |
| New York | 1,308,000 | 39 | 103,000 | 43 |
| North Carolina | 691,000 | 44 | 220,000 | 55 |
| North Dakota | 19,000 | 26 | 25,000 | 32 |
| Ohio | 715,000 | 40 | 216,000 | 46 |
| Oklahoma | 259,000 | 46 | 129,000 | 49 |
| Oregon | 258,000 | 40 | 62,000 | 53 |
| Pennsylvania | 720,000 | 35 | 110,000 | 43 |
| Rhode Island | 65,000 | 36 | (a) | (a) |
| South Carolina | 353,000 | 45 | 75,000 | 57 |
| South Dakota | 30,000 | 34 | 40,000 | 40 |
| Tennessee | 451,000 | 45 | 143,000 | 52 |
| Texas | 2,610,000 | 46 | 333,000 | 52 |
| Utah | 281,000 | 38 | 36,000 | 42 |
| Vermont | 10,000 | 27 | 24,000 | 35 |
| Virginia | 453,000 | 31 | 81,000 | 45 |
| Washington | 446,000 | 35 | 65,000 | 50 |
| West Virginia | 82,000 | 42 | 56,000 | 48 |
| Wisconsin | 309,000 | 35 | 109,000 | 38 |
| Wyoming | 11,000 | 30 | 29,000 | 32 |
Technical Appendix
This analysis examines families (that is, tax filing units), children, and parents left behind by the Child Tax Credit (CTC) proposal introduced by Senate Republicans in November 2017.[18] We assess the CTC proposal (namely, increasing the maximum credit to $2,000 per child, while decreasing the earnings threshold to $2,500 and limiting the refundable portion to $1,100 per child in 2018) alone, without regard to the bill’s other tax changes.[19]
The analysis is based on data from the Tax Policy Center (TPC) and the Census Bureau. CBPP used TPC data for the nationwide number of working families and children who would receive $75 or less from the CTC expansion.[20] We used the Census Bureau’s March 2017 Current Population Survey (CPS) public-use file to estimate the nationwide number of children in working families that would receive more than $75 but whose incomes are too low to receive the full credit of $2,000 per child.[21] Family incomes (and corresponding tax liabilities) are adjusted for inflation to approximate 2018 levels. Children age 17, who are newly eligible for the credit under the proposal, are accounted for when estimating their family’s benefit, but are not included in counts of children receiving less than the full increase.
Characteristics of the children receiving less than the full benefit are estimated using the CPS-based share of children left out in each demographic group, applied to the national totals. Those that would receive only a token increase and those that would receive more than $75 but less than the full credit of $2,000 per child are calculated separately.
Numbers and characteristics of working parents are estimated using CPS-based average numbers of parents per 100 left-out families, applied to the national family totals.[22] (Again, those that would receive only a token increase and those that would receive more than $75 but less than the full credit of $2,000 per child are calculated separately.)
For state-by-state figures, CBPP used public-use files from the larger American Community Survey for 2013 through 2015. We averaged three years of ACS data to further increase the reliability of the state estimates. We used the ACS data to assign each state its estimated share of TPC’s total 10.3 million children in working families with earnings too low to receive more than $75 from the proposal[23] and the CPS-based total 16.2 million children in working families receiving more than $75 but less than the maximum credit. [24]
In the state tables, totals for children in working families include children under age 17 (the age eligible for the CTC) in tax filing units in which the filer or spouse worked one or more weeks. Elsewhere in this analysis, “working” generally refers to tax units with earnings.
End Notes
[1] CBPP estimates based on March 2017 Current Population Survey data and Tax Policy Center table T17-0228. For additional details, see the Appendix.
[2] The amount by which many of these families could benefit would increase gradually over time, because the maximum refundable credit would be indexed for inflation. However, the amount of the credit that would be refundable would not reach $2,000 until after 2048.
[3] “Rural counties” refers to children who live outside of metropolitan statistical areas, as defined by the Office of Management and Budget. Each county is defined as either in a metropolitan area or as a non-metropolitan (rural) county.
[4] These parents work 35 or more hours per week, in accordance with the Bureau of Labor Statistics definition of full time, and at least 27 weeks of the year.
[5] The EITC is older and more studied than the CTC, but the CTC, like the EITC, is available only to working families and phases in as earnings rise.
[6] For an extended discussion of the research, see Chuck Marr et al., “EITC and Child Tax Credit Promote Work, Reduce Poverty, and Support Children’s Development, Research Finds,” Center on Budget and Policy Priorities, updated October 1, 2015, https://www.cbpp.org/research/federal-tax/eitc-and-child-tax-credit-promote-work-reduce-poverty-and-support-childrens.
[7] Kerris Cooper and Kitty Stewart, “Does money affect children’s outcomes?,” Joseph Rowntree Foundation, October 22, 2013, https://www.jrf.org.uk/report/does-money-affect-children%E2%80%99s-outcomes.
[8] Gordon B. Dahl and Lance Lochner, “The Impact of Family Income on Child Achievement: Evidence from the Earned Income Tax Credit,” American Economic Review 102, No. 5, May 2012, 1927-56. The lowest quartile consisted of families earning less than $18,031 (in 2000 dollars). The middle two quartiles consisted of families earning between $18,031 and $41,790, while the fourth quartile included families earning more than $41,790.
[9] Jeanne Brooks-Gunn and Greg J. Duncan, “The Effects of Poverty on Children,” The Future of Children, Vol. 7, No. 2, Summer/Fall 1997.
[10] See for example Marco Rubio, “We’re Not Supporting Legislation That Doesn’t Cut Taxes for Working Families with Children,” Sunshine State News, November 1, 2017, http://sunshinestatenews.com/story/were-not-supporting-legislation-doesnt-cut-taxes-working-families-children.
[11] For an analysis of the House CTC proposal, see Chuck Marr, Chye-Ching Huang, Arloc Sherman, and Emily Horton, “House Tax Bill’s Child Tax Credit Increase Excludes Thousands of Children in Low-Income Working Families in Every State,” Center on Budget and Policy Priorities, November 9, 2017, https://www.cbpp.org/research/federal-tax/house-tax-bills-child-tax-credit-increase-excludes-thousands-of-children-in-low.
[12] Senator Marco Rubio, “Rubio, Lee Statement on Senate Republican Tax Reform Bill,” November 9, 2017, https://www.rubio.senate.gov/public/index.cfm/press-releases?id=1E0BB0EB-5E7D-4682-B0E2-339B8C592F5D.
[13] Senator Marco Rubio, “Disrespectful & wrong to argue that lower income workers don’t pay taxes. #ChildTaxCredit should apply to payroll tax not just income tax,” Twitter, November 16, 2017, https://twitter.com/marcorubio/status/931136557246971904.
[14] Nancy Cook, “Ivanka Trump Pitches Conservatives on Child Tax Credit,” Politico, September 6, 2017, http://www.politico.com/story/2017/09/06/ivanka-trump-child-tax-credit-conservatives-242400.
[15] Rep. Rosa DeLauro introduced legislation (H.R. 821) that would eliminate the CTC’s $3,000 earnings threshold, allowing the credit to phase in from the first dollar of earnings, and increase the phase-in rate to 45 percent for all families. The DeLauro proposal would also increase the maximum credit to $3,600 for children under age 6. Senators Sherrod Brown and Michael Bennet have introduced legislation that would increase the maximum CTC to $3,000 per child under 19 ($3,600 for children under age 6) and make the credit fully refundable for all families (S. 2018). Another proposal would create a supplement of $1,000 per child under age 5 that phases in at a rate of 50 percent from the first dollar of earnings. See Elaine Maag and Julie B. Isaacs, “Analysis of a Young Child Tax Credit,” Tax Policy Center, September 12, 2017, http://www.taxpolicycenter.org/publications/analysis-young-child-tax-credit.
[16] CBPP calculations based on data from the Joint Committee on Taxation and Tax Policy Center T17-0061.
[17] Sharon Parrott, “Commentary: Republican Tax and Budget Agenda Would Leave Most Low- and Middle- Income Children Worse Off,” Center on Budget and Policy Priorities, October 4, 2017, https://www.cbpp.org/federal-tax/commentary-republican-tax-and-budget-agenda-would-leave-most-low-and-middle-income.
[18] Joint Committee on Taxation, “Description of the Chairman’s Modification to the Chairman’s Mark of the ‘Tax Cuts and Jobs Act,’” November 14, 2017, https://www.jct.gov/publications.html?func=startdown&id=5037.
[19] The CTC proposal also increases the income levels at which the credit begins phasing out with inflation, allowing higher-income families to newly claim the credit or claim a larger credit.
[20] TPC estimates the number of working families (and children in those families) with earnings too low to qualify for any CTC and with earnings too low to qualify for the full CTC, excluding families with no earnings. These two groups combined approximate the number of working families that would receive only token assistance from the Senate CTC proposal. See http://www.taxpolicycenter.org/model-estimates/distribution-amount-child-tax-credit-october-2017/t17-0228-distribution-tax-units.
[21] The surveys do not ask families directly about taxes. Our tax calculations in the CPS rely on large part on Census Bureau estimates of surveyed individuals’ adjusted gross income, taxable income, federal income tax owed, and dependency relationships included on the CPS file.
[22] Averages (including average numbers of working parents by occupation) are applied to national totals of families receiving less than $75 (5.1 million, from TPC) and receiving more than $75 but less than the full $2,000 credit per child credit (8.2 million, from CBPP analysis of CPS data).
[23] We use the ACS to estimate each state’s share of children in families receiving less than $75, and multiply this share by the TPC total. The ACS estimate (10.2 million nationally) is quite similar to the TPC-based estimate (10.3 million).
[24] The ACS-based estimate of children receiving more than $75 but less than the full increase (16.4 million) is quite similar to the CPS estimate (16.2 million).
More from the Authors

Areas of Expertise

Areas of Expertise


Areas of Expertise

Areas of Expertise