Funding for Housing, Health, and Social Services Block Grants Has Fallen Markedly Over Time
See https://www.cbpp.org/research/federal-budget/block-granting-low-income-programs-leads-to-large-funding-declines-over-time for a more recent version of this analysis.
Funding for housing, health, and social services block grants has fallen significantly over time, an examination of several decades of budget data demonstrates. These data provide a cautionary tale for proposals to merge large numbers of additional programs — especially programs serving families and individuals who are low income or otherwise vulnerable — into block grants, as would occur, for example, under a proposal that House Speaker Paul Ryan made in 2014 to merge 11 low-income programs into a mega-block grant in an unspecified number of states. The Ryan proposal, congressional conservatives’ most recent proposal for major changes to the safety net, will likely influence the new House Republican Task Force on Poverty, Opportunity, and Upward Mobility.
Policymakers advancing these proposals often accompany them, as Speaker Ryan did, with assurances that the new block grant would get the same overall amount of funding as currently goes to the individual programs that it would replace. This new analysis of several decades of budget data strongly suggests, however, that even if a new block grant’s funding in its initial year matched the prior funding for the programs merged into the block grant, the initial level likely wouldn’t be sustained. History shows that when social programs are merged into (or created as) broad block grants, funding typically contracts — often sharply — in subsequent years and decades, with the reductions growing over time.
Budget Data Show Dramatic Funding Decline
Table 1 details current and historic funding for all 13 of the major housing, health, and social services block-grant programs created in recent decades. (The programs selected are those contained in a Congressional Research Service [CRS] compilation of block grant programs.[1]) This CBPP analysis is a comprehensive examination of funding levels for all housing, health, and social services block-grant programs with annual funding over $100 million.
Funding for 11 of the 13 programs has shrunk in inflation-adjusted terms since their inception, in some cases dramatically. (In this paper, all figures are for fiscal years and are adjusted for inflation unless indicated otherwise.) For the 13 block grants, the median funding change between its inception and 2016 is a decline of about one-quarter, or 26 percent. For four of the block grants, funding plunged by significantly more than half. For example, funding for the job training block grant, focused on improving employment and earnings prospects, has fallen by 69 percent since its adoption in 1982.
Table 1 also shows the funding change for each of the 13 block grants since a common point in time, the year 2000. Their combined funding declined by 26 percent[2] — or $13 billion in 2016 dollars — from 2000 to 2016.
Only the Child Care and Development Block Grant and the Community Mental Health Services Block Grant have grown both since inception (in 1991 and 1994, respectively) and since 2000, and even they have shrunk since 2002. After rising significantly from 2000 to 2002, funding for these two block grants has since fallen by 13 percent and 12 percent, respectively.
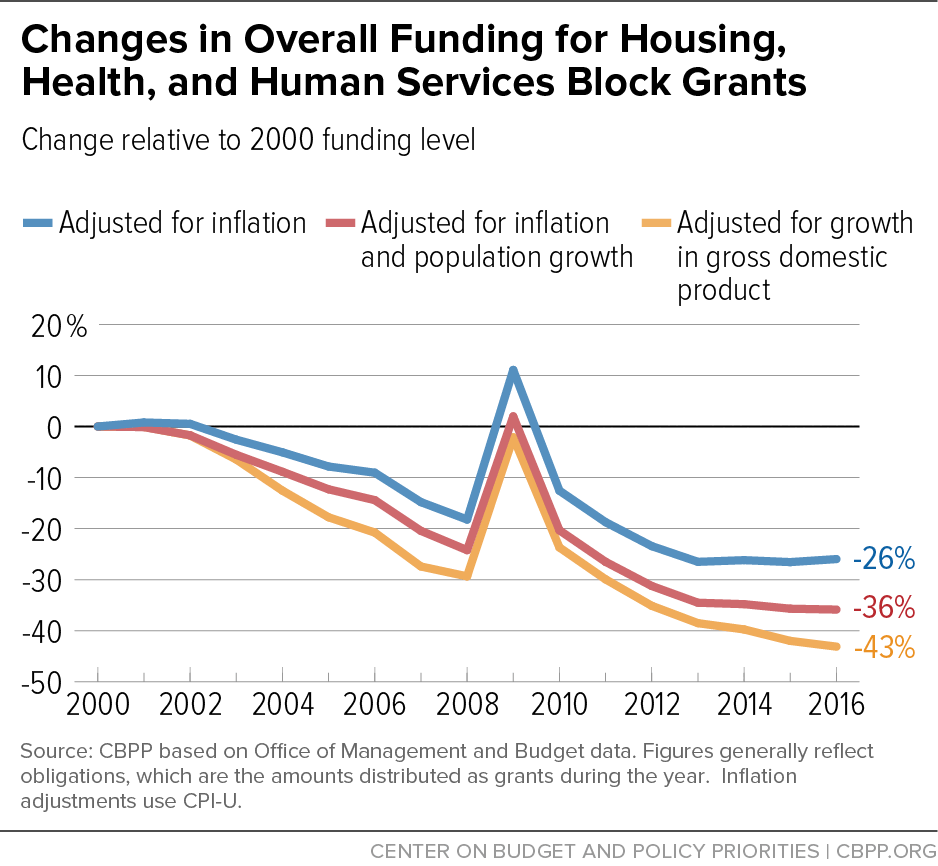
These inflation-adjusted figures, moreover, significantly understate the erosion in these programs relative to need. The overall U.S. population has grown by 15 percent since 2000. As a consequence, overall funding for the 13 block grants has fallen by 36 percent since then, when adjusted for population growth as well as inflation. The number of Americans living in poverty rose as well over this period. In addition, costs in some areas such as rental housing have risen faster than the general inflation rate.[3] (The Appendix table details how individual programs have fared, adjusting for population and inflation, and the Appendix figure displays how total block grant spending has changed over time, under alternative adjustments.)
These large funding declines understate the drop in funding for these services in another way as well: states often substitute some federal block-grant dollars for state dollars they previously spent in these areas and then use the freed-up state dollars for unrelated purposes or to plug state budget holes, thereby shrinking the total pool of federal plus state resources used for these services. For example, the Government Accountability Office has documented such substitution under the Temporary Assistance for Needy Families (TANF) block grant. This substitution effect can be especially significant for block grants under which states can use the block-grant funds for a broad array of purposes.[4]
| TABLE 1 | ||||
|---|---|---|---|---|
| Funding for Many Major Block Grants Has Fallen Over Time | ||||
| Program | Year of inception | Obligations in 2016 (in millions of dollars) | % change since 2000* | % change since inception* |
| HOME Investment Partnership Program | 1992 | $1,032 | -55% | -57% |
| Community Development Block Grant | 1982 | 3,000 | -49% | -63% |
| Job Training Formula Grants to States (Youth, Adult, and Dislocated Workers) | 1982 | 2,710 | -44% | -69% |
| Social Services Block Grant | 1982 | 1,584 | -36% | -73% |
| Maternal and Child Health Block Grant | 1982 | 638 | -36% | -29% |
| Temporary Assistance for Needy Families (TANF) block grant | 1998 | 16,486 | -29% | -32% |
| Native American Housing Block Grant | 1998 | 642 | -26% | -26% |
| Substance Abuse Prevention and Treatment Block Grant | 1994 | 1,779 | -21% | -5% |
| Preventive Health and Health Services Block Grant | 1982 | 160 | -15% | -19% |
| Community Services Block Grant | 1982 | 715 | -2% | -13% |
| Community Mental Health Services Block Grant | 1994 | 512 | 3% | 10% |
| Child Care and Development Block Grant (discretionary and mandatory components) | 1991 | 5,591 | 14% | 343% |
| Low Income Home Energy Assistance Block Grant | 1982 | 3,390 | 31% | -25% |
| Total | $38,238 | -26% | ||
Declining Funding for TANF and Housing Block Grants Underscores Concerns
The largest block grant discussed here is TANF. Congress replaced the Aid to Families with Dependent Children program (AFDC), which was not a block grant, with TANF in 1996. TANF’s annual funding has remained essentially unchanged in nominal terms since then. After adjusting for inflation, federal TANF funding has fallen by 32 percent, even as the U.S. population has grown.
Partly for this reason, TANF today provides substantially less protection against poverty than AFDC did. In 1996, for every 100 poor families with children, 68 families received AFDC cash assistance. By 1998, TANF’s first full year of implementation, this ratio had fallen to 51. By 2014, only 23 families with children received TANF cash assistance benefits for every 100 poor families. (This decline reflects not only the erosion of TANF funding but also state actions to shift TANF funds to other purposes. In 2014, states used only 26 percent of federal and state TANF funds for cash assistance to low-income families and only half of TANF funds for cash assistance, work programs or activities, or child care, as states diverted TANF funds to a wide array of other uses.)[5]
Block grants for low-income housing programs provide another example. As Table 1 shows, funding for the three housing-related block grants established in recent decades has fallen substantially. Since 2000, funding for the HOME Investment Partnership Program and the Native American Housing Block Grant has fallen by 55 percent and 26 percent, respectively. Funding for the Community Development Block Grant (CDBG) program, which supports housing and other community development purposes, has dropped 49 percent over the same period.[6]
Revenue Sharing Program Started Strong — and Then Was Zeroed Out
General Revenue Sharing is not on the list of block grants examined here because the money it distributed to states and local jurisdictions was not restricted to housing, health, or social services. In some respects, however, it was the purest block grant ever established. As its name implies, the program shared federal revenue with states and localities, and the funds were provided in quarterly lump sums with extraordinarily few restrictions on how they could be used. The program started in 1972 with robust funding of $27.5 billion, in 2016 dollars. Congress eliminated the grants to states in 1980 and eliminated the remainder of the program in 1986.
Year-by-Year Analysis Shows Falling Funding Since 2000
A year-by-year analysis of funding for these block grants since 2000 shows that overall funding for the 13 health, housing, and social services block grants deteriorated or remained stagnant in virtually every year (see Figure 1).[7] In 2016, combined funding for these block grants was near its lowest level during this period, $13 billion below the 2000 level adjusted for inflation. Adjusted for inflation and population, combined block grant funding in 2015 and 2016 tied for the lowest level during this period.
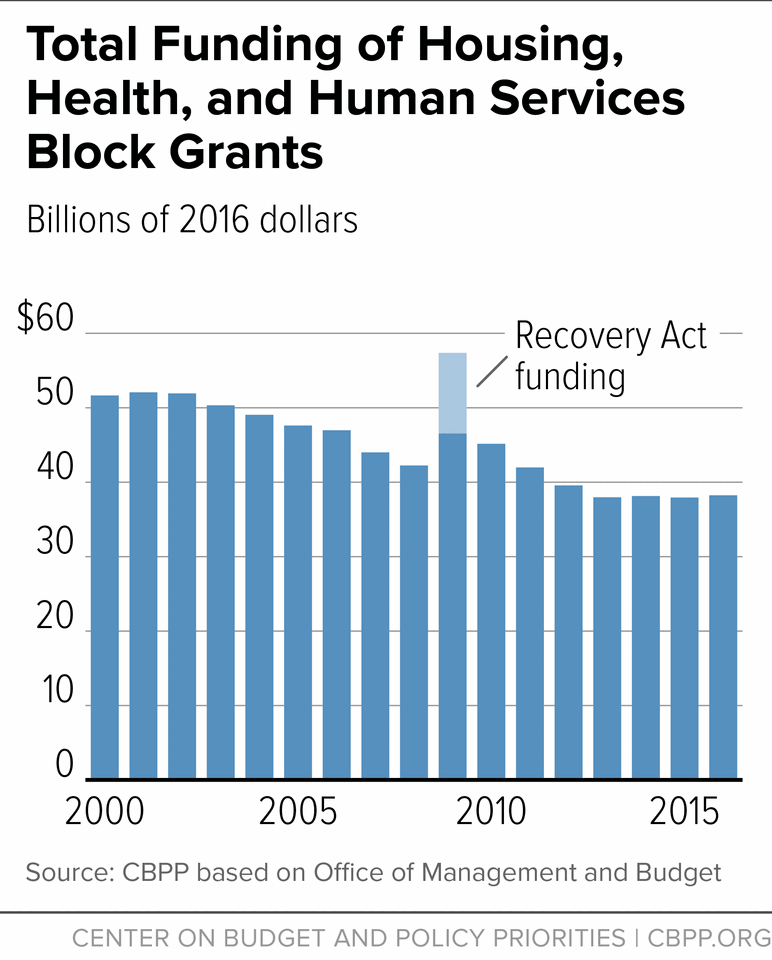
Total funding for the block grants rose significantly in just one of the last 15 years: 2009. Some of this increase reflected a boost in the Low Income Home Energy Assistance Program in response to a sharp rise in energy prices in the summer of 2008, but most was due to funding boosts for several block grants in the 2009 Recovery Act (ARRA), as part of the response to the Great Recession. Policymakers intended ARRA to be temporary — to counter the recession and ameliorate its effects — and declines in block-grant funding then quickly resumed.
Putting the one-time ARRA funding increases aside, a detailed examination shows the trend of funding-level deterioration. Overall funding for the block-grant programs remained essentially unchanged from 2000 to 2002 despite the 2001 recession and then declined steadily through 2008. After rising significantly in 2009, funding fell off rather sharply in 2010, even though the economy continued to struggle and need for many of these programs remained elevated.
The marked deterioration in block-grant funding over time controverts the common claim by block grant proponents that if funding levels prove inadequate, Congress will step in to provide appropriate additional funding. The general lack of responsiveness of block-grant funding to changes in need contrasts sharply with the high degree of responsiveness of entitlement programs such as SNAP (formerly known as the Food Stamp Program). Programs like SNAP grow immediately and automatically when need rises; this is critically important during recessions. This directly helps people hit by the downturn and also, by restraining the drop in consumer purchasing power, moderates the severity of the recession. Programs like SNAP would lose this responsiveness if merged into block grants.
Funding Erosion Is Intrinsic to the Block Grant Structure
Block grants’ basic structure makes them especially vulnerable to funding reductions over time. Block grants generally give state and local governments very broad flexibility over their use of federal funds. As a result, the funds are used in diffuse ways and their impact is hard to document. Often, it is difficult even to track in detail how the money is used. That, in turn, makes it easier for policymakers seeking resources for their own priorities to look to block grants for savings, and has made block grants particularly vulnerable to funding freezes for years on end. It should come as no surprise that block grants in general have fared very poorly in the competition for resources.
Policymakers should keep this in mind when considering new block-grant proposals and claims that merging programs into broad block grants will improve results for the families the programs serve. Experience suggests, to the contrary, that the most predictable result of merging social programs into broad block grants is substantial erosion in funding over time, with negative consequences for efforts to assist people in need.
| APPENDIX TABLE 1 | ||||
|---|---|---|---|---|
| Funding for Major Block Grants Over Time, Adjusted for Inflation and Population Growth | ||||
| Program | Year of inception | Obligations in 2016 (in millions of dollars) | % cut since 2000* | % cut since inception* |
| HOME Investment Partnership Program | 1992 | $1,032 | -61% | -66% |
| Community Development Block Grant | 1982 | 3,000 | -56% | -74% |
| Job Training Formula Grants to States (Youth, Adult, and Dislocated Workers) | 1982 | 2,710 | -52% | -78% |
| Social Services Block Grant | 1982 | 1,584 | -45% | -81% |
| Maternal and Child Health Block Grant | 1982 | 638 | -44% | -50% |
| Temporary Assistance for Needy Families (TANF) block grant | 1998 | 16,486 | -38% | -43% |
| Native American Housing Block Grant | 1998 | 642 | -36% | -38% |
| Substance Abuse Prevention and Treatment Block Grant | 1994 | 1,779 | -31% | -23% |
| Preventive Health and Health Services Block Grant | 1982 | 160 | -27% | -42% |
| Community Services Block Grant | 1982 | 715 | -15% | -38% |
| Community Mental Health Services Block Grant | 1994 | 512 | -11% | -11% |
| Child Care and Development Block Grant (discretionary and mandatory components) | 1991 | 5,591 | -1% | 246% |
| Low Income Home Energy Assistance Block Grant | 1982 | 3,390 | 14% | -46% |
| Total | $38,238 | -36% | ||
End Notes
[1] Robert Jay Dilger and Eugene Boyd, “Block Grants: Perspectives and Controversies,” Congressional Research Service, July 15, 2014, http://fas.org/sgp/crs/misc/R40486.pdf. Table 2 of this CRS report contains a list of block-grant programs. This analysis examines all the block-grant programs focused on housing, health, and social services for low-income people, except for those funded at levels below $100 million according to CRS.
[2] Since 2000, the median, or typical, funding decline for block grants has also been 26 percent.
[3] The funding reductions have also occurred even though the economy has grown by 33 percent since 2000. In 2000, block-grant funding equaled 0.36 percent of the economy. In 2016, this share dropped to 0.21 percent, a decline of two-fifths.
[4] So-called “maintenance-of-effort” requirements can constrain the size of such funding shifts, but such requirements are notoriously difficult to enforce, and experience has shown they are not fully successful. The Government Accountability Office study referred to in the text documented, for example, how some states substituted federal TANF funding for other state costs, despite a maintenance-of-effort requirement. (See “Welfare Reform: Challenges to Maintaining a Federal-State Fiscal Partnership,” August 2001, http://www.gao.gov/assets/240/232403.pdf.) Maintenance-of-effort requirements also can be compromised when states can count spending by third parties toward the requirements. For example, under the maintenance-of-effort requirement in the federal TANF law, Georgia has a $173 million maintenance-of-effort obligation. But Georgia has used maneuvers that are not barred by federal law to count non-government spending toward this obligation and to shift $99 million a year in state funding to other areas of the state budget unrelated to helping low-income families become self-sufficient or meet basic needs. See Melissa Johnson, “Pending TANF Changes Could Send Georgia Budget Writers Scrambling,” Georgia Budget and Policy Institute, August 21, 2015, http://gbpi.org/pending-tanf-changes-could-send-georgia-budget-writers-scrambling.
[5] Ife Floyd, LaDonna Pavetti, and Liz Schott, “TANF Continues to Weaken as a Safety Net,” Center on Budget and Policy Priorities, updated October 27, 2015, https://www.cbpp.org/research/family-income-support/tanf-continues-to-weaken-as-a-safety-net; Liz Schott, LaDonna Pavetti, and Ife Floyd, “How States Use Federal and State Funds Under the TANF Block Grant,” Center on Budget and Policy Priorities, updated October 15, 2015, https://www.cbpp.org/research/family-income-support/how-states-use-federal-and-state-funds-under-the-tanf-block-grant.
[6] The funding levels for CDBG reflected in this analysis represent CDBG’s formula-based funding. They don’t include, for example, funding channeled through CDBG for disaster relief.
[7] For year-by-year figures for the individual block grant programs from 2000-2016, adjusted for inflation, see https://www.cbpp.org/sites/default/files/atoms/files/3-14-16bud.xlsx.
More from the Authors


Areas of Expertise
