Eliminating Social Services Block Grant Would Weaken Services for Vulnerable Children, Adults, and Disabled
The House Republican 2017 budget plan would eliminate the Social Services Block Grant (SSBG), a uniquely flexible funding source that helps states meet the specialized needs of their most vulnerable populations. This would impair states’ ability to fund many public services that mainly benefit low- and moderate-income children and people who are elderly or disabled (see Figure 1 and Appendix A).[2]
States use the $1.7 billion-a-year grant to support services designed to help people become more self-sufficient by providing child care assistance, to prevent and address child abuse and neglect, and to support community-based care for the elderly and disabled. Roughly 28 million people — about half of them children — receive services funded in whole or part by the SSBG.[3]
States would be hard pressed to replace lost SSBG funds. Although state revenues have slowly recovered since the Great Recession, the need for services has increased. And while most states have augmented their SSBG allotments by transferring some funds from their Temporary Assistance for Needy Families (TANF) programs, TANF is not a realistic source of funding to replace the SSBG. Federal TANF funding itself is shrinking — the TANF block grant has declined by a third in inflation-adjusted terms since its creation in 1996 — and a number of states have cut cash assistance for very poor families with children and TANF-funded services to help poor mothers find and retain jobs. In addition, TANF funds cannot be used to fund some of the services the SSBG provides, such as services to people who are elderly or disabled.
Republicans’ reasons to support ending the SSBG fall short. House Ways and Means Chairman Kevin Brady has claimed that it is “duplicative.” SSBG is not duplicative, as states use it to provide services for which there is no dedicated funding stream or where funding is inadequate. Congress designed the SSBG as a flexible source of funding that states can tailor to their own needs and priorities.
Another defense offered for the proposed cut — that the SSBG supports services for many people who are not needy — is similarly flawed. The broad purposes for which states can use SSBG funds concern helping vulnerable people who are in need; the SSBG overwhelmingly supports services for low- and moderate-income families and individuals and focuses on lower-income communities. Moreover, SSBG-funded services like child care assistance often have state-imposed income limits.
While House Speaker Paul Ryan called on Republicans to focus on reducing poverty earlier this year, the 2017 House budget does the opposite. The elimination of SSBG is one component of the larger plan to cut low- and moderate-income programs by 42 percent over the next decade.
Background
Policymakers created the SSBG in 1981, primarily as a cost-saving measure; it consolidated several smaller funding streams in which the federal and state governments shared costs and reduced overall federal funding for these programs by 20 percent, from $2.99 billion to $2.4 billion in nominal dollars. (Unless otherwise noted, this paper uses nominal dollars.)[4]
The SSBG gives states important flexibility. States can use SSBG funds to provide services that help achieve any of the program’s goals — reducing dependency and promoting self-sufficiency; protecting children and adults from neglect, abuse, and exploitation; and helping individuals who are unable to take care of themselves to stay in their homes or to find the best institutional arrangement. States can decide what services to support with SSBG funds and what populations to serve, and can refocus their SSBG expenditures over time as their populations’ needs change.
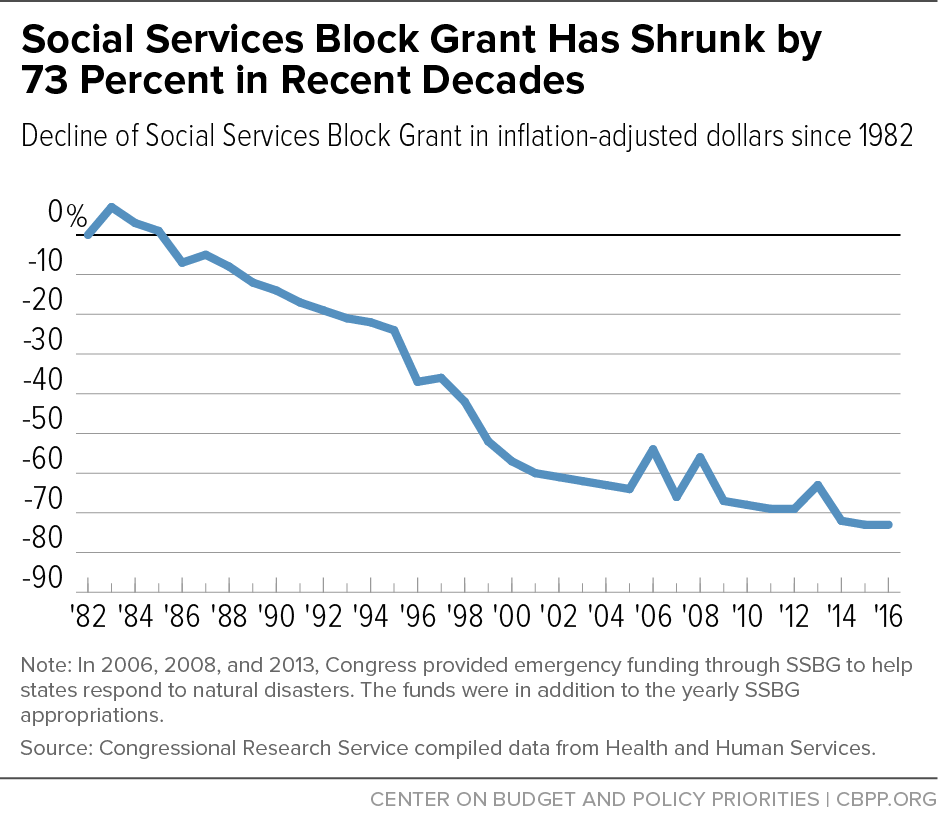
Although the SSBG was created with bipartisan support, it has lost 73 percent of its value since 1982, the first year of implementation, due to inflation, funding freezes, budget cuts, and sequestration (see Figure 1). Between 1982 and 1996, funding fluctuated between $2.4 billion and $2.8 billion. The 1996 welfare law cut the SSBG by 15 percent in nominal terms — from $2.8 billion to $2.38 billion — for fiscal years 1997 through 2002, while calling for SSBG’s budget authority to return to $2.8 billion for fiscal year 2003 and thereafter. Instead, however, Congress cut SSBG’s funding authorization further to $1.7 billion for fiscal year 2001, where it has remained since, aside from supplemental appropriations in 2006, 2008, and 2013 in response to natural disasters (see box, below).
Starting in fiscal year 2013, however, SSBG funding has been reduced further because of the sequestration of some mandatory programs resulting from the 2011 Budget Control Act. As a result, between 2013 and 2016 SSBG’s original appropriations of $1.7 billion were cut to less than $1.6 billion (not including the emergency funding in 2013). Under current law, sequestration of mandatory programs will continue through 2025, thereby automatically reducing the SSBG’s annual authorized level below $1.6 billion for each of the next nine years.[5]
SSBG funding is allocated to states, the District of Columbia, and the territories based on population. States can also transfer up to 10 percent of their federal Temporary Assistance for Needy Families (TANF) block grant funds to supplement the SSBG; they can use the transferred TANF funds only for families with children whose incomes are below 200 percent of the poverty line. States transferred about $1.3 billion in fiscal year 2013, accounting for about 45 percent of SSBG expenditures that year. (Unless otherwise noted, all figures in this paper refer to federal SSBG funds and do not include state-transferred TANF funds.) Nearly all SSBG funds help provide services to individuals in need; only 4 percent of the federally allocated SSBG funds go to administrative costs.[6]
Eliminating the SSBG Likely Would Reduce Critical Services for Populations With Unique Needs
-
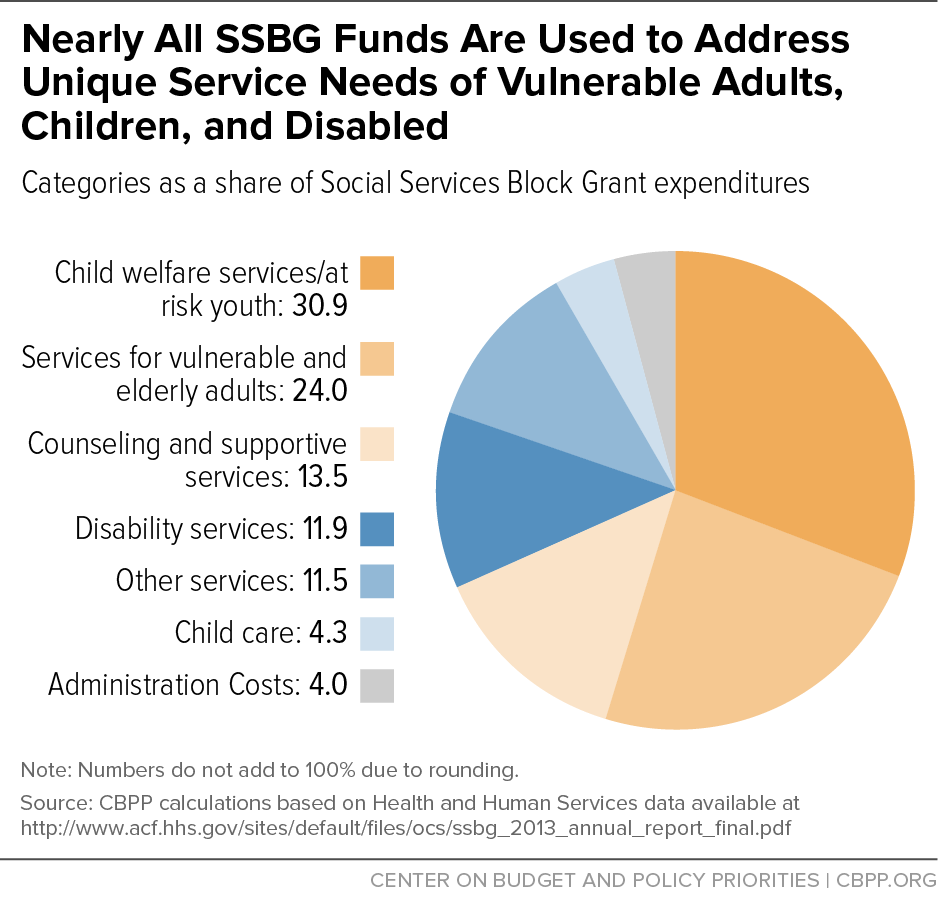
Eliminating the SSBG likely would create significant service gaps for children who have experienced or are at risk of abuse or neglect. In fiscal year 2013, about 31 percent of federal SSBG funds, up from 24 percent in 2009, were used to assist children involved in (or at risk of being involved in) the child welfare or juvenile justice systems or to provide adoption services (see Figure 2 and Appendix C); 45 states and the District of Columbia used SSBG funds for this purpose, and 23 states used at least half of their SSBG funds for it.
Within the complex system of federal, state, and local child welfare financing, SSBG funds play a critical role in augmenting other, more restrictive child welfare funding streams. For example, they fill a significant gap in foster care funding for children who cannot be cared for in their own homes. Nationally, in 2010, only 44 percent of children in foster care met the outdated eligibility criteria for federal funding under Title IV-E (Federal Payments for Foster Care and Adoption Assistance).[7] States receive federal Title IV-E funding only for children whose parents would have been eligible for benefits from TANF’s predecessor, the Aid to Families with Dependent Children program, as that program existed on July 16, 1996, 20 years ago.[8] SSBG funds are also used to provide other services for at-risk children and youth. For example, they are used to provide in-home services to families so that out-of-home placements can be prevented and to provide residential care for children and youth whose problems are so severe that they cannot easily be cared for by family members at home or in foster care.
-
Ending the SSBG likely would reduce funding for services that protect elderly adults from harm and help them stay in their own homes.Services for vulnerable and elderly adults accounted for 24 percent of SSBG spending in fiscal year 2013 (see Figure 2 and Appendix C); 43 states, the District of Columbia, and Puerto Rico used SSBG funds for this purpose, and four states used at least half of their SSBG funds to provide these services.
Services for vulnerable and elderly adults are more dependent on SSBG funds than any other service that the SSBG supports. For example, in fiscal year 2013, SSBG funds accounted for 61 percent of the total funding that states report for adult day care services, which help elderly adults stay in their own homes rather than enter more costly institutional facilities. SSBG funds also accounted for 25 percent and 39 percent, respectively, of funding for adult foster care and adult protective services, which help address abuse and exploitation of older adults.[9] In addition, the SSBG is an important source of funding for nearly half of state aging agencies, according to the AARP Public Policy Institute.[10]
Figure 2 -
Without the SSBG, fewer families will receive counseling and support services that can help protect children from negative outcomes. In fiscal year 2013, 13.5 percent of SSBG funds went to provide counseling, supportive services, and case management for vulnerable children and adults (see Figure 2 and Appendix C); 35 states, the District of Columbia, and Puerto Rico used SSBG funds for this purpose, and New Jersey, North Dakota, Vermont, and Puerto Rico used more than half of their funds for it. Children and adolescents from disadvantaged families were less likely to act out, display symptoms of depression, or be held back in school if their mothers reported having emotional support for childrearing, a Child Trends study found.[11] The SSBG’s flexibility enables states to provide this type of support to families, especially those whose needs are significant but not so severe as to qualify them for state mental health or child welfare systems.
-
Some individuals living with a disability likely would lose access to services that improve their quality of life and help them remain in the community. About 12 percent of SSBG funds went to services for disabled individuals in fiscal year 2013 (see Figure 2 and Appendix C); 20 states used SSBG funds for this purpose, and California, Iowa, and Montana used more than half of their funds for it. SSBG-funded services, which include mobility training for blind or visually impaired individuals and respite care for families caring for a disabled family member, help disabled individuals live as independently as possible.
-
The loss of SSBG funds would worsen the already severe shortage of child care assistance for low-income families. In fiscal year 2013, some 4 percent of SSBG funds were used to provide child care to low-income families (see Figure 2 and Appendix C); 27 states and the District of Columbia used federal SSBG funds for this purpose. Twenty-one states had waiting lists for child care assistance or turned away families requesting help in 2015, according to the National Women’s Law Center.[12] Department of Health and Human Services data indicate that only about 1 in 6 low-income children who may be eligible for child care subsidies under federal law actually receive it.[13] Given that demand for child care assistance already far exceeds the supply, the loss of SSBG funding would further limit states’ ability to help working-poor families and families that are looking for work in order to become self-sufficient.
SSBG: A Useful Disaster Response Tool
The SSBG has served as a conduit for emergency appropriations to help residents and communities respond to the additional social service and health needs resulting from natural disasters, such as floods, wildfires, and hurricanes.
Federal policymakers used SSBG to provide emergency funding in response to the Gulf Coast hurricanes in 2005 — including Hurricane Katrina — and Hurricane Sandy in 2012. For example, Congress allocated almost $500 million in emergency funding for states affected by Hurricane Sandy. Funds were designated for social, health, and mental health services for individuals and repair and renovation for social service facilities. SSBG’s flexibility allowed states to streamline eligibility for services funded by the emergency appropriations. Eliminating the SSBG could make it harder to provide this sort of flexible funding in the aftermath of emergencies.
a Karen Lynch, “Social Services Block Grant: Background and Funding,” March 16, 2014, Congressional Research Service
https://www.fas.org/sgp/crs/misc/94-953.pdf.
States Cannot Replace Lost SSBG Funds
States are not in a position to replace the funds they would lose if Congress eliminated the SSBG. States made broad and deep spending cuts to address the budget gaps they faced during the Great Recession.[14] The cuts affected all major areas of state budgets, including elementary and secondary education, health care, higher education, and human services. New cuts imposed to make up for the loss of SSBG funds while state coffers are recovering would likely come at the expense of services that remain underfunded.
Nor are states’ federal TANF funds the solution. The 1996 welfare law allows states to transfer a small portion of their TANF block grant to the SSBG.[15] The transferred funds must go to services for families with children with incomes under 200 percent of the poverty line. Thirty-nine states and Puerto Rico transferred $1.3 billion to the SSBG in fiscal year 2013, with 63 percent of the transferred TANF funds going to child welfare and another 18 percent going to child care services. Most states cannot increase their SSBG transfers as they are at or close to the allowed transfer limit.[16]
Furthermore, states do not have additional TANF funds to transfer or spend directly on these programs. The annual TANF block grant has remained frozen since its creation in 1996 and has lost a third of its value due to inflation, while other supplements to the TANF block grant have either been eliminated or underfunded.[17] Fiscal pressures have played a significant role in driving TANF cuts. For example, in the aftermath of the recession, a number of states reduced benefit levels and tightened time limits. Last year, Arizona reduced its time limit to 12 months, the shortest in the nation, citing budgetary constraints.
Arguments for Eliminating the SSBG Are Flawed, Conflict With Calls to Reduce Poverty
In calling for ending the SSBG, House Ways and Means Chairman Kevin Brady called it “duplicative” and a “slush fund.”[18] This criticism misses the mark; the SSBG is a flexible funding stream, but it is hardly duplicative. As noted above, states use SSBG funds to provide services for which there is no dedicated funding stream or where funding is inadequate. They also use SSBG funds to serve people who, despite their clear need and often desperate circumstances, do not meet the criteria for other, narrowly designed federal funding streams.
The SSBG’s flexibility allows states to serve populations that have unique needs without creating myriad special programs, each with its own complex eligibility rules. It also allows states to tailor services to their particular demographics: states with large elderly populations can devote more of their SSBG funds to help elderly individuals stay in their own homes, for example, while states with more low-income and vulnerable children can use more of their funds to provide child care or more adequately fund their child welfare systems.
The Government Accountability Office’s 2012 comprehensive survey of duplication and overlap in the federal government makes no mention of any duplication related to the SSBG.[19] In fact, the report’s only mention of the SSBG is in its discussion of child care, where its primary finding is that there is insufficient funding to serve all eligible families, despite the multiple funding streams used to support child care services. In other words, there is too little, not too much, child care assistance available. Eliminating the SSBG would worsen the problem.
The House 2017 budget plan also implies that because there are no federal income limits for receipt of SSBG-funded services, those services are not well targeted to truly needy people.[20] This criticism, too, is incorrect. More than half of SSBG funds go to services like child welfare and protecting adults from abuse and neglect — in other words, to help vulnerable people in need, regardless of their income. Moreover, states often use their discretion to restrict other SSBG-supported services, like child care and supportive services, to low-income families. For example, Texas restricts eligibility for supportive services for emotionally disturbed children to families with incomes below 200 percent of the poverty line, Arizona restricts child care eligibility to families at or below 165 percent of the poverty line, and Connecticut restricts eligibility for most services (except those designed to address or prevent abuse or neglect) to individuals or families with incomes at or below 150 percent of the poverty line.[21]
Moreover, the proposed elimination of SSBG and other cuts to programs that benefit low- and moderate-income people in the House budget plan conflict with House Speaker Paul Ryan’s call to focus on reducing poverty. Speaker Ryan stated earlier this year that reforming poverty programs “will not be a budget-cutting exercise,”[22] but that is exactly what the budget does, in cutting programs for low- and moderate-income people by 42 percent by 2026.[23] Taken together, this budget — including the elimination of the SSBG — would undermine vital services for low-income people and lead to more poverty, inequality, and severe hardship and less opportunity.[24]
| APPENDIX A | ||
|---|---|---|
| Social Services Block Grant Spending for FY 2013: CBPP Consolidated Categories and Official Reporting Categories | ||
| Service Categories | SSBG Expenditures | Share of Total SSBG Expenditures |
| Child Welfare/At-Risk Youth | $507,024,511 | 30.9% |
| Foster care services — children | 136,561,274 | 8.3% |
| Protective services — children | 132,261,396 | 8.0% |
| Prevention and intervention | 69,478,855 | 4.2% |
| Residential treatment | 63,023,955 | 3.8% |
| Adoption services | 29,712,410 | 1.8% |
| Independent/transitional living | 10,845,289 | 0.7% |
| Special services — youth at risk | 65,141,332 | 4.0% |
| Vulnerable and Elderly Adults | $394,090,823 | 24.0% |
| Protective services — adults | 181,685,012 | 11.1% |
| Home-based services | 137,649,489 | 8.4% |
| Foster care services — adults | 28,700,968 | 1.7% |
| Day care — adults | 23,936,030 | 1.5% |
| Home-delivered meals | 20,642,411 | 1.3% |
| Congregate meals | 1,476,913 | 0.1% |
| Counseling and Supportive Services | $221,260,844 | 13.5% |
| Case management | 132,455,667 | 8.1% |
| Counseling services | 26,335,394 | 1.6% |
| Transportation | 19,543,296 | 1.2% |
| Health-related services | 16,846,356 | 1.0% |
| Housing services | 13,051,578 | 0.8% |
| Substance abuse services | 13,028,553 | 0.8% |
| Disability Services | $196,149,024 | 11.9% |
| Other Services | $188,651,671 | 11.5% |
| Other services | 128,383,611 | 7.8% |
| Information and referral | 16,894,190 | 1.0% |
| Legal services | 14,090,355 | 0.9% |
| Employment services | 7,934,939 | 0.5% |
| Pregnancy and parenting | 7,655,808 | 0.5% |
| Family planning services | 7,185,925 | 0.4% |
| Education and training services | 5,812,304 | 0.4% |
| Recreational services | 694,539 | 0.0% |
| Child Care | $70,259,364 | 4.3% |
| Administrative Expenses | $66,026,517 | 4.0% |
| APPENDIX B | ||||
|---|---|---|---|---|
| Social Services Block Grant Allocations, TANF Transfers, and Number of Individuals Served for FY 2013 | ||||
| State | SSBG Allocations | TANF Transfer | Total SSBG Expenditures | Recipients |
| Alabama | 25,812,196 | 5,000,000 | 30,812,196 | 49,739 |
| Alaska | 3,721,041 | 4,526,033 | 8,247,074 | 45,397 |
| Arizona | 44,644,903 | 21,478,358 | 66,123,261 | 6,356,353 |
| Arkansas | 16,373,663 | 0 | 16,373,663 | 154,007 |
| California | 199,671,133 | 368,108,848 | 567,779,981 | 2,928,515 |
| Colorado | 30,856,067 | 1963705 | 32,819,772 | 47,508 |
| Connecticut | 14,429,766 | 19,110,234 | 33,540,000 | 683,764 |
| Delaware | 4,748,985 | 0 | 4,748,985 | 13,473 |
| Dist. of Col. | 3,624,015 | 3,935,917 | 7,559,932 | 32,900 |
| Florida | 103,057,870 | 57,134,483 | 160,192,353 | 2,337,149 |
| Georgia | 50,535,344 | 0 | 50,535,344 | 55,964 |
| Hawaii | 3,296,229 | 9,890,000 | 13,186,229 | 12,376 |
| Idaho | 7,411,193 | 1,199,522 | 8,610,715 | 47,003 |
| Illinois | 68,148,120 | 1,200,000 | 69,348,120 | 885,936 |
| Indiana | 34,007,109 | 0 | 34,007,109 | 944,157 |
| Iowa | 15,766,839 | 12,962,008 | 28,728,847 | 95,112 |
| Kansas | 15,191,404 | 10,193,106 | 25,384,510 | 71,918 |
| Kentucky | 23,170,141 | 0 | 23,170,141 | 211,326 |
| Louisiana | 21,536,837 | 15,857,122 | 37,393,959 | 67,195 |
| Maine | 6,607,061 | 7812089 | 14,419,150 | 87,732 |
| Maryland | 30,007,977 | 22,909,803 | 52,917,780 | 107,413 |
| Massachusetts | 34,837,424 | 45,937,112 | 80,774,536 | 122,376 |
| Michigan | 50,849,294 | 77,535,284 | 128,384,578 | 187,930 |
| Minnesota | 27,198,302 | 4,790,001 | 31,988,303 | 228,872 |
| Mississippi | 15,335,396 | 8,676,758 | 24,012,154 | 90,051 |
| Missouri | 30,947,090 | 21,701,176 | 52,648,266 | 117,671 |
| Montana | 5,135,941 | 1,998,226 | 7,134,167 | 13,379 |
| Nebraska | 9,487,163 | 0 | 9,487,163 | 46,337 |
| Nevada | 14,503,038 | 0 | 14,503,038 | 208,870 |
| New Hampshire | 5,599,116 | 793611 | 6,392,727 | 254,979 |
| New Jersey | 45,298,085 | 17,590,308 | 62,888,393 | 1,690,874 |
| New Mexico | 10,720,695 | 0 | 10,720,695 | 25,064 |
| New York | 103,495,241 | 362,794,978 | 466,290,219 | 369,093 |
| North Carolina | 52,915,012 | 10,075,769 | 62,990,781 | 491,308 |
| North Dakota | 3,521,345 | 0 | 3,521,345 | 5,793 |
| Ohio | 59,395,144 | 45,742,186 | 105,137,330 | 413,369 |
| Oklahoma | 19,521,249 | 14,528,144 | 34,049,393 | 115,681 |
| Oregon | 20,521,801 | 0 | 20,521,801 | 50,276 |
| Pennsylvania | 65,677,471 | 30,576,016 | 96,253,487 | 5,949,229 |
| Rhode Island | 5,238,667 | 9,337,841 | 14,576,508 | 300,072 |
| South Carolina | 24,587,081 | 0 | 24,587,081 | 20,973 |
| South Dakota | 5,424,193 | 1,915,800 | 7,339,993 | 9,270 |
| Tennessee | 34,158,282 | 0 | 34,158,282 | 57,807 |
| Texas | 128,392,716 | 33,494,741 | 161,887,457 | 1,686,677 |
| Utah | 17,328,291 | 7,607,000 | 24,935,291 | 258,034 |
| Vermont | 3,225,292 | 4,735,318 | 7,960,610 | 17,892 |
| Virginia | 41,686,797 | 13,825,500 | 55,512,297 | 108,388 |
| Washington | 35,165,658 | 5,675,000 | 40,840,658 | 135,683 |
| West Virginia | 9,552,670 | 11,017,631 | 20,570,301 | 63,537 |
| Wisconsin | 29,408,042 | 15,443,200 | 44,851,242 | 166,946 |
| Wyoming | 2,925,262 | 1,850,053 | 4,775,315 | 7,860 |
| Puerto Rico | 8,793,103 | 7,156,250 | 15,949,353 | 9,629 |
| US Total | 1,643,462,754 | 1,318,079,131 | 2,961,541,885 | 28,458,857 |
| APPENDIX C | |||||
|---|---|---|---|---|---|
| Share of Total Social Services Block Grant Expenditures for CBPP Consolidated Categories by State, FY 2013 | |||||
| State | Child Welfare/At-Risk Youth | Vulnerable & Elderly Adults | Counseling & Supportive Services | Disability Services | Child Care |
| Alabama | 0.0% | 11.2% | 0.0% | 0.0% | 1.9% |
| Alaska | 100.0% | 0.0% | 0.0% | 0.0% | 0.0% |
| Arizona | 28.7% | 18.5% | 35.3% | 0.4% | 0.6% |
| Arkansas | 50.2% | 10.3% | 9.3% | 21.2% | 0.4% |
| California | 0.0% | 8.9% | 0.0% | 72.6% | 18.5% |
| Colorado | 92.7% | 6.4% | 0.0% | 0.0% | 0.3% |
| Connecticut | 41.0% | 19.4% | 26.8% | 0.0% | 0.0% |
| Delaware | 46.7% | 21.1% | 1.5% | 0.0% | 23.2% |
| District of Columbia | 9.0% | 44.3% | 6.9% | 0.0% | 6.1% |
| Florida | 58.3% | 9.5% | 7.6% | 15.4% | 3.0% |
| Georgia | 16.3% | 11.1% | 36.4% | 2.3% | 0.0% |
| Hawaii | 82.4% | 17.5% | 0.0% | 0.0% | 0.0% |
| Idaho | 64.3% | 0.0% | 21.8% | 10.4% | 0.4% |
| Illinois | 12.2% | 52.1% | 13.2% | 4.2% | 3.0% |
| Indiana | 55.4% | 16.7% | 16.0% | 7.8% | 0.0% |
| Iowa | 5.0% | 0.2% | 11.0% | 76.9% | 0.0% |
| Kansas | 64.0% | 34.7% | 0.0% | 0.0% | 1.3% |
| Kentucky | 92.4% | 7.3% | 0.0% | 0.0% | 0.0% |
| Louisiana | 93.3% | 0.0% | 0.0% | 0.0% | 0.0% |
| Maine | 60.4% | 6.1% | 16.8% | 0.0% | 0.0% |
| Maryland | 15.7% | 47.6% | 36.7% | 0.0% | 0.0% |
| Massachusetts | 73.2% | 24.0% | 0.0% | 1.9% | 0.1% |
| Michigan | 58.0% | 29.1% | 2.9% | 0.0% | 0.0% |
| Minnesota | 39.1% | 3.5% | 28.0% | 1.7% | 0.8% |
| Mississippi | 34.4% | 30.5% | 7.9% | 0.0% | 0.0% |
| Missouri | 36.4% | 2.7% | 42.5% | 0.0% | 7.9% |
| Montana | 0.0% | 5.8% | 0.0% | 92.6% | 0.0% |
| Nebraska | 25.9% | 15.6% | 48.9% | 3.0% | 1.8% |
| Nevada | 50.7% | 18.3% | 18.1% | 0.0% | 0.0% |
| New Hampshire | 0.9% | 71.6% | 17.5% | 0.0% | 0.0% |
| New Jersey | 9.1% | 8.9% | 54.2% | 0.0% | 2.1% |
| New Mexico | 68.7% | 22.6% | 0.0% | 0.0% | 0.0% |
| New York | 0.0% | 67.2% | 3.6% | 0.0% | 12.1% |
| North Carolina | 18.5% | 25.3% | 18.0% | 5.4% | 4.9% |
| North Dakota | 0.0% | 0.0% | 100.0% | 0.0% | 0.0% |
| Ohio | 6.5% | 8.2% | 13.9% | 0.7% | 1.0% |
| Oklahoma | 60.5% | 39.1% | 0.0% | 0.0% | 0.4% |
| Oregon | 92.0% | 0.0% | 0.0% | 0.0% | 0.0% |
| Pennsylvania | 35.0% | 9.9% | 15.9% | 0.0% | 0.0% |
| Rhode Island | 25.6% | 0.1% | 49.3% | 0.0% | 15.0% |
| South Carolina | 65.7% | 28.1% | 0.1% | 0.0% | 0.0% |
| South Dakota | 56.3% | 42.9% | 0.0% | 0.0% | 0.0% |
| Tennessee | 30.5% | 20.4% | 26.5% | 0.0% | 12.1% |
| Texas | 3.9% | 77.3% | 7.4% | 0.9% | 0.0% |
| Utah | 36.8% | 9.6% | 32.4% | 7.9% | 0.1% |
| Vermont | 5.8% | 3.5% | 71.6% | 2.1% | 1.9% |
| Virginia | 66.2% | 16.4% | 16.8% | 0.0% | 0.0% |
| Washington | 63.3% | 0.0% | 12.4% | 0.0% | 2.6% |
| West Virginia | 74.6% | 25.2% | 0.0% | 0.0% | 0.2% |
| Wisconsin | 29.8% | 11.8% | 20.2% | 0.4% | 0.4% |
| Wyoming | 82.0% | 0.0% | 4.3% | 0.0% | 0.5% |
| Puerto Rico | 0.0% | 10.0% | 62.0% | 0.0% | 0.0% |
| State Total | 30.9% | 24.0% | 13.5% | 11.9% | 4.3% |
End Notes
[1] Indivar Dutta-Gupta co-authored an earlier version of this report.
[2] States report SSBG spending in 29 categories. We have collapsed those 29 categories into the seven shown in Figure 2. Spending for each of the 29 categories can be found in Appendix A. The expenditures reported in this paper are for fiscal year 2013, the latest year for which state SSBG expenditure data are available. “Social Services Block Grant Program Annual Report 2013,” Department of Health and Human Services, http://www.acf.hhs.gov/sites/default/files/ocs/ssbg_2013_annual_report_final.pdf.
[3] These figures are for fiscal year 2013, the most recent year for which data on the number of recipients are available. An individual may have received more than one SSBG-supported service. Department of Health and Human Services, 2013.
[4] Congress created the Social Services Block Grant in the Omnibus Budget Reconciliation Act of 1981, which consolidated funding for the provision of social services and for staff training for those providing social services. When SSBG was created, funding was capped and federal requirements for targeting benefits to certain beneficiaries were eliminated. For more detail on the history of funding for social services now funded through the SSBG, see: Committee on Ways and Means, “Green Book: Background Material and Data on the Programs within the Jurisdiction of the Committee on Ways and Means,” U.S. House of Representatives, December 2011, http://greenbook.waysandmeans.house.gov/.
[5] Karen E. Lynch, “Social Services Block Grant: Background and Funding,” Congressional Research Service, March 14, 2016, https://www.fas.org/sgp/crs/misc/94-953.pdf.
[6] The SSBG’s low administrative costs are typical for programs targeted to low-income and vulnerable individuals. See Robert Greenstein and CBPP staff, “Romney’s Charge that Most Federal Low-Income Spending Goes for ‘Overhead’ and ‘Bureaucrats’ Is False: For Major Low-Income Programs, More than 90 Percent Goes to Beneficiaries,” Center on Budget and Policy Priorities, January 23, 2012, https://www.cbpp.org/cms/?fa=view&id=3655.
[7] According to Sean Hughes and Suzanne Lay of the Child Welfare League of America, “Because IV-E eligibility is linked to outdated income standards [that require parents to meet income eligibility requirements of the old AFDC program in 1996], less than half of children in foster care are currently supported by IV-E. Furthermore, because the income restrictions that IV-E is linked to are frozen in place and not adjusted for inflation, the rate of foster children covered by IV-E, which is known as the penetration rate, saw a dramatic decline since 1998. As the number of eligible children decreases, states face increasing pressure and decreasing federal IV-E reimbursements to maintain the support for these vulnerable children and families.” Sean Hughes and Suzanne Lay, “Direct Service Workers’ Recommendations for Child Welfare Financing and System Reform,” Child Welfare League of America, January 2012.
[8] Child Welfare Policy Manual, Subsection 8.4A TITLE IV-E, General Title IV-E Requirements, AFDC Eligibility. Department of Health and Human Services, Administration for Children and Families, http://www.acf.hhs.gov/cwpm/programs/cb/laws_policies/laws/cwpm/policy_dsp.jsp?citID=8#612.
[9] Department of Health and Human Services, 2013.
[10] Jenna Walls et al., “Weathering the Storm: The Impact of The Great Recession on Long-Term Services and Supports,” AARP Public Policy Institute, January 2011, http://assets.aarp.org/rgcenter/ppi/ltc/CURRENT__Budget_Paper_v9Jan6.pdf.
[11] Tawana Bandy, Kristine M. Andrews, and Kristin Anderson Moore, “Disadvantaged Families and Child Outcomes: The Importance of Emotional Support for Mothers,” Child Trends, Research-to-Results brief, February 2012, http://www.childtrends.org/Files/Child_Trends-2012_03_21_RB_MaternalSupport.pdf.
[12] Karen Schulman and Helen Blank, “Building Blocks: State Child Care Assistance Policies 2015,” National Women’s Law Center, October 2015, https://nwlc.org/wp-content/uploads/2015/11/CC_RP_Building_Blocks_Assistance_Policies_2015.pdf.
[13] ASPE staff, “Estimates of Child Care Eligibility and Receipt for Fiscal Year 2011,” Department of Health and Human Services, February 2015, https://aspe.hhs.gov/sites/default/files/pdf/33816/ib_ChildCareEligibility.pdf.
[14] Elizabeth McNichol, “States Should React Cautiously to Recent Income Tax Growth,” Center on Budget and Policy Priorities, September 5, 2013, https://www.cbpp.org/research/states-should-react-cautiously-to-recent-income-tax-growth.
[15] A state can transfer up to 30 percent of its TANF block grant funds per year to the Child Care and Development Block Grant and up to 10 percent to the SSBG, as long as the total amount transferred doesn’t exceed 30 percent. Transferred funds are subject to the rules of the program to which they are transferred, not to TANF rules.
[16] Analysis of the Department of Health and Human Services’ TANF financial data.
[17] Since 2011, Congress has failed to provide any funding for TANF Supplemental Grants, which provide additional funding for 17 states, a majority of which are poor states. In addition, in 1996, Congress set aside $2 billion for a Contingency Fund to provide additional help to states in hard economic times. The original $2 billion provided in 1996 was depleted early in fiscal year 2010, but Congress has added a small amount for the Contingency Fund each year, insufficient to provide the full funding for which states qualify under the law. See also, Liz Schott, LaDonna Pavetti, and Ife Floyd, “How States Use Federal and State Funds Under the TANF Block Grant,” Center on Budget and Policy Priorities, October 15, 2015, https://www.cbpp.org/research/family-income-support/how-states-use-federal-and-state-funds-under-the-tanf-block-grant.
[18] House Ways and Means Chairman Kevin Brady’s statement, March 10, 2016, http://waysandmeans.house.gov/brady-highlights-budget-savings-package-to-decrease-national-debt-fight-fraud/.
[19] Government Accountability Office, “2012 Annual Report: Opportunities to Reduce Duplication, Overlap and Fragmentation, Achieve Savings, and Enhance Revenue,” February 2012, http://www.gao.gov/assets/590/588818.pdf.
[20] House Budget Committee, “Concurrent Resolution on the Budget — Fiscal Year 2017,” March 23, 2016, http://budget.house.gov/uploadedfiles/fy2017_budget_resolution.pdf.
[21] Most states report their eligibility criteria for various services in their annual SSBG state plans. The plans for these three states can be found at the following links: Arizona: https://des.az.gov/sites/default/files/2017-SSBG-State-Plan.pdf; Connecticut: http://www.ct.gov/dss/lib/dss/pdfs/pgr/FFY_2016_SSBG_Allocation_Plan.pdf; Texas: http://www.hhsc.state.tx.us/reports/2014/2015-Intended-Use-Plan.pdf.
[22] Robert Greenstein and Isaac Shapiro, “Will the House Budget Reflect Speaker Ryan’s Statements to Spend the Same Amount in Fighting Poverty?” Center on Budget and Policy Priorities, March 14, 2016, https://www.cbpp.org/federal-budget/will-the-house-budget-reflect-speaker-ryans-statements-to-spend-the-same-amount-in.
[23] Richard Kogan and Isaac Shapiro, “House GOP Budget Gets 62 Percent of Budget Cuts From Low- and Moderate-Income Programs,” Center on Budget and Policy Priorities, March 28, 2016, https://www.cbpp.org/research/federal-budget/house-gop-budget-gets-62-percent-of-budget-cuts-from-low-and-moderate-income.
[24] Robert Greenstein, “House Budget Would Mean More Poverty, Inequality, and Hardship,” Center on Budget and Policy Priorities, March 15, 2016, https://www.cbpp.org/press/statements/greenstein-house-budget-would-mean-more-poverty-inequality-and-hardship.
More from the Authors

Areas of Expertise