

House Republican Tax Bill Is Skewed to Wealthy, Costs More Than Extending 2017 Tax Law, and Fails to Deliver for Families
Executive Summary
The tax provisions of the House Republican reconciliation bill double down on the failures of the 2017 tax law, which was skewed in favor of the richest people in the country, further eroded the nation’s revenue base, and didn’t produce the promised economic gains for working people.[1] Instead of changing course and prioritizing people with low and moderate incomes as House Republicans’ rhetoric about supporting hard-pressed working families would suggest, the House Republican tax bill only offers more of the same.
The bill is heavily skewed to the wealthy:
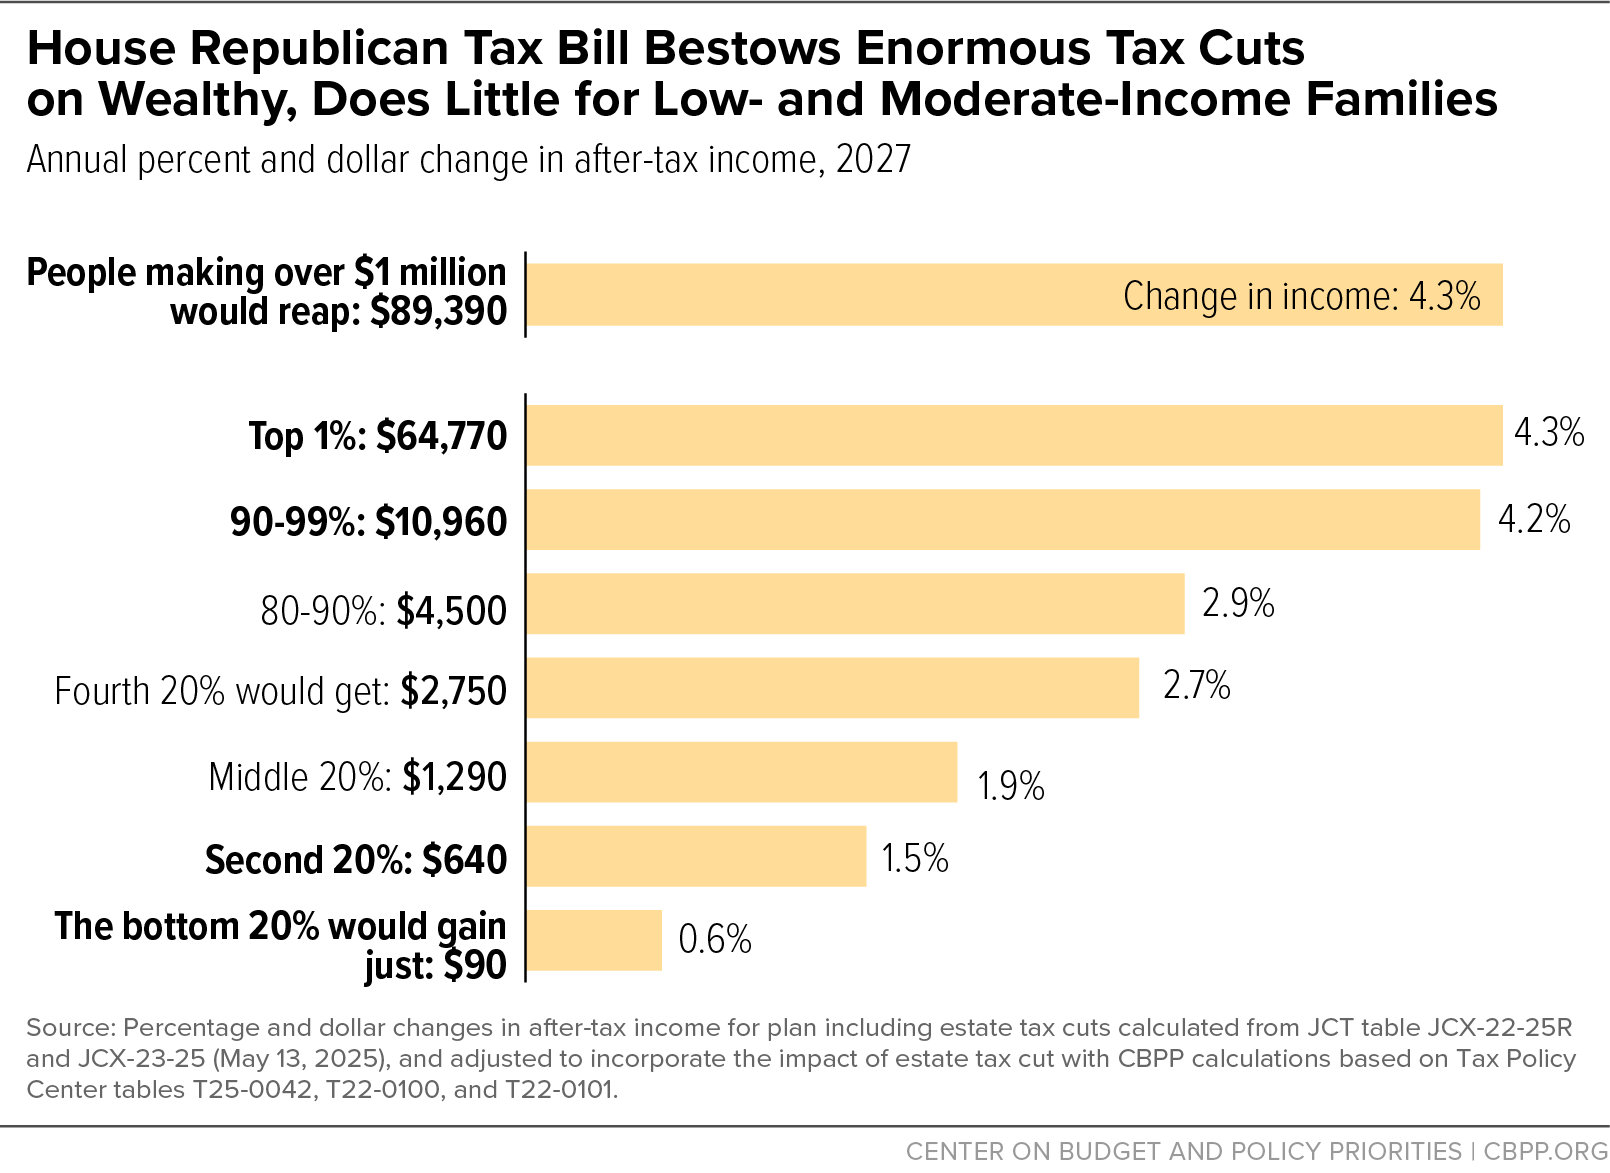
Under the bill, the top 1 percent of people would receive tax cuts three times the size of those for people with incomes in the bottom 60 percent, measured as a share of after-tax income. (See Figure 1.) The top 0.6 percent of people — the 1.2 million people with annual incomes above $1 million — would receive more total tax cuts than the 127 million people with incomes below $100,000.[2]
Moreover, these figures ignore other core components of the Republican agenda that would harm households with low or moderate incomes, including massive cuts in SNAP and Medicaid. (For example, Figure 2 below shows that House Republicans’ cuts in health care and food assistance roughly equal their tax cuts for very high-income people.) The figures also ignore the Trump Administration’s tariffs, which would erase much of the tax benefit low- and moderate-income people would receive and which the bill does nothing to stop.
- The bill extends and expands the 2017 tax law’s increase in the estate tax exemption, boosting the cut in estate taxes for the 1 in 1,000 wealthiest estates to $6.3 million.[3] Next year a couple could pass on an estate worth up to $30 million tax free, $1.7 million more than under a simple extension of the 2017 law.
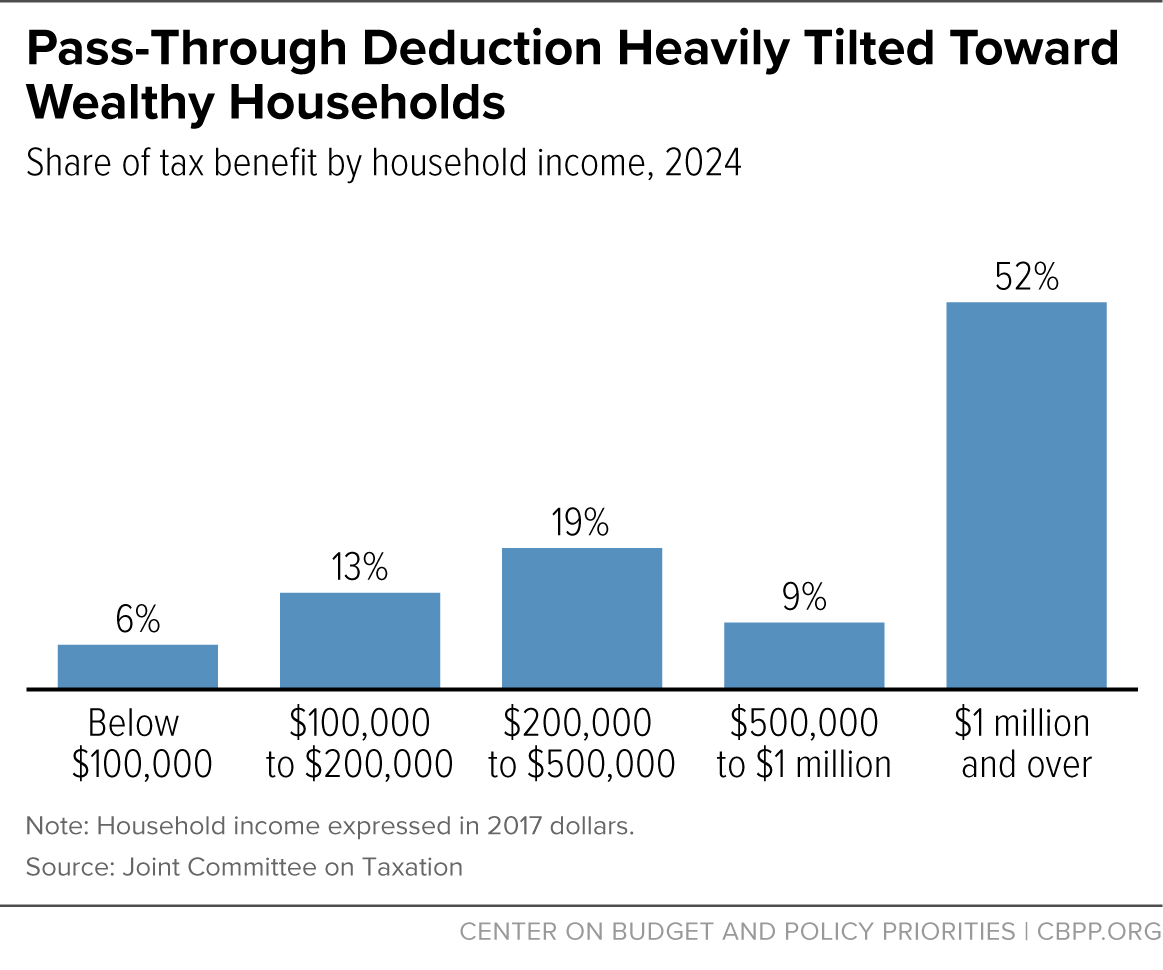
- The bill also extends and expands the 2017 law’s deduction for pass-through business owners, which delivers more than half of its benefits to owners with annual incomes over $1 million.[4] Wealthy owners of complex partnerships would receive larger benefits from the pass-through deduction, and more private equity investors would benefit.
- In addition, the bill includes expanded tax-sheltering opportunities through health savings accounts as well as new corporate tax breaks. These new breaks come on top of the permanent corporate tax cuts from the 2017 tax law, which continue to provide windfalls for shareholders.

The House Republican bill is also expensive, costing more than extending the 2017 tax law:
- Given its additional tax cuts, it’s not surprising that the tax cuts are $500 billion more expensive than extending the 2017 law through 2034: $3.8 trillion versus $3.3 trillion.[5]
- Even this figure understates the cost. The bill drafters cut the duration of many of the new tax cuts proposed by President Trump (such as those on tips and car loans), ending them in 2028, to hide their likely ultimate cost. They also employed other timing gimmicks. If all of the bill’s tax provisions were made permanent, the Committee for a Responsible Federal Budget estimates the bill would cost $5.2 trillion over ten years, instead of the official estimate of $3.8 trillion.[6]
The bill’s relatively small tax breaks urged by the President do little to alter its overall distributional impact. If enacted, the bill would shift large amounts of income up the income scale.
Finally, the bill fails to deliver for families:
- It would block as many as 20 million children in working families from receiving the full $2,500 Child Tax Credit included in the bill because their parents don’t earn enough.[7] These children’s parents work in important but low-paying jobs, including as truck drivers, cooks, and janitors. Under current law, 17 million children don’t currently get the full $2,000 Child Tax Credit,[8] and they would get nothing from the bill’s $500-per-child increase in the credit, even as families earning up to $400,000 would get the full increase. The bill’s omission of these families is especially disappointing given that 169 House Republicans voted last year to deliver a larger Child Tax Credit to the vast majority of these children.
- While the bill extends and even expands the expiring 2017 tax cuts for wealthy people, it would not extend premium tax credit enhancements that help 22 million low- and middle-income people afford marketplace health coverage, including 3 million small-business owners.[9] Letting these enhancements expire (even as tax cuts for very wealthy people are all being extended) would increase the number of people without health insurance by 4 million, according to the Congressional Budget Office.[10]
- The bill would impose unprecedented tax restrictions based on immigration status, even more extreme than those in the 2017 law. It would strip 4.5 million children who are U.S. citizens or lawful permanent residents of eligibility for the Child Tax Credit if even one of their parents lacks a Social Security number, according to estimates by the Center for Migration Studies.[11] The bill would also make it harder for many immigrants who live and work here lawfully to access doctors by taking away premium tax credits from refugees, people granted asylum, and victims of domestic violence, trafficking, and other serious crime, among others.
Bill Is Skewed to the Top, Expands High-End Tax Breaks
Under the House Republican bill, the households with incomes in the top 1 percent would receive tax cuts over two and a half times the size of those for households with incomes in the bottom 60 percent, measured as a share of after-tax income.[12] The top 0.6 percent of people — the 1.2 million people with annual incomes above $1 million — would receive more total tax cuts than the 127 million people with incomes below $100,000.
Moreover, these figures ignore other core components of the Republican agenda that would harm households with low or moderate incomes. House Republican SNAP proposals would shift huge costs to states, almost certainly leading to extensive cuts in enrollment, benefits, or both, and would place households with nearly 11 million people at risk of losing some or all of their food assistance due to expanded red-tape-laden work requirements.[13] House Republican Medicaid proposals, including new work requirements, more frequent redeterminations, and other harmful policies, would result in more than 7.6 million more uninsured people.[14] (Failure to extend the premium tax credit enhancements would result in millions more without coverage, as noted.) The harsh cuts in food assistance and Medicaid and marketplace coverage are roughly equal in size to the bill’s tax cuts for people with incomes above $500,000. (See Figure 2.)

Also, the Trump Administration tariffs will hit low- and moderate-income people particularly hard, erasing much of the tax benefit they would receive from the Ways and Means bill. The chaotic and high tariffs have also increased the risk of recession, which tends to cause the greatest harm among people who lack the financial cushion to weather economic storms.[15]
Further Weakening of Estate Tax for Wealthy Heirs
The 2017 tax law doubled the estate tax exemption to $22 million per couple and indexed it for inflation going forward; this year a couple can pass on an estate worth up to $28 million tax free. Just extending this tax cut beyond 2025 would provide a tax cut of almost $5.7 million per couple for the wealthiest estates.[16] But the bill would go further, raising the exemption to $30 million next year, or $1.7 million more than under a simple extension of the 2017 law. This would boost the tax cut for the wealthiest estates to $6.3 million.[17]
Under current law, fewer than 1 in 1,000 estates are large enough to owe any estate tax.[18] In California, the state with the most estate taxpayers, just 743 estates paid any estate tax in 2022, while no one in Alaska paid any estate tax and 14 states had sample sizes too small to report. (See Appendix Table 5.) Meanwhile, the bill’s estate tax provision would cost over $200 billion over nine years, according to the Joint Committee on Taxation[19] — money flowing mostly to this tiny sliver of the wealthiest people in the country.
The continued weakening of the estate tax exemplifies the generous tax preferences that can dramatically lower the tax bills of high-income, high-wealth households.[20] A typical middle-income person’s income comes mostly through wages or a salary; their income and payroll taxes are withheld from their paychecks, and if their tax liability for a given year exceeds the withheld taxes, they pay the balance by the next April 15. Wealthy people, in contrast, get a large share of their income from capital gains (i.e., increases in the value of their investments), but they don’t owe tax on those gains until they “realize” the gain, usually by selling the appreciated asset. As a result, wealthy people can defer taxes on these gains indefinitely. If they die and pass the assets on to their heirs, the capital gains are never taxed.
Unrealized capital gains make up a substantial share — roughly half overall, and often more — of the value of the wealthiest estates.[21] Therefore, much of the value of these massive inheritances has never been subject to income tax, and wealthy heirs pay no individual income tax on these windfalls, while massive wealth — $30 million, or significantly more with use of loopholes in the estate tax — escapes the estate tax.
Expanded Tax Break for Wealthy Owners of “Pass-Through” Businesses
One of the costliest and most skewed provisions of the 2017 tax law was a new 20 percent deduction for owners of pass-through businesses such as partnerships, whose business income is taxed as the owners’ personal income. Over half of the tax breaks from the deduction go to owners with annual incomes over $1 million[22] (see Figure 3), and studies find the benefits have not “trickled down” to boost workers’ wages or personal income.[23]

The bill would permanently extend the deduction and also expand it to 23 percent. This would effectively cut the top tax rate on business owners’ pass-through income to 28.5 percent, well below the 37 percent top rate that employees of pass-through businesses would face. A business owner with $5 million in qualifying pass-through income, who receives a $370,000 annual tax benefit from the current 20 percent deduction, would receive an extra tax cut of $55,000 from the expansion.
Expanding the deduction also adds $100 billion to the $700 billion cost of simply extending it, for a total of $800 billion through 2034 — more than one-fifth of the bill’s total cost.[24]
The bill also effectively weakens some of the 2017 law’s guardrails meant to keep certain high-income professionals — like lawyers, consultants, and lobbyists — from claiming the deduction.[25] It also allows certain types of investors to newly qualify for the deduction, likely benefiting private equity firms.[26]
Proponents have argued that the pass-through deduction is needed to achieve “parity” with corporations facing a 21 percent tax rate. But in reality, pass-through businesses typically face lower effective tax rates than corporations even without the deduction.[27] Moreover, any business owners who believe they would be better off paying corporate tax rates can choose corporate tax treatment.[28]
Expanded Tax-Sheltering Opportunities Through Health Savings Accounts
Roughly 15 million people (and likely more) would lose health coverage and become uninsured by 2034 because of the reconciliation package’s Medicaid cuts, harmful ACA marketplace changes, and failure to extend enhanced premium tax credits.[29] The one health-related area where the bill would expand significantly is a tax shelter that does nothing to improve coverage or affordability: health savings accounts (HSAs) for people enrolled in high-deductible health plans.
HSAs offer a triple tax advantage: contributions are not taxed; contributions can be invested in stocks and bonds and rolled over indefinitely, with tax-free earnings; and withdrawals are not taxable if used to pay for qualified medical expenses. HSAs mostly benefit people with high incomes, who are better able to contribute and have a greater tax benefit per dollar contributed (since they are in higher tax brackets).[30] The bill includes a host of HSA expansions that combined cost more than $40 billion over ten years.
Additional Corporate Tax Breaks That Would Benefit Shareholders
The centerpiece of the 2017 tax law was a permanent, deep cut (more than corporate lobbyists had hoped to achieve) in the corporate tax rate, from 35 percent to 21 percent.[31] Subsequent research found that the benefits of the rate cut flowed largely to corporate shareholders,[32] more than 40 percent of whom are foreign investors.[33] The corporate rate cut is a major reason why 83 percent of the permanent tax cuts from the 2017 law flow to the wealthiest 1 percent of people.[34]
The bill not only leaves the permanent rate cut in place but reverses several business tax increases that Republicans included in the 2017 law to lower its cost and thereby help them fit in a deeper corporate rate cut.[35] While some of these changes may be reasonable on their own, their cost should be offset by increasing the corporate rate, rather than adding more cost to the package.
More High-Income Tax Cuts in Resolution of SALT Issue
A telling sign of Republican policymakers’ priorities in their reconciliation package is that their final, last-minute revisions to the bill were not designed to limit the harm to low- or moderate-income families, such as by reducing the Medicaid or SNAP cuts, but instead to allow high-income people to deduct more of their state and local taxes (SALT), which the 2017 tax law capped at $10,000.[36]
The common impression that filers affected by the SALT cap therefore fared relatively poorly under the 2017 law as a whole is mistaken. The 2017 law not only capped the SALT deduction but also substantially weakened the Alternative Minimum Tax (AMT), essentially eliminating the AMT for people with incomes below $1 million. Prior to the 2017 law, many people making roughly $400,000 to $600,000, especially in higher-tax states, owed the AMT, which operated as an effective cap on their state and local taxes. The combination of weakening the AMT and capping the SALT deduction was a win for most high earners in this range (particularly when coupled with other provisions, like the rate cuts). In fact, the 2017 law delivered the biggest average tax cut, measured as a share of pre-tax income, to households with incomes in the 95-99th percentiles, a group making roughly between $400,000 and $1 million.
Ironically, the Ways and Means-passed SALT provision, which raised the cap to $30,000 but only for filers making less than $400,000 (the increase phased out at incomes above this level), points to a mechanism that the Senate could employ to make the tax bill as a whole much better targeted and less fiscally irresponsible. This $400,000 limit should be used throughout the tax bill.
Unfortunately, House Republicans weakened the income limit on the expanded SALT cap, instead passing a larger $40,400 SALT cap for filers making up to $505,000, with a phaseout above that amount.[37] It’s important to keep in mind that all of the benefit of these last-minute changes flows to those with incomes above $400,000. House Republican leaders, therefore, used their final negotiations to give a bigger tax cut overall to give to this group of affluent people, while simultaneously leaving out of the Child Tax Credit expansion and cutting health care and food assistance for many of the people who deliver their packages, manicure their lawns, and clean their houses.
Bill Is Costlier Than Extending 2017 Tax Law
The tax provisions would cost $3.8 trillion through 2034, fully half a trillion dollars more than the $3.3 trillion cost of extending all the 2017 law’s expiring provisions through 2034.[38] The cost would be even higher without the bill’s cuts to premium tax credits (see below) and its more than $500 billion in cuts to clean energy tax credits,[39] which would raise energy costs for households and worsen health outcomes for communities facing high rates of pollution.[40] Many of those same communities would be disproportionately affected by the enormous cuts in health care and food assistance in the bill.[41]
The bill also uses various timing strategies to understate its likely true cost. For example, the new tax cuts proposed by President Trump, such as those on tips and car loans, expire at the end of 2028. Given that they are generally ill-conceived, it would be even worse if they were permanent, but excluding them altogether would be far preferable given the likelihood that they will not be allowed to expire.
The bill also includes several particularly egregious timing gimmicks. For example, it includes four years of “full expensing” for certain business costs, meaning that businesses can reduce their tax liability by deducting the full cost of investments related to research and development, equipment purchases, and physical structures immediately rather than over a number of years. Because of official scoring rules, the ten-year cost of four years of these provisions is far less than the first four years of making the same policies permanent, as the business community strongly favors.[42]
Another example concerns the 2017 tax law’s “opportunity zone” tax break, which lets investors defer taxes on pre-existing capital gains by “rolling” those gains into funds that invest in designated low-income areas, or opportunity zones. If investors keep that money in these funds for a certain number of years, they can qualify for lower taxes on their deferred capital gains and a permanent tax exemption on all capital gains on their opportunity zone investments. The bill extends the tax break but requires investors to realize their deferred capital gains in 2034, the last year of the current budget window. This would offset much of the revenue loss within the budget window, but large revenue losses would then resume in years after 2034.[43]
The Committee for a Responsible Federal Budget examined nuances of the timing and other factors in the bill and concluded that its ultimate cost, if all its provisions were eventually made permanent, would be $5.2 trillion, not $3.8 trillion.[44]
The legislation also will need to go to the Senate, which has allocated itself $5.3 trillion in tax cuts even before accounting for any timing gimmicks.[45] This means that this skewed, fiscally irresponsible tax bill could get even more irresponsible as it moves through the legislative process.
Bill Fails to Deliver for Families
The bill excludes millions of children from its increase in the Child Tax Credit, fails to extend premium tax credit enhancements that are vital to households buying private health coverage through the marketplace, and imposes unprecedented restrictions on households that include immigrants.
20 Million Children in Lower-Income Working Families Left Out of Child Credit Expansion
Since its inception in 1997, the Child Tax Credit has had a central problem with its design: the children who research shows would benefit the most from the credit — those in families with lower incomes — get the least.
Republicans as well as Democrats have recognized this problem. For example, the 2001 Bush tax cuts made the credit partially refundable, meaning that families whose credit exceeds their tax liability can receive part of the credit as a refund. And last year, 169 House Republicans voted for legislation championed by Ways and Means Chair Jason Smith and Senate Finance Committee Chair Ron Wyden that would have increased the credit for most of the children whose families currently receive less than the full $2,000-per-child credit because their families’ earnings are too low.
The bill breaks with this bipartisan history of progress and exacerbates the negative effects of this flawed design. While the bill increases the maximum credit from $2,000 per child to $2,500 for tax years 2025-2028,[46] this increase would do nothing for the 17 million children — the vast majority of whom are in working families — who don’t qualify for the current $2,000-per-child credit that higher-income families receive.[47] (See box, “Bill Fails to Fix Child Tax Credit Design Flaws That Penalize Lower-Income Families.”)
We estimate that up to 20 million children in working families with low and moderate incomes would be denied the maximum $2,500 Child Tax Credit that children in higher-income families would receive under the bill. These roughly 20 million children include about half of all Black children, about 4 in 10 American Indian or Alaska Native children, and more than 1 in 3 Latino children; these groups are overrepresented in low-paying work due to past and present hiring discrimination, inequities in educational and housing opportunities, and other sources of inequality. The roughly 20 million children denied the full $2,500 credit also include about 1 in 5 white and Asian American children, as well as more than 1 in 3 children living in rural (that is, non-metropolitan) areas and 1 in 4 children living in metropolitan areas.[48] (See Appendix Table 1 for estimates by state and race or ethnicity and Appendix Table 2 for estimates by state and rural or metropolitan residence.)
These roughly 20 million children have parents who work hard at jobs that pay little. They include 677,000 cashiers, 537,000 home health and personal care aides, 457,000 cooks, 442,000 housekeepers, 399,000 nursing assistants, and 352,000 truck drivers, among many others. An estimated 680,000 children of working veterans would also be left out of the full $2,500 credit.[49] (See Appendix Table 3 for children of working veterans by state and Appendix Table 4 for select occupations of parents and caregivers.)

To understand the impact of leaving lower-income households out of the Child Tax Credit expansion, consider two examples: a married couple with two children and an income of $400,000 and a single parent, also with two children, who earns $16,000 providing part-time child care for that family. Currently, the affluent family receives a $4,000 child credit, while their child care provider receives just $2,025. Under the Ways and Means bill, the affluent family would receive an additional $1,000 from the Child Tax Credit expansion, while their child care provider would get no increase. (See Figure 4.)
Not Extending Enhanced Tax Credits, Raising Health Premiums and Number of Uninsured
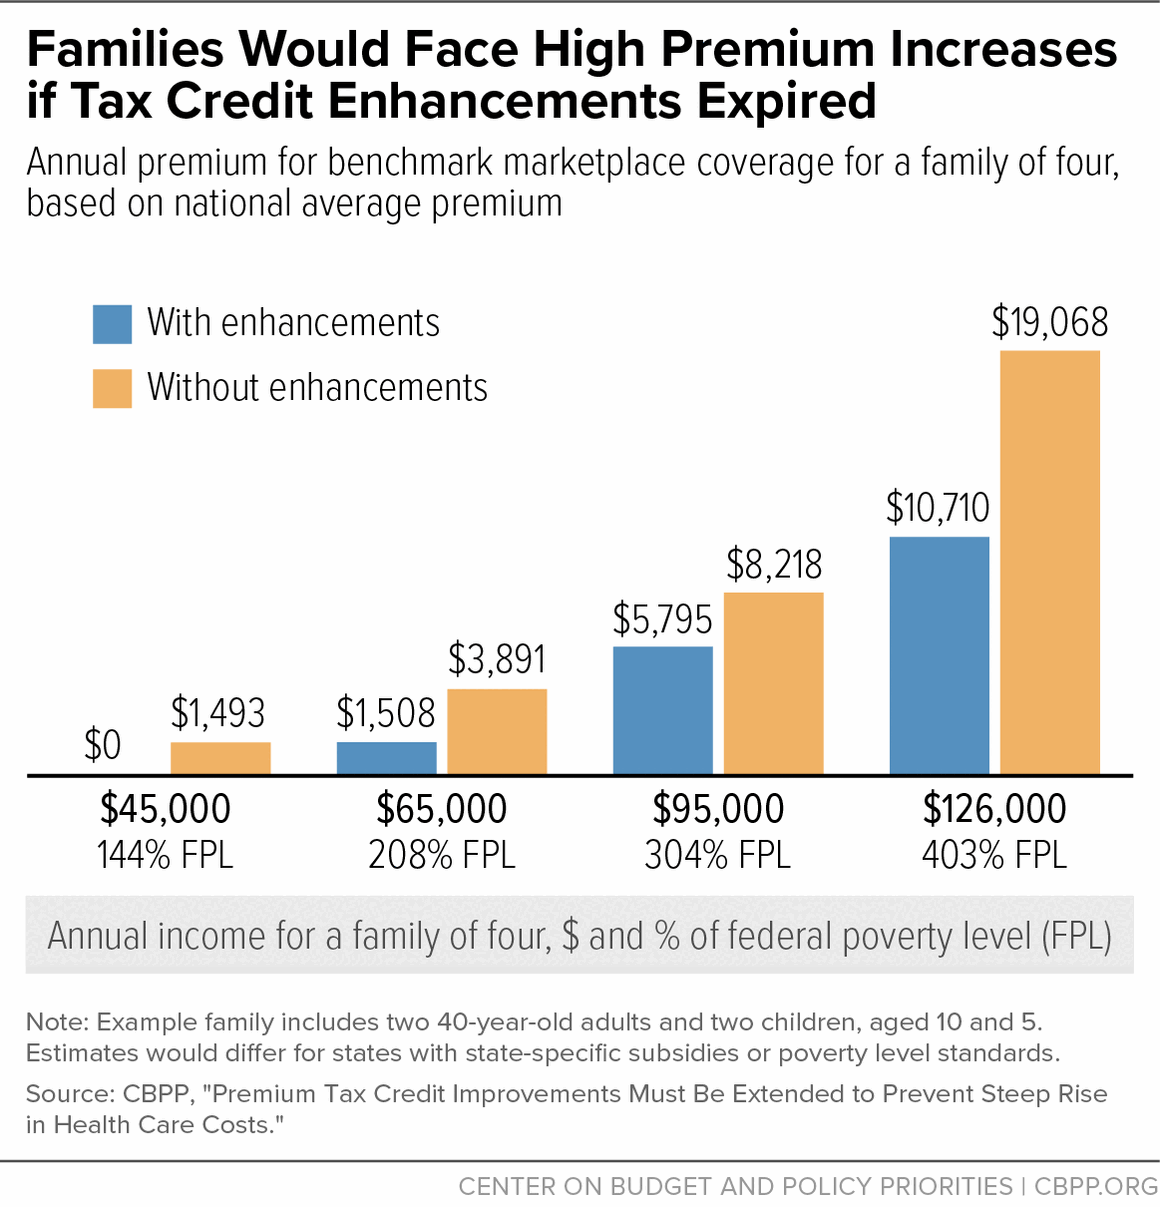
The bill fails to extend premium tax credit enhancements that are critical to making health coverage in the Affordable Care Act marketplace more affordable. If the enhancements expire, premiums will increase by an average of 79 percent for 22 million people, including 2.7 million small business owners.[50] (Figure 5 shows the average premium increases nationally for a family of four at different income levels; in some states the increases would be far higher.)[51] Roughly 4 million people would lose their health insurance and become uninsured as their out-of-pocket premium costs rose to unaffordable levels, CBO has estimated.[52] As a result, many would forgo necessary care or incur significant medical debt.



The bill also would eliminate the caps on the amounts that households must repay for their premium tax credits if their actual income for the year exceeds their projected income. This can happen, for example, when someone gets a higher-paying job or gets married partway through the year, even if they report the change immediately and their premiums are adjusted based on their new circumstances.[53]
The bill would also add red tape and exclude people from eligibility for premium tax credits, further driving down coverage. Specifically, it would end automatic re-enrollment by requiring all enrollees to take action to continue their coverage each year; eliminate the ability of people with modest incomes (up to about $23,000 a year for an individual) to enroll in marketplace coverage throughout the year; and revoke eligibility for premium tax credits for certain groups of immigrants who lawfully live and work in the U.S. (See below for more details.)
Unprecedented Tax Restrictions for Households That Include Immigrants
The 2017 tax law imposed new immigration-related restrictions on the Child Tax Credit, requiring, for the first time that children have a Social Security number (SSN). This change denied the credit to up to 1 million children.[54] The bill goes even further, taking the extreme step of stripping eligibility for the child credit from an estimated 4.5 million children who are U.S. citizens or lawful permanent residents if one of their parents file taxes without an SSN.[55]
The bill singles out immigrants for harsher treatment in several other ways. It imposes a tax on the remittances (money sent to family abroad) of many immigrants, while exempting citizens who undertake the same activity. It requires an SSN to claim new tax incentives the bill provides, such as deductions for certain tip and overtime income and a larger standard deduction for older adults. It denies certain education-related tax credits to people without an SSN. And it takes premium tax credits and Medicare away entirely from many immigrants who live and work in the U.S. lawfully, including refugees, people granted asylum, and victims of domestic violence, trafficking, and other serious crime, among others.[56](People without a documented immigration status are already ineligible.) Put together, this creates a tax system where many immigrants are required to pay higher effective tax rates than others with the same income.
Appendix
| Appendix table 1 | |||||||
|---|---|---|---|---|---|---|---|
Up to 20 Million Children in Working Families Would Get Less Than the Full $2,500 Child Tax Credit Proposed in the House Republican Bill | |||||||
| Estimates of children under 17 by state, race, and ethnicity for tax year 2026 | |||||||
| Total | White | Latino | Black | Asian | American Indian or Alaska Native | Another race or multiple races | |
| Total U.S. | 19.6 million | 6,882,000 | 6,354,000 | 4,421,000 | 599,000 | 588,000 | 966,000 |
| (Of all children in racial/ethnic group, percent left out) | 28% | 20% | 36% | 48% | 18% | 39% | 29% |
| Alabama | 353,000 | 140,000 | 25,000 | 170,000 | N/A | 3,000 | 13,000 |
| Alaska | 42,000 | 12,000 | N/A | N/A | N/A | 18,000 | N/A |
| Arizona | 503,000 | 121,000 | 285,000 | 29,000 | 7,000 | 60,000 | 15,000 |
| Arkansas | 243,000 | 129,000 | 31,000 | 66,000 | N/A | 5,000 | 12,000 |
| California | 2,411,000 | 304,000 | 1,697,000 | 154,000 | 155,000 | 65,000 | 81,000 |
| Colorado | 247,000 | 94,000 | 116,000 | 15,000 | 6,000 | 12,000 | 11,000 |
| Connecticut | 148,000 | 38,000 | 65,000 | 32,000 | 5,000 | N/A | 6,000 |
| Delaware | 54,000 | 16,000 | 9,000 | 23,000 | N/A | N/A | N/A |
| District of Columbia | 32,000 | N/A | 6,000 | 25,000 | N/A | N/A | N/A |
| Florida | 1,249,000 | 350,000 | 442,000 | 368,000 | 19,000 | 13,000 | 62,000 |
| Georgia | 764,000 | 202,000 | 116,000 | 390,000 | 13,000 | 10,000 | 38,000 |
| Hawai’i | 62,000 | 7,000 | 14,000 | N/A | 7,000 | N/A | 32,000 |
| Idaho | 119,000 | 82,000 | 28,000 | N/A | N/A | 6,000 | N/A |
| Illinois | 719,000 | 240,000 | 218,000 | 200,000 | 22,000 | 7,000 | 36,000 |
| Indiana | 429,000 | 251,000 | 62,000 | 80,000 | 8,000 | 3,000 | 27,000 |
| Iowa | 166,000 | 102,000 | 23,000 | 22,000 | N/A | 4,000 | 11,000 |
| Kansas | 171,000 | 95,000 | 39,000 | 17,000 | 4,000 | 4,000 | 12,000 |
| Kentucky | 308,000 | 221,000 | 16,000 | 46,000 | 5,000 | N/A | 19,000 |
| Louisiana | 411,000 | 131,000 | 22,000 | 231,000 | 5,000 | 6,000 | 17,000 |
| Maine | 56,000 | 48,000 | N/A | N/A | N/A | 3,000 | N/A |
| Maryland | 246,000 | 63,000 | 43,000 | 113,000 | 10,000 | N/A | 16,000 |
| Massachusetts | 246,000 | 85,000 | 97,000 | 33,000 | 15,000 | 4,000 | 14,000 |
| Michigan | 637,000 | 337,000 | 71,000 | 168,000 | 11,000 | 16,000 | 38,000 |
| Minnesota | 260,000 | 106,000 | 35,000 | 75,000 | 18,000 | 17,000 | 12,000 |
| Mississippi | 272,000 | 84,000 | 9,000 | 166,000 | N/A | N/A | 7,000 |
| Missouri | 400,000 | 247,000 | 30,000 | 84,000 | 4,000 | 7,000 | 30,000 |
| Montana | 68,000 | 44,000 | 6,000 | N/A | N/A | 16,000 | N/A |
| Nebraska | 102,000 | 51,000 | 26,000 | 13,000 | N/A | 4,000 | 6,000 |
| Nevada | 183,000 | 40,000 | 87,000 | 32,000 | 8,000 | 6,000 | 14,000 |
| New Hampshire | 41,000 | 32,000 | 5,000 | N/A | N/A | N/A | N/A |
| New Jersey | 382,000 | 108,000 | 156,000 | 86,000 | 16,000 | 3,000 | 15,000 |
| New Mexico | 176,000 | 26,000 | 116,000 | N/A | N/A | 38,000 | N/A |
| New York | 1,116,000 | 390,000 | 362,000 | 212,000 | 99,000 | 17,000 | 43,000 |
| North Carolina | 649,000 | 221,000 | 120,000 | 244,000 | 12,000 | 22,000 | 34,000 |
| North Dakota | 31,000 | 16,000 | N/A | N/A | N/A | 8,000 | N/A |
| Ohio | 779,000 | 429,000 | 60,000 | 204,000 | 10,000 | 12,000 | 67,000 |
| Oklahoma | 289,000 | 121,000 | 54,000 | 39,000 | 3,000 | 64,000 | 17,000 |
| Oregon | 204,000 | 111,000 | 62,000 | 8,000 | 6,000 | 11,000 | 10,000 |
| Pennsylvania | 678,000 | 328,000 | 139,000 | 147,000 | 19,000 | 10,000 | 40,000 |
| Rhode Island | 42,000 | 14,000 | 19,000 | 6,000 | N/A | N/A | N/A |
| South Carolina | 367,000 | 121,000 | 31,000 | 188,000 | 3,000 | 4,000 | 22,000 |
| South Dakota | 55,000 | 26,000 | 4,000 | N/A | N/A | 23,000 | N/A |
| Tennessee | 482,000 | 254,000 | 42,000 | 152,000 | 4,000 | 6,000 | 25,000 |
| Texas | 2,100,000 | 364,000 | 1,299,000 | 329,000 | 45,000 | 22,000 | 55,000 |
| Utah | 177,000 | 105,000 | 46,000 | N/A | N/A | 7,000 | 12,000 |
| Vermont | 22,000 | 20,000 | N/A | N/A | N/A | N/A | N/A |
| Virginia | 378,000 | 140,000 | 53,000 | 142,000 | 13,000 | 5,000 | 27,000 |
| Washington | 328,000 | 146,000 | 101,000 | 24,000 | 14,000 | 21,000 | 26,000 |
| West Virginia | 121,000 | 103,000 | 2,000 | 8,000 | N/A | N/A | 7,000 |
| Wisconsin | 297,000 | 151,000 | 51,000 | 61,000 | 9,000 | 12,000 | 14,000 |
| Wyoming | 27,000 | 17,000 | 5,000 | N/A | N/A | 3,000 | N/A |
Notes: Estimates count children under 17 in families that have more than $2,500 in earnings but income too low to receive the maximum $2,500 credit per child, excluding tax filing units where a parent or child appears likely to lack a Social Security number. State figures are rounded to the nearest 1,000. N/A indicates reliable data are not available due to small sample size. Figures may not sum to totals due to group overlap, lack of reliable data in certain cells, and/or rounding. Percentages under the “Total U.S.” row represent the share of all children under 17 in that racial/ethnic group getting less than the full proposed $2,500 Child Tax Credit. Individuals are classified as white only, not Latino; Latino (any race); Black only, not Latino; Asian only, not Latino; American Indian or Alaska Native alone or in combination with other races, regardless of Latino ethnicity (AIAN); or another race or multiple races, not Latino. Latino includes all people of Hispanic, Latino, or Spanish origin regardless of race. AIAN estimates are particularly sensitive to definition; AIAN figures here include those who share another race or ethnicity. (A total of 1.5 million children under 17 are identified as AIAN alone or in combination with other races, regardless of Latino ethnicity. If we apply the non-overlapping categories this report uses for other groups, about 520,000 children under 17 are considered AIAN alone, not Latino; an estimated 238,000 of these children would get less than the full proposed $2,500 Child Tax Credit.) Source: CBPP analysis of 2015 IRS Statistics of Income Public Use File for national total, allocated by state and race or ethnicity based on CBPP analysis of American Community Survey (ACS) for 2017-2019, using 2026 tax parameters and incomes adjusted to 2026 projected levels. Percentages listed under the “Total U.S.” row are children left out of the full proposed $2,500 Child Tax Credit as a share of the average 2017-2019 ACS population under 17 in each racial/ethnic group. We use January 2025 CBO projections to project 2026 tax parameters, adjust earnings and rental, interest, and dividend income for real growth through 2026, and adjust other income for inflation through 2026. | |||||||
| Appendix table 2 | |||
|---|---|---|---|
More Than One-Third of Children in Working Families Living in Rural Areas Would Get Less Than the Full $2,500 Child Tax Credit Proposed in the House Republican Bill | |||
| Estimates of children under 17 in working families, by state and rural (non-metropolitan) or metropolitan residence, tax year 2026 | |||
| Children in rural areas who would get less than full $2,500 credit | Of children in rural areas, percent who would get less than full $2,500 credit | Of children in metro areas, percent who would get less than full $2,500 credit | |
| Total U.S. (all states) | 3,332,000 | 35% | 27% |
| Alabama | 90,000 | 36% | 34% |
| Arizona | 39,000 | 48% | 32% |
| Arkansas | 103,000 | 43% | 33% |
| California | 51,000 | 34% | 28% |
| Colorado | 37,000 | 27% | 20% |
| Connecticut | 6,000 | 20% | 22% |
| Delaware | N/A | N/A | 28% |
| District of Columbia | N/A | N/A | 26% |
| Florida | 55,000 | 41% | 31% |
| Hawai’i | 18,000 | 32% | 19% |
| Idaho | 36,000 | 33% | 27% |
| Illinois | 96,000 | 33% | 26% |
| Indiana | 103,000 | 32% | 28% |
| Iowa | 70,000 | 27% | 23% |
| Kansas | 61,000 | 31% | 24% |
| Kentucky | 139,000 | 37% | 30% |
| Louisiana | 82,000 | 48% | 38% |
| Maine | 29,000 | 31% | 20% |
| Michigan | 120,000 | 35% | 31% |
| Minnesota | 70,000 | 26% | 20% |
| Mississippi | 148,000 | 43% | 38% |
| Missouri | 136,000 | 42% | 27% |
| Montana | 43,000 | 31% | 33% |
| Nebraska | 41,000 | 27% | 21% |
| Nevada | 14,000 | 27% | 28% |
| New Hampshire | 18,000 | 22% | 14% |
| New Jersey | N/A | N/A | 21% |
| New Mexico | 67,000 | 42% | 37% |
| New York | 89,000 | 36% | 29% |
| North Dakota | 18,000 | 20% | 17% |
| Ohio | 176,000 | 36% | 31% |
| Oklahoma | 112,000 | 38% | 29% |
| Oregon | 45,000 | 34% | 23% |
| Pennsylvania | 89,000 | 34% | 27% |
| Rhode Island | N/A | N/A | 22% |
| South Carolina | 78,000 | 52% | 32% |
| South Dakota | 35,000 | 32% | 21% |
| Texas | 275,000 | 39% | 29% |
| Washington | 46,000 | 30% | 20% |
| Wyoming | 19,000 | 21% | 20% |
Note: Estimates count children under 17 in families that have more than $2,500 in earnings but income too low to receive the maximum $2,500 credit per child, excluding tax filing units where a parent or child appears likely to lack a Social Security number. State figures exclude Alaska, Georgia, Maryland, Massachusetts, North Carolina, Tennessee, Utah, Vermont, Virginia, West Virginia, and Wisconsin due to lack of reliable data on metropolitan/non-metropolitan (metro/non-metro) residence. U.S. Total includes all states. N/A indicates entire state is metro. Under the Office of Management and Budget’s 2018 delineations, metro areas are generally defined as cities of 50,000 or more people and surrounding counties that contain or are strongly connected to that city by commuting. All other areas are considered non-metro. We use rural and non-metro interchangeably. Source: CBPP analysis of 2015 IRS Statistics of Income Public Use File (PUF) and U.S. Census Bureau’s 2017-2019 American Community Survey (ACS), using 2026 tax parameters and incomes adjusted to 2026 projected levels; Missouri Census Data Center’s Geocorr 2018 application. We use January 2025 CBO projections to project 2026 tax parameters, adjust earnings and rental, interest, and dividend income for real growth through 2026, and adjust other income for inflation through 2026. We start with a PUF-based estimate of children who would get less than the full $2,500 credit and allocate it to states and metro/non-metro areas using the ACS (column 2); to estimate state-level metro/non-metro population (for calculating columns 3 and 4), we use an average of the 2017-2019 ACS population. For each of 2,351 local geographic areas identified in the Census files, we use data from the Missouri Census Data Center’s Geocorr 2018 application on whether the area is metropolitan, non-metropolitan, or mixed, and, if mixed, what share of the population is non-metro under the Office of Management and Budget’s 2018 area definition. | |||
| Appendix table 3 | |
|---|---|
Roughly 680,000 Children of Working Veterans Would Get Less Than the Full $2,500 Child Tax Credit Proposed in the House Republican Bill | |
| Estimates of children under 17 by state | |
| Estimated number of children | |
| Total | 681,000 |
| Alabama | 16,000 |
| Alaska | 4,000 |
| Arizona | 20,000 |
| Arkansas | 12,000 |
| California | 52,000 |
| Colorado | 10,000 |
| Connecticut | N/A |
| Delaware | N/A |
| District of Columbia | N/A |
| Florida | 54,000 |
| Georgia | 27,000 |
| Hawai'i | 4,000 |
| Idaho | 7,000 |
| Illinois | 21,000 |
| Indiana | 15,000 |
| Iowa | 5,000 |
| Kansas | 9,000 |
| Kentucky | 14,000 |
| Louisiana | 17,000 |
| Maine | N/A |
| Maryland | 9,000 |
| Massachusetts | 6,000 |
| Michigan | 19,000 |
| Minnesota | 6,000 |
| Mississippi | 8,000 |
| Missouri | 17,000 |
| Montana | 5,000 |
| Nebraska | N/A |
| Nevada | 7,000 |
| New Hampshire | N/A |
| New Jersey | 4,000 |
| New Mexico | 6,000 |
| New York | 18,000 |
| North Carolina | 31,000 |
| North Dakota | N/A |
| Ohio | 27,000 |
| Oklahoma | 12,000 |
| Oregon | 8,000 |
| Pennsylvania | 22,000 |
| Rhode Island | N/A |
| South Carolina | 14,000 |
| South Dakota | N/A |
| Tennessee | 20,000 |
| Texas | 75,000 |
| Utah | 9,000 |
| Vermont | N/A |
| Virginia | 19,000 |
| Washington | 16,000 |
| West Virginia | 6,000 |
| Wisconsin | 10,000 |
| Wyoming | N/A |
Notes: Estimates count children under 17 in families that have more than $2,500 in earnings but income too low to receive the maximum $2,500 credit per child, excluding tax filing units where a parent or child appears likely to lack a Social Security number. Figures are rounded to the nearest 1,000. N/A indicates reliable data are not available due to small sample size; data are included in totals. Source: CBPP analysis of 2015 IRS Statistics of Income Public Use File for national total, allocated by state and veteran status based on CBPP analysis of American Community Survey (ACS) for 2017-2019, using 2026 tax parameters and incomes adjusted to 2026 projected levels. We use January 2025 CBO projections to project 2026 tax parameters, adjust earnings and rental, interest, and dividend income for real growth through 2026, and adjust other income for inflation through 2026. | |
| Appendix table 4 | |
|---|---|
Working Parents and Caregivers of Up to 20 Million Children Would Get Less Than the Full $2,500 Child Tax Credit Proposed in House Republican Bill | |
| Selected occupations of parents or other caregivers who would be eligible for a smaller credit for tax year 2026 because their incomes are too low | |
| Occupation | Parents or other caregivers in occupation |
| Cashiers | 677,000 |
| Home health and personal care aides | 537,000 |
| Cooks | 457,000 |
| Maids and housekeeping cleaners | 442,000 |
| Nursing assistants | 399,000 |
| Janitors and building cleaners | 393,000 |
| Waiters and waitresses | 377,000 |
| Truck and delivery drivers | 352,000 |
| Customer service representatives | 343,000 |
| Retail salespersons | 321,000 |
| Laborers and freight, stock, and material movers, by hand | 318,000 |
| Construction laborers | 304,000 |
| First-line supervisors of retail sales workers | 275,000 |
| Childcare workers | 235,000 |
| Stockers and order fillers | 226,000 |
| Landscaping and groundskeeping workers | 218,000 |
| Teaching assistants | 198,000 |
| Other agricultural workers | 183,000 |
| Food preparation workers | 176,000 |
| Carpenters | 170,000 |
| Secretaries and administrative assistants, except legal, medical, and executive | 168,000 |
| Miscellaneous production workers, including equipment operators and tenders | 165,000 |
| Receptionists and information clerks | 164,000 |
| Hairdressers, hairstylists, and cosmetologists | 150,000 |
| Other assemblers and fabricators | 142,000 |
| Other managers | 130,000 |
| Hand packers and packagers | 128,000 |
| Security guards and gambling surveillance officers | 127,000 |
| Office clerks, general | 122,000 |
| Elementary and middle school teachers | 118,000 |
| Food service managers | 117,000 |
| Preschool and kindergarten teachers | 111,000 |
| First-line supervisors of food preparation and serving workers | 103,000 |
Notes: Estimates count parents or other caregivers (both members of a couple if married) who are at least age 18, worked at least one week in the year, reported an occupation, and have more than $2,500 in family earnings but family income too low to receive the maximum $2,500 credit per child under 17, excluding tax filing units where a parent or child appears likely to lack a Social Security number. “Home health and personal care aides” combines 377,000 personal care aides (such as escorts for the elderly or those with disabilities) with 160,000 home health aides (such as in-home hospice attendants). Table shows all occupations with at least 100,000 workers getting less than the full proposed $2,500 credit per child under 17. Source: CBPP analysis of 2015 IRS Statistics of Income Public Use File for national total, allocated by occupation based on CBPP analysis of American Community Survey (ACS) for 2017-2019, using 2026 tax parameters and incomes adjusted to 2026 projected levels. We use January 2025 CBO projections to project 2026 tax parameters, adjust earnings and rental, interest, and dividend income for real growth through 2026, and adjust other income for inflation through 2026
| |
| Appendix table 5 | |
|---|---|
Extending and Expanding the Estate Tax Exemption Gives a Windfall to a Small Number of Wealthy Estates | |
| Estimates of estate tax returns filed in 2022, by state | |
| Estimated number of taxable returns | |
| Total | 3,170 |
| Alabama | 33 |
| Alaska | 0 |
| Arizona | 58 |
| Arkansas | 19 |
| California | 743 |
| Colorado | 40 |
| Connecticut | 47 |
| Delaware | N/A |
| District of Columbia | 13 |
| Florida | 379 |
| Georgia | 70 |
| Hawai'i | N/A |
| Idaho | N/A |
| Illinois | 95 |
| Indiana | 30 |
| Iowa | 26 |
| Kansas | 27 |
| Kentucky | 20 |
| Louisiana | 40 |
| Maine | N/A |
| Maryland | 43 |
| Massachusetts | 82 |
| Michigan | 56 |
| Minnesota | 41 |
| Mississippi | N/A |
| Missouri | 44 |
| Montana | N/A |
| Nebraska | 13 |
| Nevada | 27 |
| New Hampshire | 19 |
| New Jersey | 96 |
| New Mexico | 15 |
| New York | 243 |
| North Carolina | 38 |
| North Dakota | N/A |
| Ohio | 97 |
| Oklahoma | 18 |
| Oregon | 22 |
| Pennsylvania | 102 |
| Rhode Island | N/A |
| South Carolina | 35 |
| South Dakota | N/A |
| Tennessee | 46 |
| Texas | 211 |
| Utah | N/A |
| Vermont | N/A |
| Virginia | 75 |
| Washington | 58 |
| West Virginia | N/A |
| Wisconsin | 40 |
| Wyoming | N/A |
Notes: N/A indicates reliable data are not available due to small sample size; data are included in totals. Figures reflect net estate tax numbers. Source: IRS Statistics of Income estate tax data tables, Table 2, Selected Tax Computation Items, by State of Residence, filing year 2022, https://www.irs.gov/statistics/soi-tax-stats-estate-tax-filing-year-tables. | |
End Notes
[1] Chuck Marr, Samantha Jacoby, and George Fenton, “The 2017 Trump Tax Law Was Skewed to the Rich, Expensive, and Failed to Deliver on Its Promises,” CBPP, June 13, 2024, https://www.cbpp.org/research/federal-tax/the-2017-trump-tax-law-was-skewed-to-the-rich-expensive-and-failed-to-deliver.
[2] CBPP calculations based on Joint Committee on Taxation (JCT), “Distribution Of The Estimated Revenue Effects Of The Tax Provisions Of The Chairman's Amendment In The Nature Of A Substitute To The Budget Reconciliation Legislative Recommendations Related to Tax,” JCX-23-25, May 13, 2025, https://www.jct.gov/publications/2025/jcx-23-25/, and Tax Policy Center, T25-0042, T22-0100, and T22-0101. JCT’s revenue estimate of the tax provisions reflect the version of the legislation that passed through the Ways and Means Committee on May 14 and does not reflect certain amendments made before the final House floor vote, including a larger cap on state and local tax deductions (SALT).
[3] For 1 in 1,000 wealthiest estates, CBPP calculation based on IRS Statistics of Income estimates of estate tax returns filed in 2022 and CDC data on mortality in the United States for 2022; for $6.3 million, CBPP calculation for tax year 2026 using January 2025 Congressional Budget Office (CBO) projections.
[4] JCT, “Tables Related to the Federal Tax System as in Effect 2017 through 2026,” JCX-32r-18, April 24, 2018, https://www.jct.gov/publications/2018/jcx-32r-18/.
[5] JCT, “Estimated Revenue Effects Of Provisions To Provide For Reconciliation Of The Fiscal Year 2025 Budget,” JCX-22-25R, May 13, 2025, https://www.jct.gov/publications/2025/jcx-22-25r/.
[6] Committee for a Responsible Federal Budget (CRFB), “Adding Up the House Reconciliation Bill,” May 14, 2025, https://www.crfb.org/blogs/adding-house-reconciliation-bill.
[7] Estimate counts children under 17 in families that have more than $2,500 in earnings but income too low to receive the maximum $2,500 credit per child, excluding tax filing units where a parent or child appears likely to lack a Social Security number. CBPP analysis of 2015 IRS Statistics of Income Public Use File, using 2026 tax parameters and incomes adjusted to 2026 projected levels. We use January 2025 CBO projections to project 2026 tax parameters, adjust earnings and rental, interest, and dividend income for real growth through 2026, and adjust other income for inflation through 2026.
[8] Tax Policy Center, “T24-0082 - Distribution of Tax Units, Children, and Dependents by Size of Child Tax Credit (CTC), 2025,” December 10, 2024, https://taxpolicycenter.org/model-estimates/CTC-Dec-2024/T24-0082.
[9] Centers for Medicare & Medicaid Services (CMS), “2025 Marketplace Open Enrollment Period Public Use Files,” May 2025, https://www.cms.gov/data-research/statistics-trends-reports/marketplace-products/2025-marketplace-open-enrollment-period-public-use-files; Treasury Department, “U.S. Department of the Treasury Releases New Data Showing 3.3 Million Small Business Owners and Self-Employed Workers Covered by Affordable Care Act Marketplaces in 2022,” September 25, 2024, https://home.treasury.gov/news/press-releases/jy2608.
[10] Congressional Budget Office (CBO), letter from Phillip L. Swagel to Chairman Wyden, Ranking Member Neal, Senator Shaheen, and Congresswoman Underwood, December 5, 2024, https://www.cbo.gov/system/files/2024-12/59230-ARPA.pdf.
[11] Mathew Lisiecki et al., “New Estimates of the Number of United States Citizen and Legal Permanent Resident Children Who May Lose Eligibility for the Child Tax Credit,” Center for Migration Studies, April 24, 2025, https://cmsny.org/publications/number-of-children-who-may-lose-eligibility-for-the-child-tax-credit/.
[12] CBPP calculations based on JCT, JCX-23-25 and Tax Policy Center, T25-0042, T22-0100, and T22-0101. JCT’s revenue estimate of the tax provisions reflect the version of the legislation that passed through the Ways and Means Committee on May 14 and does not reflect certain amendments made before the final House floor vote, including a larger cap on state and local tax deductions (SALT).
[13] Katie Bergh, Catlin Nchako, and Luis Nuñez, “Expanded Work Requirements in House Republican Bill Would Take Away Food Assistance From Millions,” CBPP, May 13, 2025, https://www.cbpp.org/research/food-assistance/expanded-work-requirements-in-house-republican-bill-would-take-away-food; Katie Bergh and Dottie Rosenbaum, “House Agriculture Committee Proposal Would Worsen Hunger, Hit State Budgets Hard,” CBPP, May 13, 2025, https://www.cbpp.org/research/food-assistance/house-agriculture-committee-proposal-would-worsen-hunger-hit-state-budgets.
[14] Congressional Budget Office, “Energy & Commerce, Subtitle D, Part I – Medicaid: Preliminary Estimate,” May 12, 2024, https://d1dth6e84htgma.cloudfront.net/E_and_C_Markup_Subtitle_D_Part_I_5_12_25_4628d60c2a.pdf. CBO’s preliminary estimates do not reflect certain amendments made before the final House vote, which are expected to increase estimated coverage losses.
[15] Gbenga Ajilore, “With Economic Risks High, Here Are Three Facts to Remember About Recessions,” CBPP, April 17, 2025, https://www.cbpp.org/blog/with-economic-risks-high-here-are-three-facts-to-remember-about-recessions.
[16] Chuck Marr, “Yet Another Estate Tax Cut on Massive Inheritances Is a Poor Choice,” CBPP, March 11, 2025, https://www.cbpp.org/blog/yet-another-estate-tax-cut-on-massive-inheritances-is-a-poor-choice.
[17]CBPP calculation for tax year 2026 using January 2025 CBO projections.
[18]CBPP calculation based on IRS Statistics of Income estate tax data tables, Table 2, Selected Tax Computation Items, by State of Residence, filing year 2022, https://www.irs.gov/statistics/soi-tax-stats-estate-tax-filing-year-tables, and CDC data on mortality in the United States for 2022, https://www.cdc.gov/nchs/products/databriefs/db492.htm#Summary.
[19]JCT, “Estimated Revenue Effects Of Provisions To Provide For Reconciliation Of The Fiscal Year 2025 Budget,” JCX-22-25R, May 13, 2025, https://www.jct.gov/publications/2025/jcx-22-25r/.
[20]Chuck Marr and Samantha Jacoby, “Arguments Against Taxing Unrealized Capital Gains of Very Wealthy Fall Flat,” CBPP, September 11, 2024, https://www.cbpp.org/research/federal-tax/arguments-against-taxing-unrealized-capital-gains-of-very-wealthy-fall-flat.
[21] CBPP, “Large Share of Biggest Estates Includes Unrealized Capital Gains That Have Never Been Taxed,” https://www.cbpp.org/charts/large-share-of-biggest-estates-includes-unrealized-capital-gains-that-have-never-been-1.
[22] JCT, “Tables Related to the Federal Tax System as in Effect 2017 through 2026,” JCX-32r-18, April 24, 2018, https://www.jct.gov/publications/2018/jcx-32r-18/.
[23] Chuck Marr, Samantha Jacoby, and George Fenton, “The Pass-Through Deduction is Skewed to the Rich, Costly, and Failed to Deliver on Its Promises,” CBPP, June 6, 2024, https://www.cbpp.org/research/federal-tax/the-pass-through-deduction-is-skewed-to-the-rich-costly-and-failed-to-deliver.
[24] JCT, “Estimated Revenue Effects.”
[25] Samantha Jacoby, May 15, 10:32 a.m., https://x.com/jacsamoby/status/1922303906891141251.
[26] Brandon DeBot and Chye-Ching Huang, “The House Ways and Means Tax Bill Encourages Tax ‘Gaming,’ Adds Complexity, and Increases Filing Burdens on Low- and Middle-Income Families and Workers,” Tax Law Center, May 14, 2025, https://taxlawcenter.org/blog/the-house-ways-and-means-tax-bill-encourages-tax-gaming-adds-complexity-and-increases-filing-burdens-on-low-and-middle-income-families-and-workers.
[27] Kyle Pomerleau, “House Tax Bill Would Worsen Business Tax Parity,” American Enterprise Institute, May 16, 2025, https://www.aei.org/economics/house-tax-bill-would-worsen-business-tax-parity/.
[28] Samantha Jacoby, “Pass-Through ‘Parity’ Argument Is Misguided and Misleading,” CBPP, July 11, 2024, https://www.cbpp.org/research/federal-tax/pass-through-parity-argument-is-misguided-and-misleading.
[29] CBPP, “By the Numbers: House Bill Takes Health Coverage Away From Millions of People and Raises Families’ Health Care Costs,” May 19, 2025, https://www.cbpp.org/research/health/by-the-numbers-house-bill-takes-health-coverage-away-from-millions-of-people-and.
[30] Gideon Lukens, “Five Reasons Lawmakers Should Reject Expansions of Health Savings Accounts,” May 7, 2025, https://www.cbpp.org/blog/five-reasons-lawmakers-should-reject-expansions-of-health-savings-accounts.
[31] Chuck Marr, George Fenton, and Samantha Jacoby, “Congress Should Revisit 2017 Tax Law’s Trillion-Dollar Corporate Rate Cut in 2025,” CBPP, March 21, 2024, https://www.cbpp.org/research/federal-tax/congress-should-revisit-2017-tax-laws-trillion-dollar-corporate-rate-cut-in.
[32] Patrick J. Kennedy et al., “The Efficiency-Equity Tradeoff of the Corporate Income Tax: Evidence from the Tax Cuts and Jobs Act,” March 21, 2024, https://patrick-kennedy.github.io/files/TCJA_KDLM_2024.pdf.
[33] Steven M. Rosenthal and Livia Mucciolo, “Who’s Left to Tax? Grappling With a Dwindling Shareholder Tax Base,” Tax Notes, April 1, 2024, https://www.taxnotes.com/featured-analysis/whos-left-tax-grappling-dwindling-shareholder-tax-base/2024/03/29/7j9cr.
[34] Tax Policy Center, “Distributional Analysis of the Conference Agreement for the Tax Cuts and Jobs Act,” Table 3, December 18, 2017, https://taxpolicycenter.org/sites/default/files/publication/150816/2001641_distributional_analysis_of_the_conference_agreement_for_the_tax_cuts_and_jobs_act_0.pdf.
[35] These include provisions affecting limits on interest deductibility, investment expensing, research and development expensing, and tax rates affecting low-taxed foreign income of U.S. multinational corporations and certain income from exports.
[36] Eric Wasson and Nacha Cattan, “Johnson Said Deal Reached on Raising SALT Cap to $40,000,” Bloomberg, May 21, 2025, https://news.bloomberglaw.com/daily-tax-report/johnson-says-agreement-reached-on-40-000-salt-cap-increase-1.
[37] The $40,400 SALT cap and $505,000 income threshold are set for tax year 2026 and increase by 1 percent each year through 2033. There is also a retroactive SALT cap increase (to $40,000 for households making $500,000) for tax year 2025. The bill includes certain other provisions — including an itemized deduction limitation — that may limit the benefit of the SALT cap increase for high-income households.
[38] JCT, “Estimated Revenue Effects.”
[39] The final amendments to the House bill added significant further limitations to these credits even beyond the Ways and Means bill’s harsh cuts; JCT had not released updated revenue estimates as of publication.
[40] Trevor Higgins, “The House Republican Plan to Increase Gas and Electricity Prices,” Center for American Progress, May 16, 2025, https://www.americanprogress.org/article/the-house-republican-plan-to-increase-gas-and-electricity-prices/; Dan Lashof, Jillian Neuberger, and Matt Herbert, “Beyond Climate: 6 Big Benefits of the US Inflation Reduction Act,” World Resources Institute, August 12, 2022, https://www.wri.org/insights/inflation-reduction-act-benefits.
[41] Christopher P. Chen and Joshua M. Liao, “The Role of Medicaid in Addressing Climate Change and Climate-Related Inequity,” Health Affairs, March 10, 2023, https://www.healthaffairs.org/content/forefront/role-medicaid-addressing-climate-change-and-climate-related-inequity.
[42] Chuck Marr and Samantha Jacoby, “Corporate Lobby’s New Math Doesn’t Add Up for Kids,” CBPP, December 8, 2022, https://www.cbpp.org/research/federal-tax/corporate-lobbys-new-math-doesnt-add-up-for-kids#gimmick-1-a-timing-ploy-cbpp-anchor.
[43] George Callas, 6:02 p.m., May 13, 2025, https://x.com/George_A_Callas/status/1922412179250200786
[44] CRFB, “Permanent Ways & Means Bill Could Add $5.3 Trillion to Deficits,” May 13, 2025, https://www.crfb.org/blogs/permanent-ways-means-bill-could-add-53-trillion-deficits.
[45] Sharon Parrott, “New Budget Resolution Is Upside Down, Hurting Families the President Pledged to Serve to Shower Tax Cuts on the Wealthy and Powerful,” CBPP, April 2, 2025, https://www.cbpp.org/press/statements/new-budget-resolution-is-upside-down-hurting-families-the-president-pledged-to. The $5.3 trillion in tax cuts refers to the Senate budget plan’s $3.8 trillion cost of extending the 2017 law’s individual income and estate tax provisions plus continuing other unspecified tax policies like the current low rates on multinationals’ foreign profits (which the budget plan assumes costs nothing at all), and $1.5 trillion in additional tax cuts specified in the budget.
[46]In 2029 the credit would revert to $2,000, indexed for inflation. We project the value of the credit in 2029 would be $2,100, using January 2025 CBO projections.
[47] Tax Policy Center, T24-0082.
[48] Estimates count children under 17 in families that have more than $2,500 in earnings but income too low to receive the maximum $2,500 credit per child, excluding tax filing units where a parent or child appears likely to lack a Social Security number. CBPP analysis of 2015 IRS Statistics of Income Public Use File for national total, allocated by demographic group and geographic area based on CBPP analysis of American Community Survey (ACS) for 2017-2019, using 2026 tax parameters and incomes adjusted to 2026 projected levels. We use January 2025 CBO projections to project 2026 tax parameters, adjust earnings and rental, interest, and dividend income for real growth through 2026, and adjust other income for inflation through 2026.
[49] Ibid.
[50] Jared Ortaliza et al., “Inflation Reduction Act Health Insurance Subsidies: What is Their Impact and What Would Happen if They Expire?” KFF, July 26, 2024, https://www.kff.org/affordable-care-act/issue-brief/inflation-reduction-act-health-insurance-subsidies-what-is-their-impact-and-what-would-happen-if-they-expire/; CMS, op. cit.; Treasury Department, op. cit.
[51] Gideon Lukens and Elizabeth Zhang, “Premium Tax Credit Improvements Must Be Extended to Prevent Steep Rise in Health Care Costs,” CBPP, November 14, 2024, https://www.cbpp.org/research/health/premium-tax-credit-improvements-must-be-extended-to-prevent-steep-rise-in-health.
[52] Both the Urban Institute and CBO estimate around 4 million people becoming uninsured. See Jessica Banthin et al., “Who Benefits from Enhanced Premium Tax Credits in the Marketplace?” Urban Institute, June 17, 2024, https://www.urban.org/research/publication/who-benefits-enhanced-premium-tax-credits-marketplace; CBO, op. cit.
[53] Claire Heyison, “Republican Proposals Would Raise Taxes for Enrollees in Affordable Care Act Marketplaces,” CBPP, February 7, 2025, https://www.cbpp.org/blog/republican-proposals-would-raise-taxes-for-enrollees-in-affordable-care-act-marketplaces.
[54] Marco Guzman, “Inclusive Child Tax Credit Reform Would Restore Benefit to 1 Million Young ‘Dreamers’,” Institute on Taxation and Economic Policy, April 27, 2021, https://itep.org/inclusive-child-tax-credit-reform-would-restore-benefit-to-1-million-young-dreamers/.
[55] Lisiecki et al., op. cit. While these children would be eligible for the $500 credit for other dependents, families with low incomes who do not have tax liability don’t receive it.
[56] Allison Orris et al., “House Republican Health Agenda Cuts Coverage, Raises People’s Costs,” CBPP, May 21, 2025, https://www.cbpp.org/research/health/house-republican-health-agenda-cuts-coverage-raises-peoples-costs.