Chart Book: Tracking the Recovery From the Pandemic Recession
The COVID-19 pandemic precipitated a devastatingly sharp contraction of economic activity and huge job losses in early 2020, as government restrictions and fear of the virus kept people at home and businesses shut. Workers in industries and occupations that paid low wages and required face-to-face encounters — disproportionately women, workers of color, workers without a bachelor’s degree, and foreign-born workers — were particularly affected, experiencing massive employment and earnings losses.
Federal policymakers enacted substantial relief and recovery measures in 2020 and 2021 to support the economy and relieve hardship. These measures helped fuel an economic recovery beginning in May 2020 that made the deepest recession in the post-World War II era also the shortest. (According to the National Bureau of Economic Research, the acknowledged arbiter of business-cycle dating, the contraction in economic activity marking the pandemic recession lasted only two months: March and April 2020.) The expansion in economic activity in the recovery proved to be stronger and faster than initial projections, and by the end of 2023 job creation was well above and economic activity was slightly above their pre-pandemic projections.
The initial pessimistic projections for the recovery from the recession may have been colored by what happened in the Great Recession of 2007-2009, which at the time was by far the worst recession since the Great Depression and the recovery from which was disappointingly slow, with high unemployment lasting years after the economy began to grow. But the causes of and policy responses to the two recessions were quite different. In particular:
- A global financial crisis in 2008 turned what started out as a mild recession into the Great Recession, while a global public health crisis precipitated the pandemic recession.
- The recovery from the Great Recession was impeded by the lingering effects of a burst housing bubble and banking crisis on households’ income and wealth and on bank lending, which depressed growth in consumer spending and business investment. By contrast, the course of the pandemic economy was influenced by ebbs and flows in virus caseloads and the extent of voluntary and official lockdowns and social distancing measures to address the virus; when the health situation improved, business and consumer activity began to pick up quickly.
- Policymakers’ fiscal response to the Great Recession, notably the Troubled Asset Relief Program (TARP) and the 2009 Recovery Act, was large for its time and effective at arresting an even sharper downturn. But it was neither large enough nor sustained long enough to promote a rapid recovery with stronger job growth.
- The response to the pandemic recession, including the CARES Act and three other measures in March and April 2020, a December 2020 package, and the 2021 American Rescue Plan, was much larger, suggesting that policymakers had learned key lessons from the Great Recession experience.
- The Federal Reserve took similar monetary policy steps in both recessions, cutting its target interest rate for monetary policy effectively to zero and implementing large-scale asset purchases (quantitative easing). Without sufficient help from fiscal measures, however, expansionary monetary policy was unsuccessful at stimulating a rapid recovery or raising the inflation rate to the Fed’s policy target of 2 percent following the Great Recession. In contrast, these policies paired with strong fiscal measures supported a much faster recovery from the pandemic recession.
- In the recovery from the Great Recession, the Fed’s expansionary monetary policy was consistent with achieving both of the Fed’s dual-mandate goals of high employment and stable prices, which required lowering unemployment and raising the inflation rate. Initially this also was true in the recovery from the pandemic recession. But the emergence of inflation in 2021 created a more challenging environment for monetary policy, requiring efforts to bring down inflation while maintaining high employment. The Fed reversed its expansionary monetary policy in March 2022 and began raising its short-term interest rate target and reducing its holdings of long-term assets (quantitative tightening). The Fed stressed that it would take the steps necessary to keep higher inflation expectations from becoming entrenched.
This chart book tracks the pandemic economy, looking at both the macroeconomics (economic growth, employment, wages, and prices) and how different demographic groups have fared. Overall, the policy response was strong and effective in promoting a rapid economic recovery. From a jobs and growth standpoint, the economy was essentially healed by the end of 2023, and the groups that had experienced the largest losses in the recession had recouped a substantial share of their losses or erased them entirely. The overall number of jobs rose above pre-pandemic levels in June 2022 and in December 2023 was 5.0 million jobs higher than in February 2020. New challenges to maintaining an ongoing economic expansion arose following the emergence of high inflation in 2021 and rapidly tightening monetary policy in 2022, but the economy ended 2023 with high employment and falling inflation.
The chart book is arranged as follows:
Part I: Economic Growth and Employment in Recession and Recovery
- Pandemic Recession Deeper But Shorter Than Great Recession, Recovery Much Faster
- Relief Legislation, Better Virus Control Key to Solid Jobs Recovery
- Economic Growth Was Stronger Than Expected
- Labor Market Improved Much Faster Than Projected
- Unemployment fell faster than expected as the economy began to recover
- Early in the pandemic, joblessness was even worse than the official statistics indicated
- Employment and labor force participation rebounded, especially for prime-age workers
- Factors such as increased retirements and caregiving depressed labor force participation
Part II: How Different Groups Fared
Part III: Trends in Prices and Wages
- Inflation Rose Significantly in 2021
- Workers in Low-Paid Industries Saw Real Wage Gains, But Overall Wage Growth Did Not Drive Inflation
- Federal Reserve Took Steps to Fight Inflation While Maintaining High Employment
Part I: Economic Growth and Employment in Recession and Recovery
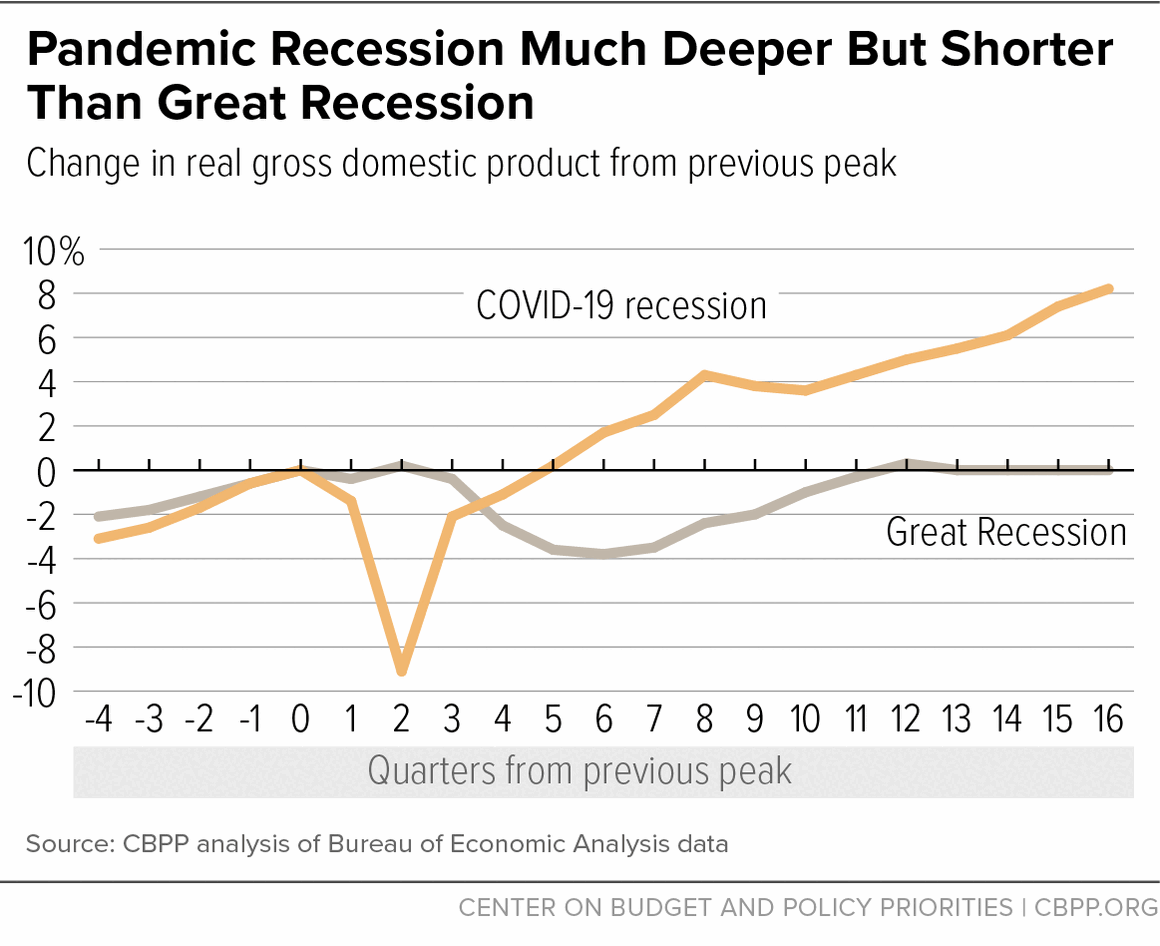
Pandemic Recession Deeper But Shorter Than Great Recession, Recovery Much Faster
Real gross domestic product (GDP) early in the pandemic fell abruptly to 9 percent below its level at the start of the recession — a much steeper decline than the nearly 4 percent drop in the deepest part of the Great Recession. But the recovery and relief legislation enacted in March and April 2020, plus the relaxation in May of some restrictions on economic activity, led to a sharp (though partial) bounce-back in GDP in the third quarter of 2020. Subsequent relief and recovery legislation enacted in December 2020 and early 2021 gave the recovery an added boost.
As a result, real (inflation-adjusted) GDP surpassed its pre-recession peak in the first quarter of 2021, less than a year after the trough of the recession. GDP rose above the Congressional Budget Office’s (CBO) February 2024 estimate of potential GDP — the high-employment, maximum sustainable level of GDP — from the third quarter of 2021 through the first quarter of 2022 and then again in the third and fourth quarters of 2023. In the Great Recession, in contrast, GDP didn’t surpass its previous peak for two years and the actual-potential gap did not close until the third quarter of 2018, more than eight years after the recession ended.
After its modest decline in the first half of 2022 as the Fed began tightening monetary policy to fight inflation, real GDP grew at a 2.7 percent annual rate in the third quarter and a 2.6 percent annual rate in the fourth. GDP in the fourth quarter was 0.7 percent higher than in the fourth quarter of 2021. After slowing to 2.2 percent at an annual rate in the first quarter of 2023 as the Federal Reserve continued to tighten monetary policy, and 2.1 percent in the second quarter, GDP rose at a brisk 4.9 percent rate in the third and 3.4 percent in the fourth.
Gross domestic income (GDI) is conceptually equivalent to GDP but is estimated from different source data (see note). The two do not always move in the same direction. When GDP fell in the first two quarters of 2022, heightening recession fears, GDI did not fall, and the average of GDP and GDI was just slightly lower in the second quarter of 2022 than in the fourth quarter of 2021.
GDI grew more slowly than GDP in the first three quarters of 2023, rising at 0.5 percent in the first quarter, 0.4 percent in the second, and 1.9 percent in the third, but in the fourth quarter it rose 4.8 percent The average of GDP and GDI rose at a 1.4 percent rate in the first quarter, 1.3 percent in the second, 3.4 percent in the third, and 4.1 percent in the fourth.
(Note: GDP and GDI measure the same aggregate economic activity: GDP uses the value of the goods and services produced, while GDI uses the income earned in producing those goods and services. Because they are measured with different source data, there is a statistical discrepancy between them due to measurement errors in estimating their components. Averaging the two may sometimes give a more accurate picture of economic growth than either alone does, but it is difficult to identify the source or sources of the measurement errors.
Relief Legislation, Better Virus Control Key to Solid Jobs Recovery
Total nonfarm employment fell by 1.4 million jobs in March 2020 and a staggering 20.5 million jobs in April, creating a 22 million jobs deficit since the start of the recession and largely erasing the gains from a decade of job growth. After that, however, every month except December 2020 saw job gains, and in December 2023 payroll employment was 5.0 million jobs above its February 2020 level. That is a significant improvement over CBO’s July 2020 quarterly projections, which showed payroll employment in the first quarter of 2023 still 4.7 million jobs below the level in the fourth quarter of 2019.
CBO’s July 2020 projections incorporated four early relief bills enacted in March and April of 2020 — most notably, the Families First Coronavirus Response Act and the CARES Act — that, along with a partial re-opening of the economy, cut the jobs deficit by a third through July 2020. The jobs recovery then stalled in the second half of 2020, after the emergency federal supplement to weekly unemployment insurance benefits expired and Congress didn’t enact a further stimulus and relief package until the end of December. Also in the latter part of 2020, the number of new COVID cases rose, as did Goldman-Sachs’ Effective Lockdown Index (a measure of official restrictions and social distancing behavior).
The December 2020 package and the March 2021 American Rescue Plan helped fuel job growth in 2021 that averaged 604,000 jobs a month despite the emergence of the delta and omicron variants of the virus later in the year. Higher vaccination rates, fewer official restrictions, and more relaxed social distancing behavior moderated the impact of the virus on the economy compared with earlier in the pandemic, when understanding of the virus was far more limited and there was no vaccine to protect the public.
Strong job growth continued through 2022, when 4.5 million jobs were added and the jobs deficit was erased, and through 2023, when another 3.0 million jobs were added. Relative to February 2020, total employment (private plus government) was up 5.0 million jobs (3.3 percent) in December 2023, private employment was up 4.8 million jobs (3.7 percent), federal government employment was up 110,000 jobs (3.9 percent), state government employment was up 85,000 jobs (1.6 percent), with 22,000 of those jobs in state education, and local government employment was up 14,000 jobs (0.1 percent) despite local education being down 18,000 jobs (0.2 percent).

Economic Growth Stronger Than Expected
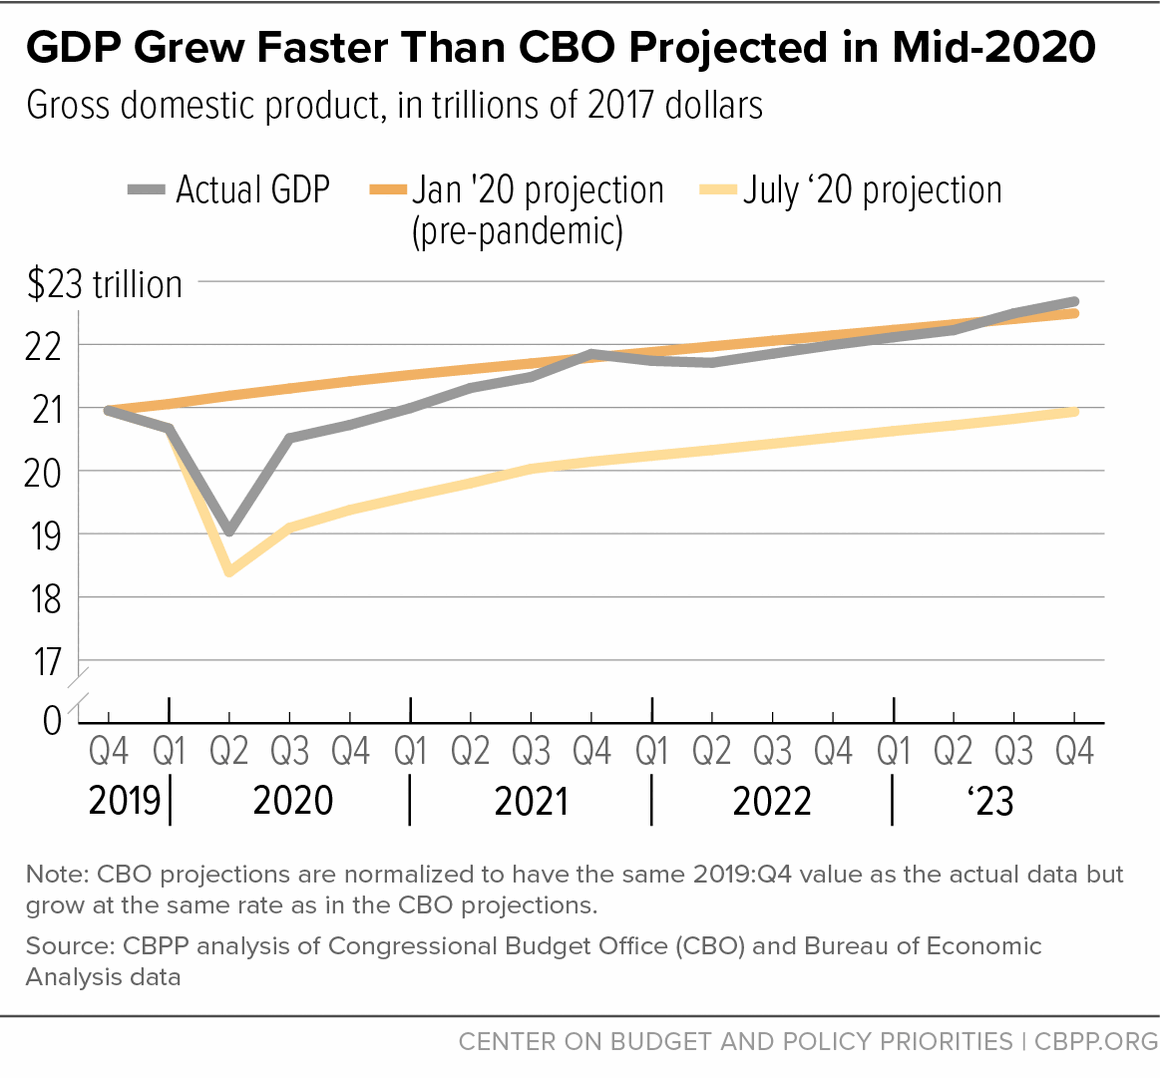
In July 2020, CBO published its first complete projections of GDP following the outbreak of the pandemic. They showed real GDP down 11.3 percent in the second quarter of 2020 and still down 5.2 percent in the fourth quarter of 2021, relative to CBO’s pre-pandemic January 2020 projections. CBO projections made in February 2021 were less pessimistic, showing GDP 2.3 percent below the pre-pandemic projection at the end of 2021. But in data available at the end of 2023, actual GDP generally tracked CBO’s pre-pandemic projections after the fourth quarter of 2021 and was above those projections at the end of 2023.
As mentioned above, CBO’s July 2020 projections incorporated the effects of the CARES Act and other measures enacted in March and April 2020. Information in the CBO report indicated that without those measures, the agency’s GDP projections would have been 12 percent below its pre-pandemic projection in 2020 and 9 percent below in 2021. With those and subsequent relief and recovery measures, the economy turned around more quickly and the actual shortfalls were far smaller: 5.8 percent and 1.1 percent, respectively.
With the boost provided by substantial relief and recovery measures, actual GDP was much closer to CBO’s pre-pandemic projection than to its July 2020 projection for most of the recovery.
Labor Market Rebounded Much Faster Than Projected
Like GDP and payroll employment, the official measures of household employment and unemployment (see Appendix for definitions) improved faster than initial projections. This is especially impressive because, as discussed below, some of these measures failed to fully capture the amount of labor market slack — that is, excess joblessness and underemployment — in the depths of the recession and early in the recovery.
Labor markets subsequently tightened considerably. At the end of 2023, the share of the population with a job and the labor force participation rate were above their pre-pandemic February 2020 rates for those in their prime working years (ages 25-54). For the overall population age 16 and older, however, the labor force participation rate and the share of the population with a job were still below their February 2020 rates. The unemployment rate for both groups was low but slightly above what it was in February 2020.
Employment normally recovers more slowly than output after recessions, usually because employers are uncertain about how permanent an increase in demand for goods and services will be and they have an underutilized existing workforce they can use initially to meet an increase in demand. Until recently, however, labor markets in the current recovery were tight, with demand for workers growing faster than the supply.
(Note: The Bureau of Labor Statistics monthly jobs report includes data from two surveys: a survey of nonfarm employers asking them how many jobs they have on their payroll and a survey of households asking them the employment status of people in the household. The data in this section are from the household survey, which — unlike the employer survey — includes unincorporated self-employed workers, unpaid family workers in family businesses, agriculture and related workers, and workers employed in private households. (As it does every January, BLS introduced new census population estimates into its household statistics for 2023, which the bureau warns can affect the comparability of the 2023 data to earlier data. Levels, like the total number of people employed, are more affected than ratios, like the unemployment rate.)
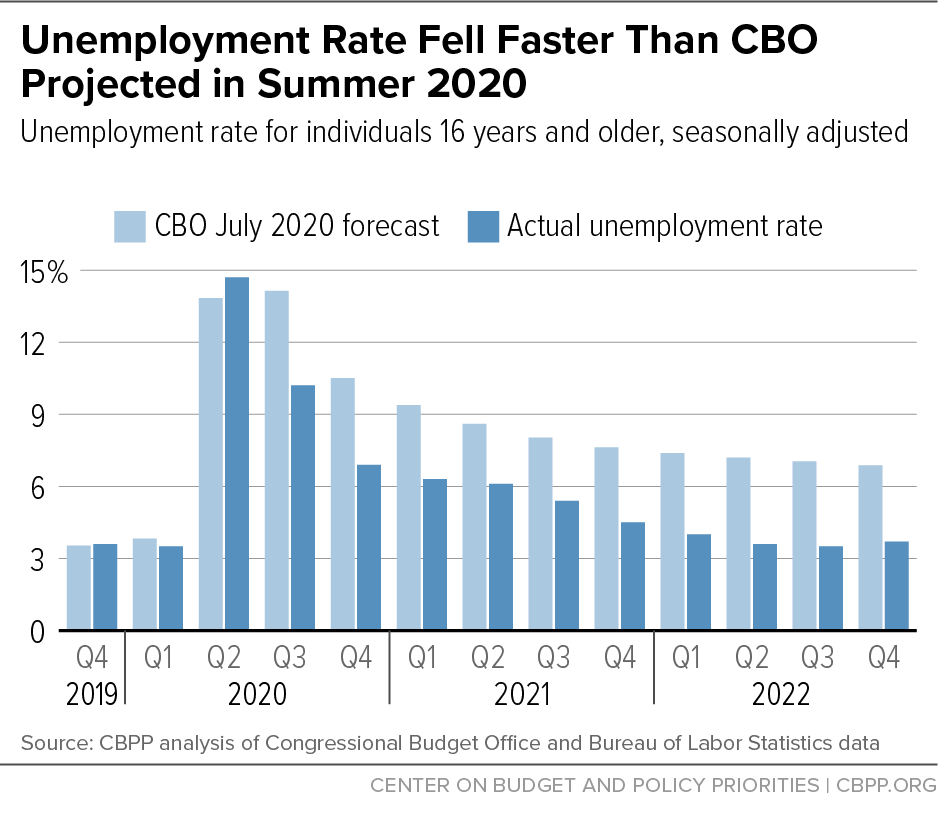
Unemployment fell faster than expected as the economy began to recover. In January 2020 (prior to the pandemic), CBO projected that the unemployment rate — which was 3.5 percent at the end of 2019 — would remain there through the first half of 2021, edging up to 3.6 percent in the second half. In July 2020, CBO projected the rate would average about 14 percent in the second and third quarters of 2020 and still be 7.6 percent in the fourth quarter of 2021. The actual unemployment rate averaged 13 percent in the second quarter of 2020 and then fell sharply, averaging 4.2 percent in the fourth quarter of 2021. In the first quarter of 2022, it averaged 3.8 percent, compared with 7.6 percent in CBO’s July 2020 forecast. In data available through the end of 2023, the unemployment rate was below 4 percent from February 2022 through December 2023, ranging between 3.4 and 3.9 percent and ending the year at 3.7 percent in December.
Early in the pandemic, joblessness was even worse than the official statistics indicated. The official unemployment rate was a poor indicator of labor market slack, especially in the first half of 2021, for two reasons. First, many workers were misclassified as employed who should have been classified as temporarily unemployed, such as in cases where their business was closed temporarily. This produced an undercount of unemployed workers and an overcount of employed workers, both of which were particularly large in the recession and early stages of the recovery.
Second, many workers who lost their jobs in the recession left the labor force entirely rather than look for work at a time when very few jobs were available, concerns about the health risks of working were high, and vaccines were not available yet. This depressed the labor force participation rate but did not raise the unemployment rate.
In April 2020, the official unemployment rate was a staggering 14.8 percent. Adding in the workers misclassified as employed would raise it to almost 20 percent. Also adding in the workers who still would have been in the labor force if the labor force participation rate had remained at its pre-pandemic level would raise the adjusted unemployment rate to almost 25 percent. These adjustments would also raise the number of people losing their job from February to April 2020 from 25.5 million to 33.0 million.

Employment and labor force participation have rebounded, especially for prime-age workers. By August 2022 the gap in the number of people working compared with February 2020 — which was at least 25.5 million in April 2020, as noted above — was eliminated, and in September 2022, household employment was 211,000 people higher than in February 2020. However, the gap reemerged briefly in November 2022, with 198,000 fewer people working than in February 2020. Following a surge in employment in December, household employment ended the year 619,000 workers higher than in February 2020. A year later in December 2023, household employment was 2.5 million higher than in February 2020.
Labor force participation has also returned closer to pre-pandemic levels. Between February and April 2020, the labor force participation rate for the population aged 16 and over fell from 63.3 percent to 60.1 percent. In 2022 it averaged 62.2 percent, and in 2023 it averaged 62.6 percent, reaching a high of 62.8 percent in September and November before falling to 62.5 percent in December. If it had been at its February 2020 rate in December 2023, 2.2 million more people would have been working or officially unemployed.

Part of this remaining gap in the size of the labor force would have existed even without the pandemic because of the aging of the population as most of the large baby-boom generation has entered its normal retirement years. Even if the labor force participation rates of different age groups had remained the same, the overall rate would have fallen as older workers, with lower participation rates, have grown as a share of the population.
Focusing on people in their prime working years can provide a clearer perspective on how much the labor market improved. In the recession trough in April 2020, people aged 25-54 were 48 percent of the population aged 16 and over and 47 percent of the labor force participation gap (excess exits) for that population. From February 2023 forward, the labor force participation rate of the 25-54 population exceeded its pre-pandemic level, erasing the participation gap for that group.

Prime-age workers’ labor force participation rate of 83.2 percent in December 2023 exceeded its pre-pandemic February 2020 rate of 83.0 percent. Rates as high as those seen in 2023 were last seen in the early 2000s.
Factors such as increased retirements and caregiving depressed labor force participation in 2020-21. While labor force participation partially rebounded from its low in April 2020 over a few months, it then hardly moved from the summer of 2020 through the end of 2021. Early in past recoveries, some workers stayed out of the labor force because they were still discouraged about job prospects. In the pandemic, retirement and caregiving were major contributors, according to a Federal Reserve analysis examining the change in labor force participation in the 16 and over population from February 2020 to December 2021 based on reasons given by respondents to the monthly employment survey for being out of the labor force.
In particular, the Fed analysis found that retirement — both “expected” retirements among baby boomers (as discussed above) and retirements above what would have been expected in the absence of the pandemic as people retired before they had planned to — accounted for half of the 1.9 percentage point drop in the labor force participation rate from February 2020 to December 2020. The decline in labor force participation by those younger than normal retirement age got public attention, but the Fed analysis also identified people in their early 70s who, at the beginning of the pandemic, pulled forward their retirement by a few years. Caregiving responsibilities among parents of school-age or younger children and non-parental responsibilities such as elder care accounted for another 0.8 percentage point. Other reasons for being out of the labor force, including COVID-19 fears, accounted for the rest.
These factors continued to depress labor force participation through 2021 in the Fed’s analysis. Retirement (both expected and early) accounted for 1.2 percentage points of the 1.6 percentage point gap between the February 2020 and December 2021 rates; caregiving accounted for the rest.

The labor force participation rate for the overall population age 16 and over was 63.3 percent in February 2020 but fell to 60.1 in April 2020. It rose from 61.3 to 62.2 percent from January 2021 to January 2022 and to 62.4 percent in January 2023. It was 62.5 percent in December 2023. Some of the improvement in the main household measures since the end of 2022 reflect the new population controls introduced in January 2023.
As discussed above, labor force participation among workers aged 25-54 increased substantially relative to that of the 16-and-over population, which is affected by the retirement of the baby boom generation; in December 2023 the 83.2 percent labor force participation rate for those aged 25-54 was 0.2 points above their 83.0 percentage point rate in February 2020. Older cohorts have significantly lower labor force participation rates than younger cohorts, but monthly data are quite volatile and it is difficult to discern trends.
Part II: How Different Groups Fared
The recession inflicted severe job losses on the economy overall, but the impacts — and the course of the subsequent recovery — were uneven across demographic groups.
Gender. Women experienced a greater percentage decline in employment and a slower recovery than men in the pandemic downturn, the opposite of what happened in the Great Recession. This reflects in part the large job losses in jobs requiring face-to-face interactions, which employ a disproportionate number of women. From February to April 2020, employment fell by 18.1 percent among women and 14.2 percent among men. While the job deficit for men was erased in early 2022, the job deficit for women was not erased until January 2023, although the difference between them was relatively narrow through much of the recovery.
Part of the reason why women’s percentage job loss relative to February 2020 exceeded men’s and their recent gains have lagged behind men’s may be that women, who make up 2 in 3 caregivers, shouldered a disproportionate share of the added burdens from school and day care closures (as well as other disruptions to child care) during the pandemic. Economist Claudia Goldin’s analysis has found, however, that women, especially those who could work from home, generally remained employed while taking on these additional caregiving responsibilities. While women’s employment losses and other labor market outcomes were worse than men’s in the pandemic economy, Goldin finds that educational attainment, industry of employment, and race were larger factors in explaining employment differences than gender alone.
By the end of 2023, the male-female gap had narrowed considerably since the trough of the recession, but a modest gap persisted. Among those aged 16 and over, men’s employment in December 2023 was 2.6 percent above its February 2020 level, while women’s employment was 0.5 percent above February 2020. (The 2023 numbers may have been affected by the January 2023 population updates to the survey used to estimate these trends.) Among those aged 25-54, men’s employment in December 2023 was 2.7 percent above February 2020, and women’s employment was 0.7 percent above its pre-pandemic level.

Black and Latina women had the largest employment gaps in the downturn. At the start of the pandemic, women’s job losses were not only larger than men’s but were highly concentrated among Latina and Black women, with employment of those in their prime working years (aged 25-54) falling by 21.4 percent and 16.1 percent, respectively, from February to April 2020. They did not reach pre-pandemic levels of employment until 2022. Latina women’s employment was 6.4 percent higher than its pre-pandemic level in December 2023 while Black women’s employment was 2.9 percent above its pre-pandemic level. White prime-age women workers had smaller job losses through most of the pandemic, but their employment was 0.6 percent below its February 2020 level in December 2023. Asian women’s employment was 9.9 percent higher in December 2023 than in February 2020.

Education. Adults without a bachelor’s degree had larger job losses during the recession — a decline of 19.3 percent between February and April 2020 — than adults with more education. They later recovered many of those early losses, but employment among these adults was still 3.2 percent below February 2020 levels in December 2023.
In contrast, job losses among adults with a bachelor’s degree or above were just 6.5 percent at their worst in April 2020. As a group, these highly educated adults had recovered all job losses as of July 2021, and in December 2023 their employment was 6.9 percent above February 2020.

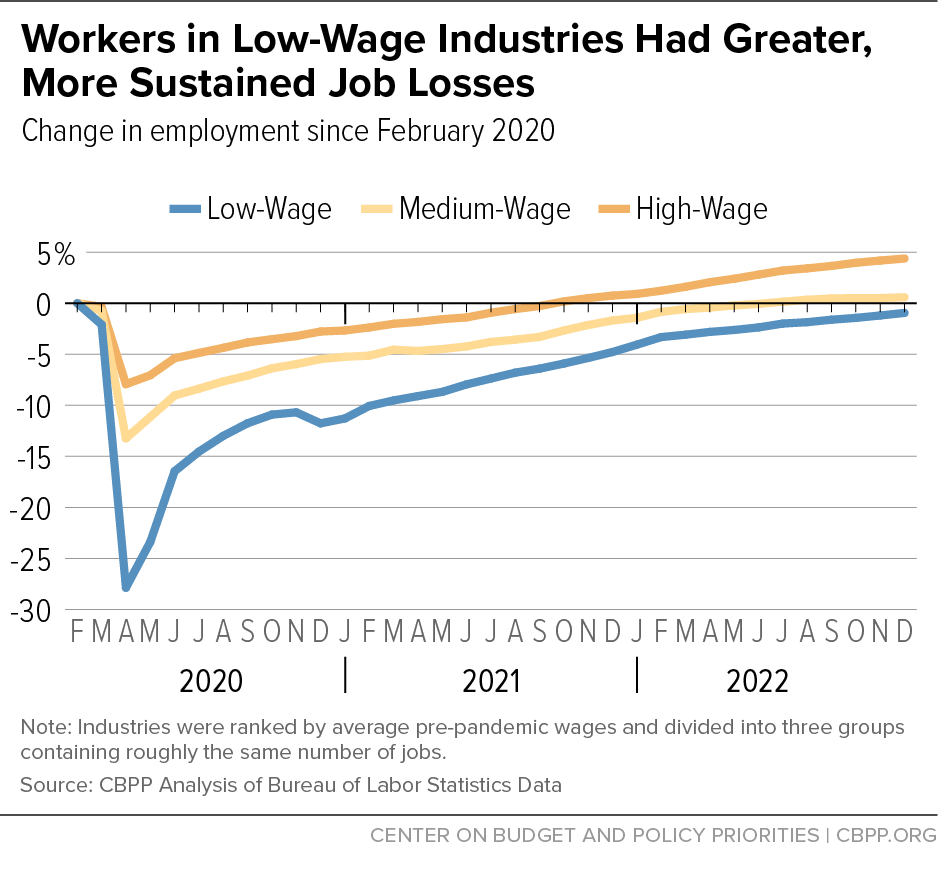
Industry. Payroll employment declined substantially across major industries in the pandemic, but job losses were greatest in industries paying the lowest wages. The number of jobs in the low-wage group fell by 27.9 percent from February to April 2020, compared to 13.2 percent for medium-wage industries and 7.9 percent for high-wage industries. (For this analysis, industries were ranked by average pre-pandemic wages and divided into three groups containing roughly the same number of jobs.)
High-wage industries not only lost fewer jobs but recovered them more quickly. By October 2020, job losses for this group had shrunk to 3.5 percent relative to February 2020. Employment for this group exceeded February 2020 levels by 0.2 percent as of October 2021, and by roughly 4.4 percent as of December 2022.
In contrast, despite a sharp rebound from April to June 2020, employment among workers in low-wage industries remained well below pre-pandemic levels in data available through the end of 2022. In June 2021, employment for this group was still about 8 percent below February 2020 levels, or roughly the same as high-wage industries suffered at their lowest point, in April 2020. In December 2022, employment in low-wage industries was still roughly 1.0 percent below February 2020.
(Note: This section contains no data for years after 2022 because the Bureau of Labor Statistics substantially revised the industry classifications on which this analysis was based.)
Race/ethnicity. A long history of structural racism and discrimination in employment and other areas has contributed to persistently higher rates of unemployment for Black and Latino workers than for white workers. In data back to the early 1970s, Black unemployment has been roughly twice as high — and Latino unemployment roughly one and one-half times as high — as white unemployment, on average, whether the economy was expanding or contracting. In particular, Black unemployment in the best of times has historically been not much better than white unemployment in the worst of times. These ratios were smaller in the worst of the pandemic recession when both rates rose substantially, but the magnitude of the gaps increased early in the recovery as white unemployment came down faster than Black unemployment. In April 2023, however, the Black unemployment rate fell to 4.8 percent, its lowest rate on record in data back to the early 1970s while the white rate was 3.1 percent, a ratio of roughly 1.5 to 1.
Unemployment rose substantially across all racial and ethnic groups in April 2020, with Latino and Black workers experiencing the highest unemployment rates at 18.9 percent and 16.9 percent, respectively. Federal relief and recovery legislation, together with the opening of the economy and measures to control the virus, spurred job growth and brought unemployment down closer to pre-pandemic levels for Latino, Black, and white workers by the end of 2021. But racial and ethnic disparities persisted: in December 2023, Black unemployment was 5.2 percent, and Latino unemployment was 5.0 percent, while white unemployment was 3.5 percent. (In February 2020, unemployment rates for the three groups were 6.1, 4.3, and 3.0 percent, respectively.)

Part III: Trends in Prices and Wages
The emergence of higher-than-expected inflation in 2021, which cast a pall over public perceptions of the economy, reflected both pandemic-specific factors (like supply-chain disruptions directly related to COVID-19) and a recovery that was much stronger and faster than expected, due in large part to robust federal relief and recovery measures. COVID-19 concerns and restrictions, however, limited the availability of services, and consumers increased their demand for goods, which suppliers had difficulty meeting. The consumption shift from services to goods increased inflationary pressures on goods significantly. Russia’s invasion of Ukraine also drove up costs for particular commodities, like energy, which Russia exports, and grain and fertilizer produced in and exported from the conflict region.
Providing less support for the recovery may have produced less inflation but at the cost of higher unemployment and greater hardship. Moreover, supply constraints likely would have raised inflation above pre-pandemic rates for a while in any case, as would the impact of the Russian invasion. The Federal Reserve, which has primary responsibility for bringing down inflation while maintaining a level of aggregate demand for goods and services consistent with a high level of employment announced steps to address inflation in late 2021.
Inflation Rose Significantly in 2021
For more than a decade before the pandemic, inflation was tame — too tame for the Federal Reserve, which struggled to achieve its policy target of 2-percent annual inflation, which it believed was appropriate for the smooth functioning of the economy. That changed in the spring of 2021, when growing demand for goods and services bumped up against pandemic-related supply constraints and inflation rose well above a 2-percent annual rate.
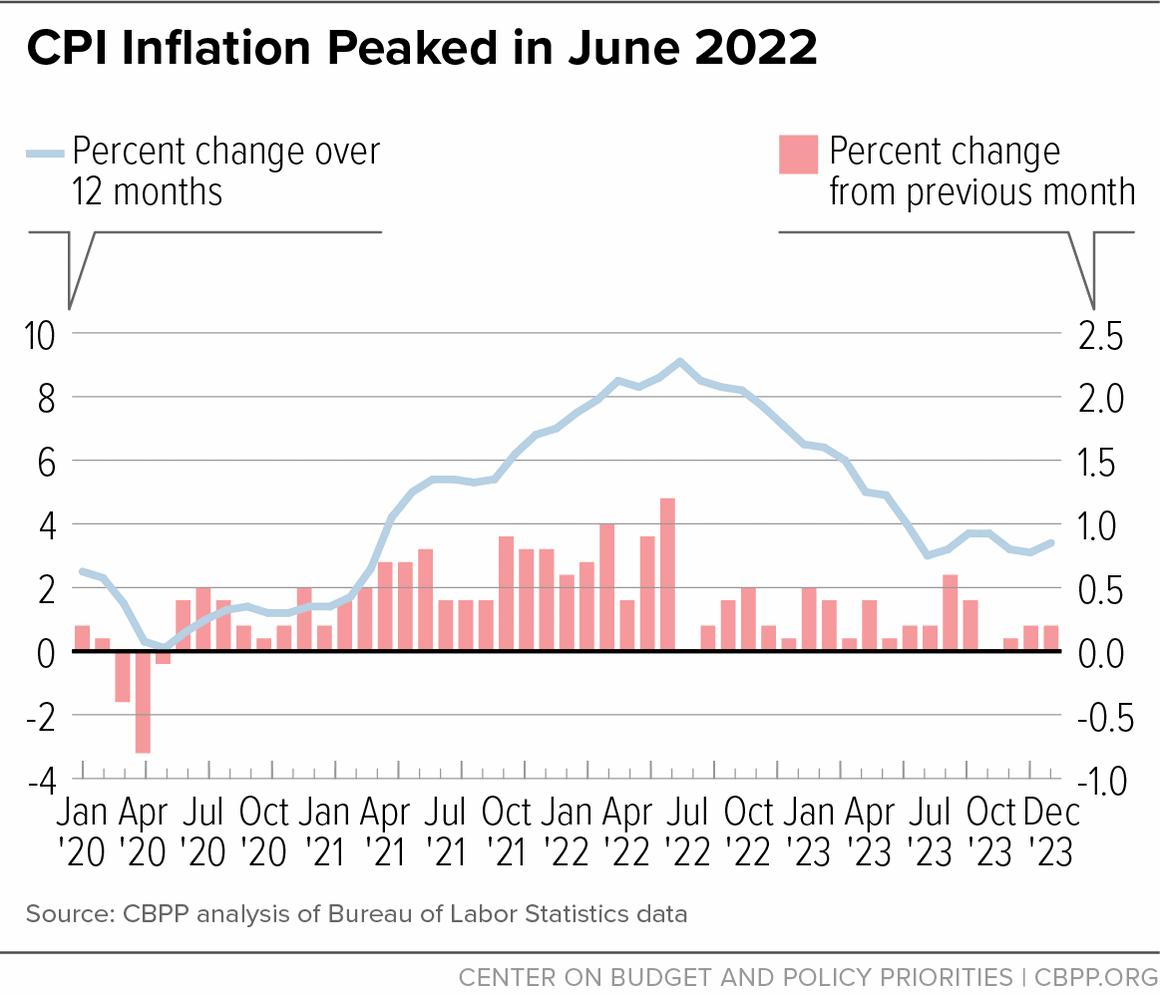
The Federal Reserve and many other analysts initially viewed the surge in inflation as arising from temporary factors, predicting that high inflation would be a “transient” phenomenon and that inflation would soon be back in the 2-percent range. Monthly inflation did cool some in the summer of 2021 but then rose back to an uncomfortably high rate, with the 12-month change in the consumer price index or CPI (that is, the change since the same month of the previous year) peaking at 9.1 percent in June 2022 as energy prices rose sharply. Inflation has come down significantly since. The 12-month change in the CPI was 3.2 percent in July 2023, and the monthly change was just 0.2 percent in June and July. After ticking up to 3.7 percent in August and September, the 12-month increase in the CPI was just 3.2 percent in October and 3.1 percent in November before edging up to 3.4 percent in December. In the three months ending in December 2023, the CPI rose at a 1.9 percent annual rate.
Workers in Low-Paying Industries Saw Real Wage Gains, But Overall Wage Growth Didn't Drive Inflation
A strong recovery and tight labor markets produced rapid wage growth (before adjusting for inflation) in 2021 and 2022, especially for the lowest-paid workers. That does not mean, however, that wage growth was the major driver of inflation. In fact, labor costs contributed much less than usual to the rise in costs per unit of output produced, while corporate profits contributed more than usual, cost data in the national income and product accounts show.
Large changes in the patterns of production distorted wage measures. Common measures of overall wage growth, like average hourly earnings in nonfarm payroll employment and hourly compensation (wages and benefits) in the nonfarm business sector, were difficult to interpret through the pandemic. That’s because they did not account for the effects of changes in the composition of employment, which can complicate the picture.
In the recession, when low-paid workers experienced disproportionate job losses, average earnings rose in part because the share of lower-paid workers in the workforce fell. In the recovery, the reverse happened: lower-paid workers returned to work, pulling average earnings down. That said, nominal average hourly earnings were up in the recovery — and by more than inflation for non-management workers in several industries that pay low wages.

(Note: Because of the substantial revisions to industry classifications noted above in the low-middle-high job-growth analysis, November 2022 is the last month of data available for consistent low-middle-high wage analysis.)
In the 12 months ending in November 2022, average hourly earnings in 20 industries with roughly 26 million non-management jobs (out of the economy-wide total of roughly 132 million private payroll jobs) grew faster than the 7.1 percent rise in the CPI from November 2021 to November 2022, according to an analysis of the same industries described above. Nine of those industries, with a total of roughly 20 million jobs, were in the industries paying low wages that experienced the largest and most sustained job losses since February 2020. While this disaggregation does not fully solve the composition problem, it indicates that wages rose faster than inflation in many low-paid jobs. (The number of jobs is measured by average employment over the 12 months ending in November 2022.)
From early 2021 into early 2023, average wage growth lagged behind inflation. Subsequently, however, the 12-month change in average hourly earnings exceeded inflation. In December 2023, average hourly earnings of all employees on private payrolls were 4.1 percent higher than a year earlier and those of non-management employees were 4.3 percent higher. Both increases were below peaks reached earlier in the year, but each was larger than the 3.4 percent increase in the consumer price index over the same period. Real average hourly earnings in December 2023 exceeded their pre-pandemic high.
Corporate profits constituted a larger-than-normal share of price increases and wages a smaller-than-normal share. Mechanically, shortages of goods like those that occurred in the recovery from the pandemic lead to higher prices in a market economy. This is the main mechanism by which demand becomes more aligned with available supply when there is a supply shock, generally regardless of how much competition businesses face. Businesses facing more demand than they can satisfy will raise their prices and likely make windfall profits during shortages. The inability of businesses to supply goods because of supply-chain bottlenecks could also lower demand for labor.
The constellation of forces at work in the recovery from the recession produced an anomalous pattern in the contribution of wages and profits to the price of a unit of output in the non-financial domestic corporate business sector, which is responsible for about three-quarters of private sector output. As Economic Policy Institute economist Josh Bivens has shown, more than half of the increase in price per unit in that sector from the trough of the recession in the second quarter of 2020 to the fourth quarter of 2021 was profit and less than 9 percent was labor compensation (these numbers reflect modest updates to the source data since the release of the Bivens analysis). The contribution of profits to the increase in price per unit of output from the trough of the recession to the fourth quarter of 2022 was still 34 percent, compared with 33 percent for labor. From 1979 to 2019, labor costs averaged about three-fifths of the average annual rate of increase in cost per unit and profits averaged less than a tenth. This indicates that price increases arising from pandemic-related shortages were a more important source of inflation than labor costs.
Federal Reserve Took Steps to Fight Inflation While Maintaining High Employment
The Federal Reserve has a mandate from Congress to pursue “stable prices” and “maximum employment.” Its primary tool is setting a target range for the federal funds rate, the short-term interest rate that banks charge each other for overnight loans. In the Great Recession and again in the pandemic, the Fed cut its target range to 0 to 0.25 percent; the Fed also conducted large-scale asset purchases (known as “quantitative easing”) to stimulate demand for goods and services. This policy was designed to achieve the maximum employment consistent with stable prices and to raise the inflation rate to the Fed’s 2-percent target for its preferred measure (the price index for personal consumption expenditures, which tends to rise a little more slowly than the CPI).
In the Great Recession these expansionary policies were consistent with achieving both objectives because the economy was not only well short of maximum employment but also falling short of the 2 percent inflation rate the Fed deemed consistent with sustained price stability. Stimulating aggregate demand was appropriate for achieving both goals and remained so well into the recovery from the Great Recession. It was also appropriate in 2020, when unemployment was too high and inflation was still too low.
Late in 2021, however, as unacceptably high inflation proved more persistent than the Fed and most analysts expected, the Fed faced the challenge of tightening monetary policy to fight inflation but without causing a recession. In December 2021 the Fed announced plans to taper and eventually end quantitative easing and to begin raising its target range for the federal funds rate. In March 2022 it ended its large-scale asset purchases and raised the target for the federal funds rate by 0.25 percentage point to a range between 0.25 and 0.50 percent. In May it raised the target by 0.50 percentage point to a range between 0.75 and 1.00 percent and in June it began reducing its holdings of long-term assets (quantitative tightening), which should influence longer-term interest rates more directly.
After raising its target range by 0.75 percentage point in June, July, September, and November of 2022, the Fed raised it by 0.5 percentage point in December and 0.25 percentage point at the beginning of February 2023. In March, while acknowledging that “recent developments [in the banking system, i.e., the second-largest bank failure in U.S. history and concern more would follow] are likely to result in tighter credit conditions for households and businesses and to weigh on economic activity, hiring, and inflation,” the Fed raised its target rate by another 0.25 percentage points in March and again in May 2023 to reach a range of 5.0 to 5.25 percent. The Fed maintained this range at its June 2023 meeting but raised it by another 0.25 points in July to its current range of 5.25 to 5.5 percent, where the Fed maintained it after its September and November meetings.
The Fed has the tools to reduce inflation by slowing aggregate demand growth but not the tools to address inflation arising from supply shortages, such as for food or energy, that temporarily push prices for particular goods and services well above normal levels. The appropriate monetary policy in the face of such supply shocks is to absorb the short-term rise in the price level from the shock as long as it does not change longer-term inflationary expectations, i.e., expectations about the underlying longer-run rate of increase in the price level). At the end of 2023, inflation had come down substantially and inflation expectations seemed under control, but the Fed was maintaining its tight monetary policy stance.
