The Trump Budget’s Massive Cuts to State and Local Services and Programs
President Trump’s 2018 budget would deeply cut federal funding for programs and services states and localities deliver. In 2027 alone, the cut would reach as much as $453 billion — 37 percent of state budgets at that time.[1] The cuts would begin in 2018, when states and localities would need to come up with an additional $44 billion — equivalent to more than 5 percent of state general fund budgets — to maintain the programs the federal government is shedding. (See Table 1.) More than half the states already have been struggling to close gaps between ongoing costs and revenues in their own budgets; most states could not replace that lost funding without raising taxes significantly. Instead, they’d very likely cut many key investments and public services.
- The budget would deeply cut four entitlement programs: the Supplemental Nutrition Assistance Program (SNAP, formerly food stamps), Medicaid, the Social Services Block Grant (SSBG), and Temporary Assistance for Needy Families (TANF). In 2027, the entitlement cuts would equal as much as $346 billion.
- The budget would eliminate several annually appropriated grants, including support for after-school programs and improvements in school instruction, the Community Services Block Grant, the Community Development Block Grant, home heating assistance to low-income households, and housing programs including HOME and Choice Neighborhoods. In 2027, the cuts in these discretionary grants would total about $82 billion.
The Trump budget would cut programs that directly assist low- and moderate-income families with children, people with disabilities, and seniors, as well as programs that improve the communities in which low- and moderate-income people live. Rather than giving low-income people supports to help them become self-sufficient, such as job training, child care, adequate nutrition, and health care, this budget would simply drive people deeper into poverty.
| TABLE 1 | |||
|---|---|---|---|
| President Trump’s FY 2018 Budget Proposal Cuts Aid to States and Localities | |||
| Type of Federal Funding | Estimated Change in State & Local Aid (in billions of dollars) |
||
| FY 2018 | FY 2027 | ||
| Discretionary* | -$28 | -$82 | |
| Entitlements | -$17 | -$346 | |
| Highway | +$1 | -$25 | |
| Total | -$44 | -$453 | |
Cuts in Entitlements
Entitlement (or mandatory) programs are ongoing; they continue as they are unless policymakers change them. The Trump budget would significantly change three entitlements — Medicaid, SNAP, and TANF — and eliminate a fourth, the Social Services Block Grant. The SNAP cost shift to the states and the Medicaid cuts wouldn’t begin until 2020 but would grow rapidly thereafter. In 2027, the total cut in entitlements would reach as much as $346 billion.[2] (See Table 2.)
Medicaid. Medicaid provides health coverage for children, adults (mostly in low-income working families), seniors, and persons with disabilities. In 2015, Medicaid provided coverage for 97 million low-income Americans over the course of the year.
President Trump’s budget assumes the huge Medicaid cuts in the House Republican bill to “repeal and replace” the Affordable Care Act (ACA) and dramatically enlarges them, bringing its total Medicaid cuts over the next decade to as much as $1.6 trillion. The House bill (the American Health Care Act) would cut Medicaid by effectively ending the ACA’s Medicaid expansion and converting virtually all of Medicaid to a per capita cap or block grant. That would mean 14 million fewer low-income people enrolled in Medicaid by 2026. The Trump budget would add an additional $610 billion in Medicaid cuts over ten years on top of the House bill, by lowering the growth rate of state funding under the per capita cap and letting states cut their programs in ways they aren’t permitted to do now. In 2027 the cut in Medicaid funding would be as much as $326 billion.[3]
The federal government and the states currently share Medicaid costs. The federal government picks up a fixed percentage of the cost — 57 percent, on average, although this percentage ranges from 50 percent in wealthier states to 75 percent in states with lower per-capita income. (For the Medicaid expansion, the federal government pays no less than 90 percent of the cost on a permanent basis). A per capita cap would end this federal-state partnership, leaving states responsible for all Medicaid costs above their capped funding. Across all states, approximately 17 percent of total state spending from their own revenue sources goes to Medicaid; the large drop in federal funding resulting from the per capita cap and other Medicaid cuts in the Trump budget would force states to raise taxes, limit Medicaid eligibility, or reduce the amount and types of Medicaid services provided.
| TABLE 2 | |||
|---|---|---|---|
| Reductions to Entitlement Programs Under President Trump’s FY 2018 Budget Proposal | |||
| Entitlement Program | Proposed Changes in Trump Budget (dollars in millions) |
||
| FY 2018 | FY 2027 | ||
| Supplemental Nutrition Assistance Program (SNAP): State Cost Share* | $0 | -$16,000 | |
| Social Services Block Grant Program (SSBG) | -$1,393 | -$1,677 | |
| Temporary Assistance for Needy Families (TANF) | -$1,785 | -$2,240 | |
| Medicaid | $14,000 | -$326,000 | |
| Total Cuts to Entitlement Programs | -$17,178 | -$345,917 | |
SNAP. SNAP is a highly effective program targeted to households that need help meeting basic food needs. It provides vital assistance to over 40 million low-income Americans. Benefits have always been federally financed, with states paying a share of the state-level administrative costs. That means that a poor person is eligible for the same level of food assistance regardless of whether they live in California, Mississippi, or anywhere else in the country.
The Trump budget would change that by requiring states to pay a share of SNAP benefits, rising from 10 percent in 2020 to 25 percent by 2027. This would shift $116 billion in SNAP benefit costs to states over the decade.[4] Such a cost shift would have significant consequences for states’ budgets. In Texas, for example, 25 percent of SNAP spending (about $1.3 billion per year) is roughly equivalent to the state’s share of the annual salary of 64,000 teachers. In Pennsylvania, 25 percent of SNAP spending (about $680 million per year) is more than twice what the state spends on community colleges.
Moreover, in every previous recession SNAP has expanded automatically as people lose income and more people need food assistance. The federal government has fully financed this expansion. But under the Trump budget, each additional federal dollar of SNAP to meet the needs of new applicants would require a state contribution — at a time when state budgets would already be strapped.[5]
TANF. TANF is a block grant to states, which they use to provide short-term income assistance, work and education programs, child care, and other crucial supports for poor families with children. The block grant funding has been frozen since its creation in 1996, so its buying power has shrunk by one-third due to inflation.
For 2018, the Trump budget would cut the TANF block grant by 10 percent (from $16.5 billion to $14.9 billion) and eliminate the TANF Contingency Fund, which provides extra help to states in hard economic times, bringing the total cut to $2.2 billion.[6] This would put families and children at risk of much greater hardship, which research shows can have a negative effect on children’s cognitive development.
Social Services Block Grant. This uniquely flexible funding source helps states meet the specialized needs of their most vulnerable populations, mainly low- and moderate-income children and people who are elderly or disabled. States use the $1.7 billion-a-year grant to support services designed to help people become more self-sufficient by providing child care assistance, to prevent and address child abuse and neglect, and to support community-based care for the elderly and disabled. Roughly 28 million people — about half of them children — receive services funded in whole or part by SSBG.
The Trump budget would eliminate SSBG, cutting funding by $1.4 billion in 2018 and $16.5 billion over the decade. The budget claims that this funding is duplicative, but it is not. States use it to provide services for which there is no dedicated funding stream or where the funding is inadequate. For example, 24 percent of SSBG spending in 2013 paid for services for vulnerable and elderly adults, which made up 61 percent of states’ total funding for adult day care services. Those services help elderly adults stay in their own homes rather than enter more costly institutional facilities. SSBG also paid for adult foster care and adult protective services.[7]
Non-Defense Discretionary Grants
Discretionary programs are those that are appropriated annually, that is, Congress each year must decide on and enact their funding. Grants to state and local governments make up a substantial portion of discretionary grants outside of defense. The Trump budget would eliminate or significantly reduce more than two dozen of them. The total cut to discretionary grants for states and localities would amount to $28 billion in 2018 and grow to about $82 billion a year by 2027. (See Table 3 for a list of some of the affected grants.)
Low Income Home Energy Assistance Program (LIHEAP). LIHEAP helps people in need pay their home energy bill. Approximately 6.3 million households received assistance in fiscal year 2014; nearly one-third had at least one member aged 60 years or older, about 38 percent had a member with a disability, and 19 percent had at least one child aged 5 or under.[8]
The Trump budget would eliminate LIHEAP, cutting the entire $3.4 billion annual funding.
HOME Investment Partnerships, Community Development Block Grant (CDBG), and Choice Neighborhoods. These three programs give flexible aid to poor rural and urban communities to improve basic infrastructure (such as streets and water and sewer lines), provide life-enriching services to youth and seniors, build and rehabilitate affordable housing for low-income residents, and promote economic development. CDBG also funds part of the Meals on Wheels program for homebound seniors.
The Trump budget would eliminate all three grants. Communities would lose $4.1 billion a year.
21st Century Community Learning Centers. This is the only federal funding source dedicated exclusively to after-school programs. Each state’s funding is based on its share of Title I funding for low-income students. The grants support after-school programs for high-poverty, low-performing schools to help students meet academic standards. They also support services such as drug and violence prevention programs, literacy programs, and related services to families of children served in the program.
The Trump budget would eliminate this program, cutting $1.2 billion in annual funding.
Supporting Effective Instruction State Grants. States and school districts use 30 percent of these funds to reduce class sizes and another 47 percent for professional development for teachers.[9] Research shows that the quality of a school’s teaching and leadership are the most significant school factors in promoting student learning. Congress renewed these grants (with some revisions) as part of the 2015 Every Student Succeeds Act — which passed with bipartisan support — to support the preparation, recruitment, and ongoing development of high-quality educators.
The Trump budget would eliminate this program, cutting $2.1 billion in annual funding.
Community Services Block Grant (CSBG). This grant assists low-income individuals — including the homeless, migrants, and the elderly — by providing services and activities to address poverty at the community level, such as employment, education, housing, nutrition, and emergency services. CSBG funding goes to states, Puerto Rico, U.S. territories, tribes, community action agencies, migrant farm worker agencies, and other organizations specified by states.
The Trump budget would eliminate this program, cutting $715 million in annual funding.
Senior Community Service Employment Program (SCSEP). SCSEP gives low-income, unemployed people over age 55 work experience in community service activities at public and nonprofit facilities. This serves as a bridge to unsubsidized employment for participating seniors, while providing over 40 million community service hours to public and nonprofit agencies.
The Trump budget would eliminate this program, cutting $400 million in annual funding.
Workforce Innovation and Opportunity Act (WIOA). Enacted in 2014, WIOA provides employment and training services for adults, dislocated workers, and youth through formula grants to states. It also provides state grants for adult education and literacy and vocational rehabilitation to help individuals with disabilities obtain employment. In addition, it includes other programs, such as Job Corps, and amendments to the Wagner-Peyser Act, which authorizes the Employment Service (ES).
The Trump budget would cut funding for WIOA job training formula grants by nearly $1.1 billion, from $2.7 billion to $1.6 billion. It would also cut total ES funding by $255 million.
Federal Emergency Management Agency (FEMA) state and local grants. These grants help governments at the state, local, tribal, and territorial levels — as well as high-risk transit systems, ports, and along borders — to prevent and respond to terrorism and other major disasters and emergencies. Their primary purpose is to enhance disaster preparedness; they are distinct from disaster grants that help states and localities respond to disasters after they occur.
The Trump budget would eliminate four FEMA grants, including the Emergency Food and Shelter Program and the National Domestic Preparedness Consortium, which supports training activities for first responders. In addition, it would reduce funding for six other grants — including the two largest FEMA grants, for which the budget proposes a 25 percent non-federal cost match.
Highway Trust Fund. The trust fund provides grants to states for highway and other surface transportation projects. Historically, these grants were funded primarily by federal taxes on gasoline and diesel fuels, but these taxes have fallen short of spending from the trust fund in recent years.[10] The Trump budget would reduce federal funding for transportation projects over the decade by lowering annual payments from the trust fund to match the amount collected from the dedicated taxes. The reduction in available grants would reach $25 billion in 2027.[11]
Cuts Would Grow Over Time
The Trump budget’s cuts in both entitlement and discretionary grants to state and local governments would grow over time:
- Entitlement grants. The requirement that states pay a share of SNAP costs begins with a 10 percent share in 2020 and rises to 25 percent by 2027. The Medicaid cuts would begin at $14 billion in 2018 and grow to as much as $326 billion by 2027. The SSBG and TANF cuts would also rise modestly over time. In total, these entitlement cuts would grow from $17 billion in 2018 to as much as $346 billion in 2027.
- Discretionary grants. For 2018, the budget would cut non-defense discretionary grants by $28 billion. The budget doesn’t specify funding levels for these grants after 2018. However, based on the budget’s overall cut in non-defense discretionary spending, we estimate that their cut in 2027 would be about $82 billion.
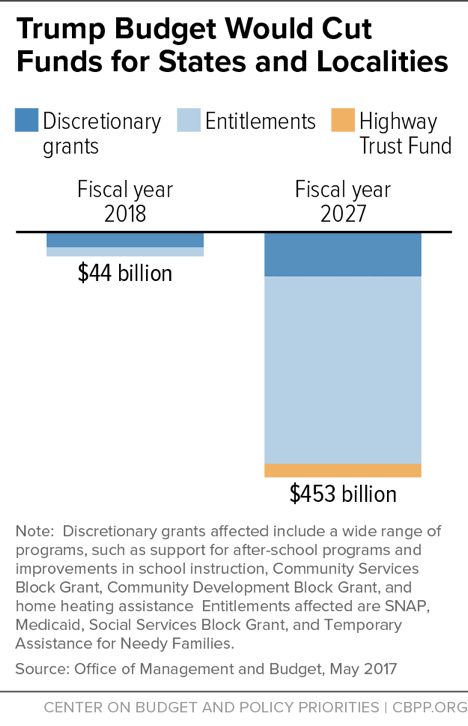
Thus, under the path in the Trump budget, total reductions in grants to state and local governments would rise from $44 billion in 2018 to as much as $453 billion in 2027. (See Figure 1.)
Federal Funding Cuts Would Lead to Fewer Services, Less Opportunity
Most of the program eliminations and reductions detailed here come from programs that help struggling families, children, the elderly, and persons with disabilities. The President says the budget’s “ambition is to unleash the dreams of the American people,”[12] but for the millions of people helped by the programs it targets for cuts or elimination, it would do just the opposite: drive them deeper into poverty. To realize their dreams of escaping poverty, they would need job training, child care, adequate nutrition, and health care — exactly what this budget would take away.
Some may argue that states could pay for and continue these programs, rather than have people suffer the consequences of losing assistance and opportunities. The President’s March budget blueprint repeatedly comments that various programs should be transferred the states, with no mention of additional resources to support the transfer. The reality, however, is that states lack the wherewithal to replace the magnitude of funds they would lose under the budget.
States operate under balanced budget requirements, and most states are already struggling to balance their current budgets, even before any federal cost shifts. Recent state revenue growth has been weaker than expected, leaving 28 states with budget shortfalls this fiscal year — more than in any year since 2010, in the aftermath of the Great Recession. Most of these states have responded by cutting services, using reserves, and taking other steps to balance their budgets.
Further, these mid-year budget problems appear to indicate continuing problems. More than half the states lack the revenue needed to maintain services at existing levels in 2018. All told, two-thirds of the states are facing or have addressed revenue shortfalls this year, next year, or both.
These revenue challenges are particularly disturbing because many states still have not fully recovered from the Great Recession, which caused state revenues to fall dramatically and resulted in sharp cuts in funding for schools and other state services. For instance, states have cut per-student funding for higher education by an average of 18 percent since before the recession, after adjusting for inflation.
The Trump budget would force states to scale back or eliminate services and programs for families, seniors, and people with disabilities. It is highly unlikely that any state could raise enough of its own funds to continue the programs at their current level.
Even if states did raise taxes to continue funding some affected programs, low-income residents would likely bear the consequences. State and local tax systems are, on the whole, regressive — that is, they constitute a larger share of income for lower-income residents than high-income ones. Shifting responsibilities for funding services from the federal government, which has a progressive tax system, to states and localities would likely increase the burden on many of the same low-income people at risk of losing services.
Could States and Localities Replace the Lost Federal Funds?
The Trump budget’s $44 billion cost shift to states and localities in 2018 represents 5.4 percent of state general fund spending. That is roughly the amount that all states together collect from their corporate income taxes, one of their three major revenue sources.
The proposed cuts grow to the equivalent of 37 percent of state general fund budgets by 2027. That percentage cut represents significantly more than all states together collect from their sales taxes, their second largest revenue source. It represents about 80 percent of their largest revenue source, the personal income tax.
States would have to enact a substantial tax increase just to replace the 2018 cuts. And over time, the ever-increasing tax increases required to replace the growing federal cuts would be unprecedented and extremely unlikely to happen.
Some of the federal funding cuts would fall on programs run by localities. They, too, would be unable to find the revenue to replace the lost federal funds. Property taxes and funds from state governments are the major revenue sources for localities, comprising 64 percent of their budgets. But 46 states and the District of Columbia limit local governments’ ability to raise property taxes. Localities would undoubtedly look to the state for additional funding, but historically, state aid drops when states themselves have budget shortfalls.
In short, neither states nor localities would be able to support with their own funds the programs that the federal government would shed. Instead, the programs would be cut.
| TABLE 3 | |||
|---|---|---|---|
| Selected Discretionary Grants to State and Local Governments Eliminated or Reduced Under President Trump’s FY 2018 Budget Proposal, Dollars in Millions | |||
| Eliminated or Reduced Grants* | FY 2017 Allotments | Proposed FY 2018 Allotments | Dollar Change Under President’s Proposal |
| Rural Water and Waste Disposal Program | $571 | $0 | -$571 |
| Economic Development Assistance Programs | $237 | $0 | -$237 |
| 21st Century Community Learning Centers | $1,192 | $0 | -$1,192 |
| Supporting Effective Instruction State Grants | $2,056 | $0 | -$2,056 |
| Community Services Block Grant (CSBG) | $715 | $0 | -$715 |
| Low Income Home Energy Assistance Program (LIHEAP) | $3,390 | $0 | -$3,390 |
| Community Development Block Grant (CDBG) | $3,000 | $0 | -$3,000 |
| HOME Investment Partnerships | $950 | $0 | -$950 |
| Choice Neighborhoods | $138 | $0 | -$138 |
| Abandoned Mine Reclamation | $132 | $20 | -$112 |
| State Criminal Alien Assistance Program | $210 | $0 | -$210 |
| Senior Community Service Employment Program | $400 | $0 | -$400 |
| Transportation Investment Generating Economic Recovery (TIGER) grant program | $500 | $0 | -$500 |
| Appalachian Regional Commission | $152 | $27 | -$125 |
| Institute for Museum and Library Services | $231 | $23 | -$208 |
| Neighborhood Reinvestment Corporation | $140 | $27 | -$113 |
| Delta Regional Authority | $25 | $3 | -$22 |
| Denali Commission | $19 | $7 | -$12 |
| Northern Border Regional Commission | $10 | $1 | -$9 |
| Eliminated Federal Emergency Management Agency (FEMA) grants | $229 | $0 | -$229 |
| FEMA State Homeland Security Grant Program and Urban Area Security Initiative: 25 percent state cost share | $1,102 | $827 | -$275 |
| Workforce Innovation and Opportunity Act (WIOA) Title I formula grants | $2,710 | $1,630 | -$1,080 |
| Employment Service (Wagner-Peyser) | $691 | $436 | -$255 |
| Environmental Protection Agency (EPA) Categorical grants | $1,066 | $597 | -$469 |
| Mass Transit Capital Investment Grants | $2,413 | $1,232 | -$1,181 |
| TABLE 4 | |||||||
|---|---|---|---|---|---|---|---|
| Current Value of Selected State Grants Eliminated Under President Trump’s FY 2018 Budget Proposal, Dollars in Millions | |||||||
| State | 21st Century Community Learning Centers | Supporting Effective Instruction (SEI) State Grants | Community Services Block Grants (CSBG) | Low Income Home Energy Assistance Program (LIHEAP) | Social Services Block Grant (SSBG)* | Community Development Block Grants (CDBG) | HOME Investment Partnerships Program |
| Alabama | $18.3 | $32.7 | $12.9 | $44.6 | $23.8 | $40.3 | $12.6 |
| Alaska | $5.8 | $9.7 | $2.6 | $10.2 | $3.6 | $4.2 | $3.5 |
| Arizona | $25.4 | $32.5 | $5.7 | $20.7 | $33.4 | $49.3 | $15.6 |
| Arkansas | $11.9 | $19.8 | $9.6 | $26.8 | $14.6 | $23.4 | $7.8 |
| California | $136.6 | $227.9 | $62.7 | $170.7 | $191.7 | $355.2 | $127.5 |
| Colorado | $11.6 | $22.9 | $6.1 | $50.9 | $26.7 | $33.6 | $13.0 |
| Connecticut | $9.6 | $19.2 | $8.5 | $78.6 | $17.6 | $35.5 | $10.7 |
| Delaware | $5.8 | $9.7 | $3.7 | $12.0 | $4.6 | $6.4 | $4.1 |
| District of Columbia | $5.8 | $9.7 | $11.6 | $10.4 | $3.3 | $13.7 | $3.8 |
| Florida | $63.5 | $93.4 | $20.4 | $71.0 | $99.3 | $131.4 | $44.6 |
| Georgia | $40.3 | $54.6 | $18.9 | $56.2 | $50.0 | $76.6 | $25.2 |
| Hawaii | $5.8 | $9.7 | $3.7 | $5.1 | $7.0 | $12.1 | $5.2 |
| Idaho | $5.8 | $9.7 | $3.7 | $19.0 | $8.1 | $11.5 | $4.0 |
| Illinois | $51.8 | $83.4 | $33.2 | $167.0 | $63.0 | $148.8 | $40.5 |
| Indiana | $19.8 | $35.0 | $10.2 | $75.6 | $32.4 | $60.5 | $18.7 |
| Iowa | $7.3 | $16.0 | $7.6 | $53.6 | $15.3 | $33.1 | $8.0 |
| Kansas | $8.5 | $16.3 | $5.7 | $33.5 | $14.3 | $23.8 | $7.6 |
| Kentucky | $16.5 | $32.1 | $11.9 | $48.5 | $21.7 | $39.0 | $13.0 |
| Louisiana | $22.4 | $46.3 | $16.3 | $42.4 | $22.9 | $43.8 | $12.8 |
| Maine | $5.8 | $9.7 | $3.7 | $37.7 | $6.5 | $16.4 | $4.2 |
| Maryland | $17.2 | $29.7 | $9.7 | $73.9 | $29.4 | $44.8 | $12.4 |
| Massachusetts | $17.9 | $37.2 | $17.4 | $146.9 | $33.3 | $91.2 | $24.1 |
| Michigan | $36.3 | $80.8 | $25.8 | $157.5 | $48.6 | $110.9 | $28.6 |
| Minnesota | $12.8 | $27.8 | $8.5 | $114.2 | $26.9 | $47.7 | $13.3 |
| Mississippi | $13.7 | $30.3 | $11.2 | $29.6 | $14.7 | $26.7 | $8.0 |
| Missouri | $18.4 | $35.3 | $19.5 | $73.6 | $29.8 | $57.0 | $17.1 |
| Montana | $5.8 | $9.7 | $3.4 | $19.3 | $5.1 | $7.6 | $3.8 |
| Nebraska | $5.8 | $10.0 | $4.9 | $29.3 | $9.3 | $16.4 | $5.4 |
| Nevada | $9.4 | $10.6 | $3.7 | $10.2 | $14.2 | $19.9 | $8.8 |
| New Hampshire | $5.8 | $9.7 | $3.7 | $28.5 | $6.5 | $11.3 | $3.7 |
| New Jersey | $26.6 | $46.8 | $19.3 | $119.9 | $43.9 | $80.9 | $24.1 |
| New Mexico | $8.6 | $16.1 | $3.9 | $17.6 | $10.2 | $16.4 | $5.3 |
| New York | $88.5 | $166.4 | $61.0 | $365.7 | $96.9 | $286.6 | $91.5 |
| North Carolina | $33.2 | $45.5 | $18.5 | $84.1 | $49.2 | $71.3 | $25.6 |
| North Dakota | $5.8 | $9.7 | $3.4 | $19.3 | $3.7 | $4.9 | $3.3 |
| Ohio | $44.4 | $76.4 | $27.4 | $147.8 | $56.9 | $136.8 | $38.3 |
| Oklahoma | $12.4 | $23.6 | $8.2 | $32.9 | $19.2 | $24.5 | $10.0 |
| Oregon | $11.2 | $19.9 | $5.6 | $35.2 | $19.7 | $31.5 | $12.8 |
| Pennsylvania | $44.5 | $83.2 | $29.8 | $208.7 | $62.7 | $168.8 | $40.0 |
| Rhode Island | $5.8 | $9.7 | $3.9 | $25.2 | $5.2 | $15.1 | $4.9 |
| South Carolina | $18.7 | $25.9 | $10.8 | $35.6 | $24.0 | $34.5 | $11.9 |
| South Dakota | $5.8 | $9.7 | $3.0 | $17.3 | $4.2 | $6.4 | $3.3 |
| Tennessee | $23.5 | $35.1 | $13.9 | $58.6 | $32.3 | $45.3 | $17.2 |
| Texas | $106.7 | $169.1 | $33.8 | $118.2 | $134.5 | $215.6 | $63.5 |
| Utah | $6.9 | $13.5 | $3.6 | $23.4 | $14.7 | $19.4 | $6.4 |
| Vermont | $5.8 | $9.7 | $3.7 | $18.9 | $3.1 | $7.1 | $3.4 |
| Virginia | $20.5 | $36.7 | $11.3 | $83.6 | $41.0 | $50.6 | $18.1 |
| Washington | $17.7 | $33.5 | $8.3 | $56.8 | $35.1 | $51.2 | $18.8 |
| West Virginia | $6.8 | $17.3 | $7.9 | $28.8 | $9.0 | $18.6 | $5.3 |
| Wisconsin | $16.8 | $33.5 | $8.6 | $102.8 | $28.3 | $56.5 | $17.8 |
| Wyoming | $5.8 | $9.7 | $3.5 | $9.2 | $2.9 | $3.5 | $3.5 |
| US Total | $1,191.7 | $2,055.8 | $715.0 | $3,390.3 | $1,582.7 | $3,000.0 | $950.0 |
| TABLE 5 | ||||
|---|---|---|---|---|
| WIOA Title I (Adult, Youth, & Dislocated Worker) Formula Grants Cut Under President Trump’s FY 2018 Budget Proposal, Dollars in Millions | ||||
| State | FY 2017 Allotments | Amounts Under President’s FY 2018 Proposal | Amount Cut Under President’s Proposal | Percent Cut Under President’s Proposal |
| Alabama | $42.5 | $25.6 | $17.0 | -40% |
| Alaska | $7.3 | $4.4 | $2.9 | -40% |
| Arizona | $63.9 | $38.5 | $25.5 | -40% |
| Arkansas | $23.1 | $13.9 | $9.2 | -40% |
| California | $421.6 | $253.6 | $168.1 | -40% |
| Colorado | $33.9 | $20.4 | $13.5 | -40% |
| Connecticut | $34.1 | $20.5 | $13.6 | -40% |
| Delaware | $6.5 | $3.9 | $2.6 | -40% |
| District of Columbia | $10.4 | $6.3 | $4.2 | -40% |
| Florida | $164.4 | $98.8 | $65.5 | -40% |
| Georgia | $100.6 | $60.5 | $40.1 | -40% |
| Hawaii | $6.1 | $3.6 | $2.4 | -40% |
| Idaho | $8.1 | $4.8 | $3.2 | -40% |
| Illinois | $130.3 | $78.4 | $51.9 | -40% |
| Indiana | $49.6 | $29.8 | $19.8 | -40% |
| Iowa | $12.8 | $7.7 | $5.1 | -40% |
| Kansas | $14.1 | $8.4 | $5.6 | -40% |
| Kentucky | $40.8 | $24.5 | $16.3 | -40% |
| Louisiana | $36.6 | $22.0 | $14.6 | -40% |
| Maine | $9.4 | $5.6 | $3.7 | -40% |
| Maryland | $46.3 | $27.8 | $18.5 | -40% |
| Massachusetts | $48.7 | $29.3 | $19.4 | -40% |
| Michigan | $93.2 | $56.0 | $37.1 | -40% |
| Minnesota | $23.5 | $14.1 | $9.4 | -40% |
| Mississippi | $31.7 | $19.1 | $12.7 | -40% |
| Missouri | $49.0 | $29.4 | $19.5 | -40% |
| Montana | $5.7 | $3.4 | $2.3 | -40% |
| Nebraska | $6.1 | $3.7 | $2.5 | -40% |
| Nevada | $33.2 | $20.0 | $13.2 | -40% |
| New Hampshire | $6.3 | $3.8 | $2.5 | -40% |
| New Jersey | $87.8 | $52.8 | $35.0 | -40% |
| New Mexico | $20.0 | $12.0 | $8.0 | -40% |
| New York | $168.6 | $101.4 | $67.2 | -40% |
| North Carolina | $80.4 | $48.3 | $32.0 | -40% |
| North Dakota | $4.9 | $2.9 | $2.0 | -40% |
| Ohio | $84.8 | $51.0 | $33.8 | -40% |
| Oklahoma | $18.3 | $11.0 | $7.3 | -40% |
| Oregon | $36.5 | $22.0 | $14.6 | -40% |
| Pennsylvania | $93.1 | $56.0 | $37.1 | -40% |
| Rhode Island | $12.3 | $7.4 | $4.9 | -40% |
| South Carolina | $45.0 | $27.1 | $18.0 | -40% |
| South Dakota | $5.2 | $3.1 | $2.1 | -40% |
| Tennessee | $60.4 | $36.3 | $24.1 | -40% |
| Texas | $151.6 | $91.2 | $60.5 | -40% |
| Utah | $10.0 | $6.0 | $4.0 | -40% |
| Vermont | $5.1 | $3.0 | $2.0 | -40% |
| Virginia | $47.3 | $28.4 | $18.9 | -40% |
| Washington | $59.1 | $35.6 | $23.6 | -40% |
| West Virginia | $17.0 | $10.2 | $6.8 | -40% |
| Wisconsin | $39.1 | $23.5 | $15.6 | -40% |
| Wyoming | $4.9 | $2.9 | $2.0 | -40% |
| US Total | $2,709.8 | $1,629.5 | $1,080.3 | -40% |
| TABLE 6 | ||||
|---|---|---|---|---|
| Employment Service (Wagner-Peyser) State Grants Cut Under President Trump’s FY 2018 Budget Proposal, Dollars in Millions | ||||
| State | FY 2017 Allotments | Amounts Under President’s FY 2018 Proposal | Amount Cut Under President’s Proposal | Percent Change Under President’s Proposal |
| Alabama | $8.9 | $5.5 | $3.4 | -38% |
| Alaska | $7.3 | $4.5 | $2.8 | -38% |
| Arizona | $13.0 | $8.1 | $5.0 | -38% |
| Arkansas | $5.3 | $3.3 | $2.0 | -38% |
| California | $79.9 | $49.5 | $30.4 | -38% |
| Colorado | $10.7 | $6.6 | $4.1 | -38% |
| Connecticut | $7.7 | $4.7 | $2.9 | -38% |
| Delaware | $1.9 | $1.2 | $0.7 | -38% |
| District of Columbia | $2.1 | $1.3 | $0.8 | -38% |
| Florida | $38.7 | $23.9 | $14.7 | -38% |
| Georgia | $20.0 | $12.4 | $7.6 | -38% |
| Hawaii | $2.4 | $1.5 | $0.9 | -38% |
| Idaho | $6.1 | $3.8 | $2.3 | -38% |
| Illinois | $27.8 | $17.2 | $10.6 | -38% |
| Indiana | $12.8 | $8.0 | $4.9 | -38% |
| Iowa | $6.1 | $3.8 | $2.3 | -38% |
| Kansas | $5.5 | $3.4 | $2.1 | -38% |
| Kentucky | $8.4 | $5.2 | $3.2 | -38% |
| Louisiana | $9.1 | $5.7 | $3.5 | -38% |
| Maine | $3.6 | $2.2 | $1.4 | -38% |
| Maryland | $12.3 | $7.6 | $4.7 | -38% |
| Massachusetts | $13.7 | $8.5 | $5.2 | -38% |
| Michigan | $20.9 | $12.9 | $7.9 | -38% |
| Minnesota | $11.0 | $6.8 | $4.2 | -38% |
| Mississippi | $5.6 | $3.5 | $2.1 | -38% |
| Missouri | $12.2 | $7.6 | $4.6 | -38% |
| Montana | $5.0 | $3.1 | $1.9 | -38% |
| Nebraska | $5.5 | $3.4 | $2.1 | -38% |
| Nevada | $6.1 | $3.8 | $2.3 | -38% |
| New Hampshire | $2.7 | $1.6 | $1.0 | -38% |
| New Jersey | $19.1 | $11.8 | $7.3 | -38% |
| New Mexico | $5.6 | $3.4 | $2.1 | -38% |
| New York | $38.7 | $23.9 | $14.7 | -38% |
| North Carolina | $19.5 | $12.1 | $7.4 | -38% |
| North Dakota | $5.0 | $3.1 | $1.9 | -38% |
| Ohio | $23.4 | $14.5 | $8.9 | -38% |
| Oklahoma | $6.8 | $4.2 | $2.6 | -38% |
| Oregon | $8.1 | $5.0 | $3.1 | -38% |
| Pennsylvania | $25.7 | $15.9 | $9.8 | -38% |
| Rhode Island | $2.4 | $1.5 | $0.9 | -38% |
| South Carolina | $9.4 | $5.8 | $3.6 | -38% |
| South Dakota | $4.7 | $2.9 | $1.8 | -38% |
| Tennessee | $12.7 | $7.8 | $4.8 | -38% |
| Texas | $48.7 | $30.1 | $18.5 | -38% |
| Utah | $6.2 | $3.9 | $2.4 | -38% |
| Vermont | $2.2 | $1.4 | $0.8 | -38% |
| Virginia | $16.0 | $9.9 | $6.1 | -38% |
| Washington | $14.1 | $8.8 | $5.4 | -38% |
| West Virginia | $5.3 | $3.3 | $2.0 | -38% |
| Wisconsin | $11.9 | $7.3 | $4.5 | -38% |
| Wyoming | $3.6 | $2.2 | $1.4 | -38% |
| US Total | $691.2 | $435.7 | $255.5 | -37% |
| TABLE 7 | ||||
|---|---|---|---|---|
| TANF State Family Assistance Grants (SFAG) and Contingency Fund (CF) Awards Cut Under President Trump’s FY 2018 Budget Proposal, Dollars in Millions | ||||
| State | Total Estimate of SFAG & CF Federal Funds, Current Level | President’s Proposed New Block Grant Funds | Total Estimated Federal Amount Cut from TANF Fund | Percent Change Under President’s Proposal |
| Alabama | $102.5 | $84.3 | $18.2 | -18% |
| Alaska | $63.6 | $57.4 | $6.2 | -10% |
| Arizona | $242.1 | $200.8 | $41.2 | -17% |
| Arkansas | $62.3 | $51.2 | $11.1 | -18% |
| California | $3,733.8 | $3,371.7 | $362.1 | -10% |
| Colorado | $149.4 | $122.9 | $26.6 | -18% |
| Connecticut | $266.8 | $240.9 | $25.9 | -10% |
| Delaware | $35.5 | $29.2 | $6.3 | -18% |
| District of Columbia | $101.7 | $83.6 | $18.1 | -18% |
| Florida | $562.3 | $507.8 | $54.5 | -10% |
| Georgia | $330.7 | $298.7 | $32.1 | -10% |
| Hawaii | $108.6 | $89.3 | $19.3 | -18% |
| Idaho | $31.9 | $28.8 | $3.1 | -10% |
| Illinois | $585.1 | $528.3 | $56.7 | -10% |
| Indiana | $206.8 | $186.7 | $20.1 | -10% |
| Iowa | $131.5 | $118.8 | $12.8 | -10% |
| Kansas | $101.9 | $92.0 | $9.9 | -10% |
| Kentucky | $181.3 | $163.7 | $17.6 | -10% |
| Louisiana | $164.0 | $148.1 | $15.9 | -10% |
| Maine | $78.1 | $70.5 | $7.6 | -10% |
| Maryland | $251.6 | $206.9 | $44.7 | -18% |
| Massachusetts | $504.5 | $414.8 | $89.7 | -18% |
| Michigan | $775.4 | $700.2 | $75.2 | -10% |
| Minnesota | $268.0 | $242.0 | $26.0 | -10% |
| Mississippi | $86.8 | $78.4 | $8.4 | -10% |
| Missouri | $217.1 | $196.0 | $21.1 | -10% |
| Montana | $45.5 | $41.1 | $4.4 | -10% |
| Nebraska | $58.0 | $52.4 | $5.6 | -10% |
| Nevada | $48.3 | $39.7 | $8.6 | -18% |
| New Hampshire | $38.5 | $34.8 | $3.7 | -10% |
| New Jersey | $404.0 | $364.9 | $39.2 | -10% |
| New Mexico | $137.0 | $113.9 | $23.1 | -17% |
| New York | $2,682.8 | $2,206.0 | $476.8 | -18% |
| North Carolina | $331.8 | $272.9 | $58.9 | -18% |
| North Dakota | $26.4 | $23.8 | $2.6 | -10% |
| Ohio | $728.0 | $657.4 | $70.6 | -10% |
| Oklahoma | $148.0 | $133.7 | $14.4 | -10% |
| Oregon | $184.3 | $151.6 | $32.7 | -18% |
| Pennsylvania | $719.5 | $649.7 | $69.8 | -10% |
| Rhode Island | $95.0 | $85.8 | $9.2 | -10% |
| South Carolina | $109.8 | $90.3 | $19.5 | -18% |
| South Dakota | $21.9 | $19.8 | $2.1 | -10% |
| Tennessee | $210.3 | $172.9 | $37.4 | -18% |
| Texas | $534.0 | $439.1 | $94.9 | -18% |
| Utah | $76.8 | $69.4 | $7.5 | -10% |
| Vermont | $47.4 | $42.8 | $4.6 | -10% |
| Virginia | $158.3 | $142.9 | $15.4 | -10% |
| Washington | $441.7 | $365.1 | $76.6 | -17% |
| West Virginia | $110.2 | $99.5 | $10.7 | -10% |
| Wisconsin | $349.0 | $287.3 | $61.7 | -18% |
| Wyoming | $21.8 | $19.7 | $2.1 | -10% |
| US Total | $17,096.7 | $14,889.6 | $2,207.1 | -13% |
End Notes
[1] The 37 percent figure assumes that state general fund budgets grow at about 4 percent per year between 2017 and 2027, from $819 billion to $1.2 trillion. The average growth of spending from state funds from 2011 through 2016 was 3.99 percent, according to the National Association of State Budget Officers.
[2] This figure excludes SNAP benefit cuts the budget imposes beginning in 2018, before the 2020 start of the requirement that states cover a share of SNAP benefit costs. Those cuts will reduce benefits by $75 billion over the decade, and $9 billion in 2027 alone.
[3] Edwin Park, “Trump Budget Cuts Medicaid Even More than House Health Bill, Showing Danger of Per Capita Cap,” Center on Budget and Policy Priorities, May 23, 2017, https://www.cbpp.org/blog/trump-budget-cuts-medicaid-even-more-than-house-health-bill-showing-danger-of-per-capita-cap and subsequent calculations.
[4] In addition, the budget cuts SNAP benefits by another $75 billion over the decade, with the cuts beginning in 2018.
[5] For other budget provisions that would reduce SNAP eligibility and benefits, see Stacy Dean, “President’s Budget Would Shift Substantial Costs to States and Cut Food Assistance for Millions,” Center on Budget and Policy Priorities, May 23, 2017, https://www.cbpp.org/research/food-assistance/presidents-budget-would-shift-substantial-costs-to-states-and-cut-food.
[6] Ife Floyd, “Trump’s TANF Cuts Would Hurt the Poorest Families, and States Might Make Them Worse,” Center on Budget and Policy Priorities, May 30, 2017, https://www.cbpp.org/blog/trumps-tanf-cut-would-hurt-the-poorest-families-and-states-might-make-them-worse.
[7] For a fuller description of SSBG, see LaDonna Pavetti and Ife Floyd, “Eliminating Social Services Block Grant Would Weaken Services for Vulnerable Children, Adults, and Disabled,” Center on Budget and Policy Priorities, updated April 18, 2016, https://www.cbpp.org/sites/default/files/atoms/files/5-3-12bud.pdf.
[8] Department of Health and Human Services, Administration for Children and Families, Office of Community Services, Division of Energy Assistance, “Low Income Home Energy Assistance Program, Report to Congress for Fiscal Year 2014,” 2015, https://www.acf.hhs.gov/sites/default/files/ocs/fy14_liheap_rtc_final.pdf.
[9] Department of Education, “Findings from the 2014-15 Survey on the Use of Funds under Title II, Part A: Subgrants to LEAs,” July 2015, https://www2.ed.gov/programs/teacherqual/learport.pdf.
[10] Funding is provided in the form of contract authority, a type of mandatory budget authority. Most spending from the program is controlled by annual limits on obligations set in annual appropriations acts.
[11] The Trump budget shows $200 billion in budget authority in 2018 for the President’s new infrastructure program as a grant to state and local governments. Another part of the budget shows that up to $5 billion of that amount would be spent in 2018. However, the budget’s very brief description of the program says that the funds would be focused on incentivizing non-federal investments, and it is unclear what portion, if any, of these funds would go to states and localities.
[12] The Budget Message of the President, p. 1.
More from the Authors

Areas of Expertise