Tapping More People’s Capacity to Innovate Can Help States Thrive
States’ inability to unlock the innovative potential of all people, regardless of their circumstances, may be limiting broad-based opportunity and the nation’s prosperity. That’s a core takeaway from emerging research on economic innovation, in particular the groundbreaking “Lost Einsteins” study,[1] which details how women, people of color, and children from non-rich families are less likely to become inventors than their wealthier, white, male counterparts — even when they show exceptional promise as children. Innovation is among the main drivers of economic growth and human progress, yet state policymakers have sometimes overlooked it. This paper details how an increased focus on tapping the full creative talents of historically excluded groups presents an exciting opportunity for states to grow healthier, more prosperous, and more equal over time.
“States’ inability to unlock the innovative potential of all people, regardless of their circumstances, may be limiting broad-based opportunity and the nation’s prosperity.”
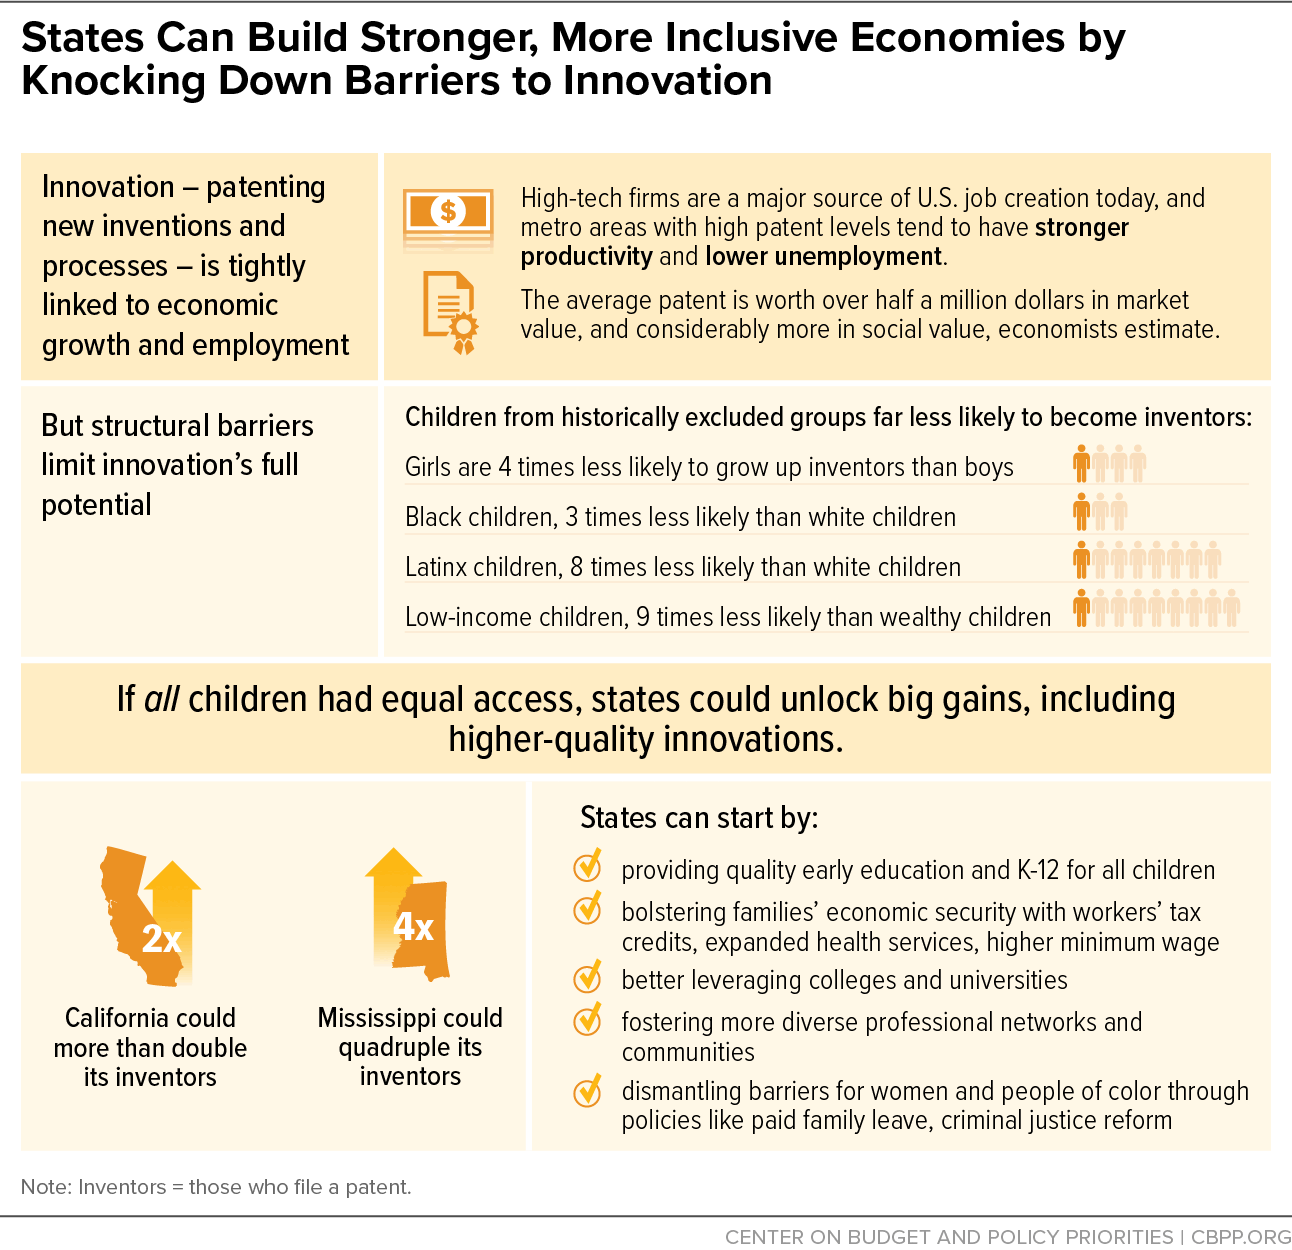
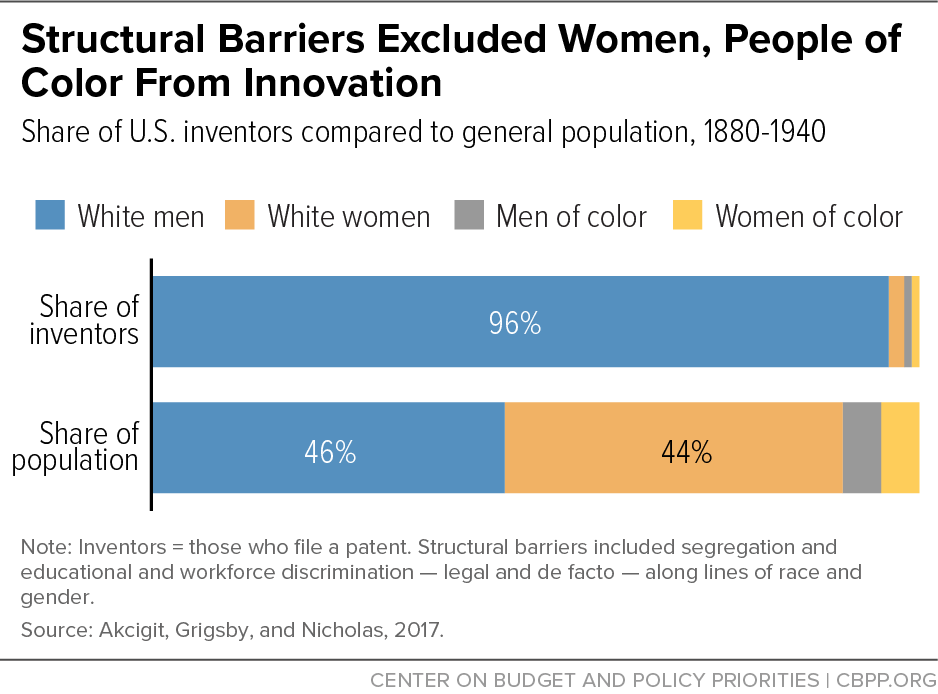
Innovations in technology, medicine, and industry account for a big share of total economic output and are important drivers of our health and well-being. While inventors are rare, high-impact ones can generate lasting ideas that set economic trends or help confront pressing social challenges. But historical racism and sexism restricted the pool of innovators: white men accounted for about 96 percent of U.S. inventors a century ago when legal and cultural prohibitions barred women and people of color from opportunities to innovate and bring their inventions to market. Significant gender, racial, and class disparities persist today, likely limiting the quality and quantity of innovation. Men still represent some 82 percent of inventors. And white children are three times likelier than Black and eight times likelier than Latinx children, and children from affluent families nine times likelier than those from low-income ones, to invent. Innovation is also generally lower in Southern states, due in large part to a legacy of racist policies that severely limited opportunity.
Narrowing these disparities could give states a powerful tool to build more prosperous, equitable economies by opening opportunities in innovation to a more diverse talent pool and spreading its benefits more widely. Giving more young people a chance to develop their creative talents and pursue careers in science, medicine, technology, or similar fields might spur a rise in breakthroughs that are essential to broadly shared prosperity. It could also enhance the quality of innovation by diversifying the range of ideas, perspectives, and experiences that go into it, research suggests.
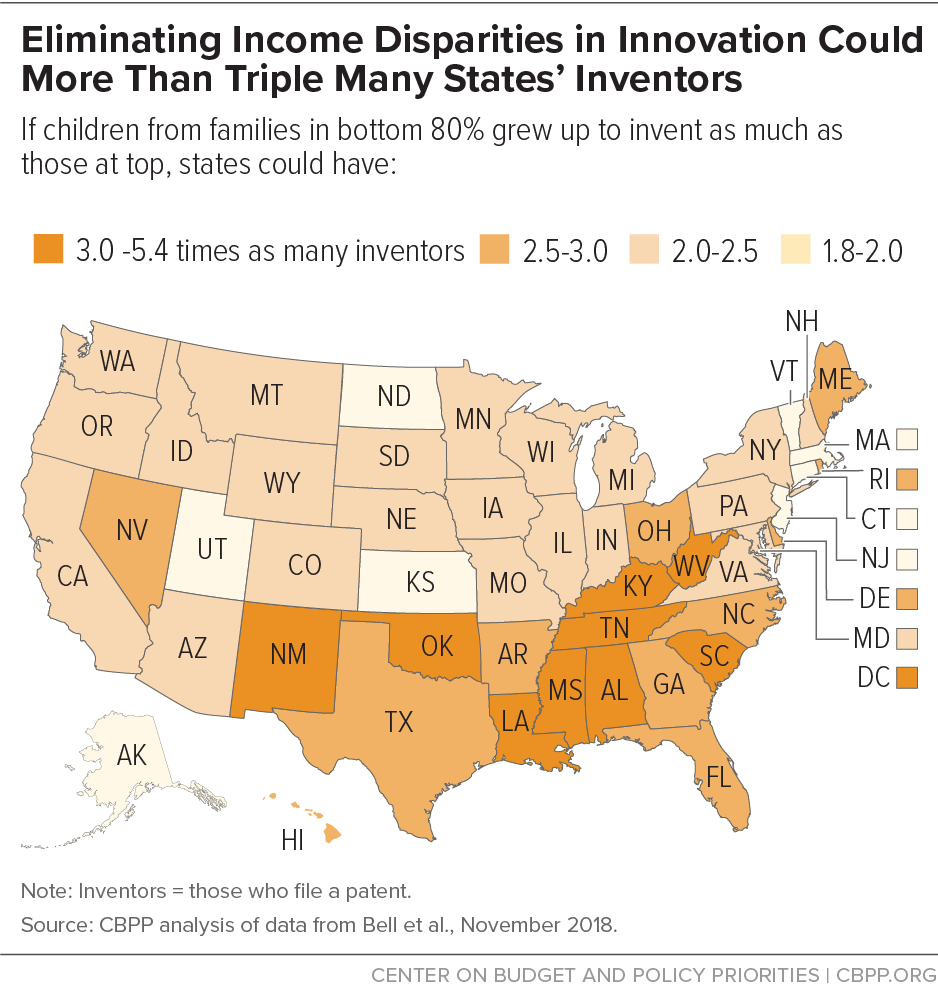
If girls, children of color, and children from non-rich families grew up to invent at the same rate as white boys from high-income families, there would be four times as many inventors in America as there are today, according to the Lost Einsteins study. Available data do not allow for determining this combined racial, gender, and income effect at the state level; however, we can calculate states’ potential gain just from eliminating income disparities. If U.S. children from families in the bottom 80 percent of income — whatever their race or gender — grew up to invent at the same level as the top 20 percent, the rise in states’ inventors could range from almost double in Utah to over five times more in the District of Columbia. (See Appendix for state data and methodology.) Gains would likely be largest in the South and among people of color nationwide.[2]
To unleash this potential, states should prioritize policies designed to maximize all their residents’ creativity and ingenuity. They can start with local pilot projects to implement targeted interventions such as STEM internships and mentor programs, which the Lost Einsteins researchers conclude are the most direct way to accomplish this goal. But they can also champion more wide-ranging strategies that research on both innovation and economic opportunity suggests can help unlock more people’s creative potential over time. Failing to tackle the underlying structural problems that so skewed innovation in the first place will slow progress toward a more representative, and hence more vital, inventor pool. That is especially true if nothing is done to counteract the COVID-19 pandemic’s disproportionate harm to these underserved groups. (See text box, “COVID-19 Crisis Highlights Importance of Innovation, Need for Structural Solutions.”)
States can:
- Prioritize high-quality learning for all children from birth through adolescence. Children are likeliest to realize their full creative and economic potential in a supportive environment with rich, sustained learning opportunities from birth until adulthood. By boosting early education’s funding and quality, and maintaining that commitment through K-12, states can get more young people from diverse backgrounds into innovative pursuits.
- Bolster families’ economic security so that more people can pursue innovation. Children from low- or middle-income families are far less likely to become inventors as adults, and adults who feel economically insecure appear less inclined to pursue creative ventures. Strengthening families’ economic condition by raising incomes and ensuring access to public supports could foster more innovation both today and down the road.
- Leverage colleges and universities to strengthen and diversify local networks of innovation. Higher learning institutions are hubs for fostering innovation, and expanding their footprint could heighten that effect, especially if lawmakers target new investments to institutions that serve large cohorts of people from low-income backgrounds, women, and communities of color. Increasing the number of college graduates from historically excluded communities could also bolster innovation long term, as the benefits of higher education are passed on from parents to children and from local mentors to young people.
- Foster more diverse professional networks, communities, and schools. States could also enact policies that get more people with different perspectives and experiences together to share ideas, learn from one another, and maximize creative talents. Various research lifts up the value of diversity and collaboration in decision-making and creative thinking, suggesting that policies to promote them could stimulate innovation.
- Pursue other policies that break down barriers for women, people of color, and others too often overlooked. States can buttress their more direct strategies to increase innovation with efforts to dismantle structural racism and sexism. Examples include reversing unwise criminal justice policies that disrupt families and community networks and helping families better balance work and caregiving through policies like paid leave.
Why Innovation Matters to State Prosperity
A deep body of research shows that innovation and human creativity are essential to long-term economic growth. Good ideas, technological and medical advancements, artistic pursuits, and scientific discoveries lead to new products and practices, which in turn lead to high-growth companies, new jobs, additional markets or industries, and healthier and more vibrant communities. Improvements in organizational or company practices, such as the assembly line or email, enhance productivity and help people do more in less time.[3] And breakthroughs in medicine and agriculture, such as new vaccines and more resilient crops, help people stay healthy and able to contribute over longer lifespans.[4] Although technological advancements and their associated new products and practices are not uniformly positive — sometimes they generate serious health or environmental side effects or rely on exploitation[5] — when properly managed they account for a sizable share of economic growth and human progress. [6]
Individual inventors, defined as people who file a patent, are extremely rare: they account for only about 0.2 percent of the total U.S. population. Moreover, the lion’s share of economic growth stemming from innovation is attributable to an even narrower sliver of prolific, high-impact inventors — “star inventors”[7] — who generate the kind of lasting, high-return ideas that truly change underlying economic or social trends.[8] In other words, the quality of inventions plays a crucial role in the contribution to economic growth, with fundamental breakthroughs like electricity or the internet mattering far more than marginal improvements or tweaks to existing practices.
One way that innovation leads to economic growth is the commercialization of ideas and patents into new products, services, or manufacturing techniques. Advancements in electricity and transportation helped spawn companies like General Electric and General Motors in the early 20th century, while more recent improvements in computing and communication led to high-growth technological firms including IBM, Apple, and Amazon. New products and practices are often housed within startup firms, which if successful can grow rapidly into so-called “gazelle” firms — such as Google or eBay — that account for a sizable share of overall job growth. During the internet-driven boom of the late 1990s and early 2000s, for example, startup firms less than a year old and high-growth firms (which are also likely to be young) accounted for about 70 percent of all new jobs in the U.S. economy.[9]
Although the pace of innovation-based startup growth has slowed in recent years — due to many reasons including declining federal investment in science and technological research — such companies are still among the U.S. economy’s major sources of employment.[10] And while the value of individual patents varies substantially, economists have calculated that the average patent is worth over half a million dollars in direct market value (and considerably more in social value as the technology and its ideas disseminate over time).[11]
Research also indicates that areas with a greater share of national innovation tend to have stronger economies over time. (See Figure 1.) One landmark study constructed a statistical model designed to tease out how much of states’ economic growth from 1900 to 2000 was due to differences in inventiveness, rather than other factors. If two states started out with the same GDP per person, but one state added four times more inventors over the ensuing 100 years, then the more innovative state would wind up 30 percent richer than the less innovative state, the study estimated.[12] Another study detailed how above-average patent growth in a metro area is associated with stronger productivity growth, more lucrative public offerings from local companies, and lower unemployment levels. For example, looking at patent rates from 1990 to 2010, it found the average unemployment rate for the ten metro areas with most rapid patent growth was 4.9 percent, compared to 6.2 percent in large metros with slow patent growth.[13]
Innovation also carries some noteworthy challenges for state and federal policymakers to consider. Many of the nation’s most innovative metropolitan areas also have high and persistent levels of economic inequality that widens across racial and gender lines, evidenced by trends such as skyrocketing housing costs on one hand and stagnant wages for low-wage service industry workers on the other. The concentration of economic innovation in a handful of places has also widened the economic gap between different regions of the country, with more rural and non-coastal places seeing weaker growth in recent decades,[14] along with associated community challenges such as declining public health.[15] And newer corporate behemoths with significant economic and political power, such as Amazon and Facebook, create new challenges for regulators and lawmakers, including the risk of actually undermining innovation down the road if that power is leveraged to exclude new entrants and ideas from the market. But when properly regulated by public decision-makers, and when steps are taken to ensure that gains are broadly shared, innovation holds great promise for states.
States Missing Out on Innovation, According to Cutting-Edge Research
Experts and policymakers trying to foster innovation typically focus on a suite of technology-centric tools, including grants and tax credits for research and development (R&D), support for efforts to strengthen STEM education, access to venture capital, patent reform, and various localized strategies such as public-private partnerships and so-called “innovation hubs.”[16] These approaches likely have merit, research indicates, both in boosting overall levels of innovation[17] and diversifying access to it.[18] At the same time, recent improvements in data and methods have allowed a series of pathbreaking researchers to drastically improve our understanding of where innovation comes from — and by extension to expand our grasp of which policies might enhance it.[19]
Of particular note is the so-called “Lost Einsteins” study, published in late 2017 (and updated in November 2018), by a team of researchers associated with economist Raj Chetty at Harvard University. Formally titled “Who Becomes an Inventor in America? The Importance of Exposure to Innovation,”[20] the study linked U.S. patent records to a rich set of demographic and income data from federal tax returns for 1.2 million people who invented between 1996 and 2014, as well as test scores on standardized third- and eighth-grade math tests. The researchers discovered that women, people of color, and children from non-rich families are far less likely than their white, male, and affluent peers to become inventors as adults — even when they do just as well in school. They also found that identifying ways to close these gaps could lead to drastic expansions in innovation.[21] (We use “Lost Einsteins” and “Opportunity Insights” to describe the research and its team in this paper.)
A core implication of the Lost Einsteins study is that countless people today and in the past might have become inventors and changed American life had they grown up in different circumstances or with richer opportunities. The next Einstein could be growing up in rural Alabama, while the next Patricia Bath (inventor of laser cataract surgery) might be struggling in an underfunded, segregated school in Connecticut. (See box, “Women, People of Color Who Overcame Barriers Contributed Mightily.”) While all students deserve investments that give them an equal chance at success, the missed opportunities from underdeveloped potential are likely significant. This carries important implications for states seeking to develop strategies that might unleash every person’s potential.
Race, Gender, Income, and Geography Highly Correlated With Innovation
Based on the Lost Einsteins work and related inquiry in the field, these are some primary themes of what we now know about innovation today.
The Landscape of Innovation Varies Considerably Across the Country
The Northeast, upper Midwest, and West Coast generally do a much better job than others providing pathways to innovation. In contrast, rates of innovation are generally lowest in the South, though islands of innovation such as Austin, Texas and the Research Triangle in North Carolina exist in that region, too. (See Figure 2.) At the state level, rates of innovation range from a low of 0.6 inventors per 1,000 children in Mississippi to a high of 3.7 per 1,000 children in Minnesota. Some 2 out of every 1,000 children nationwide become inventors as adults, according to the Opportunity Insights study. State-by-state data are available in the Appendix.
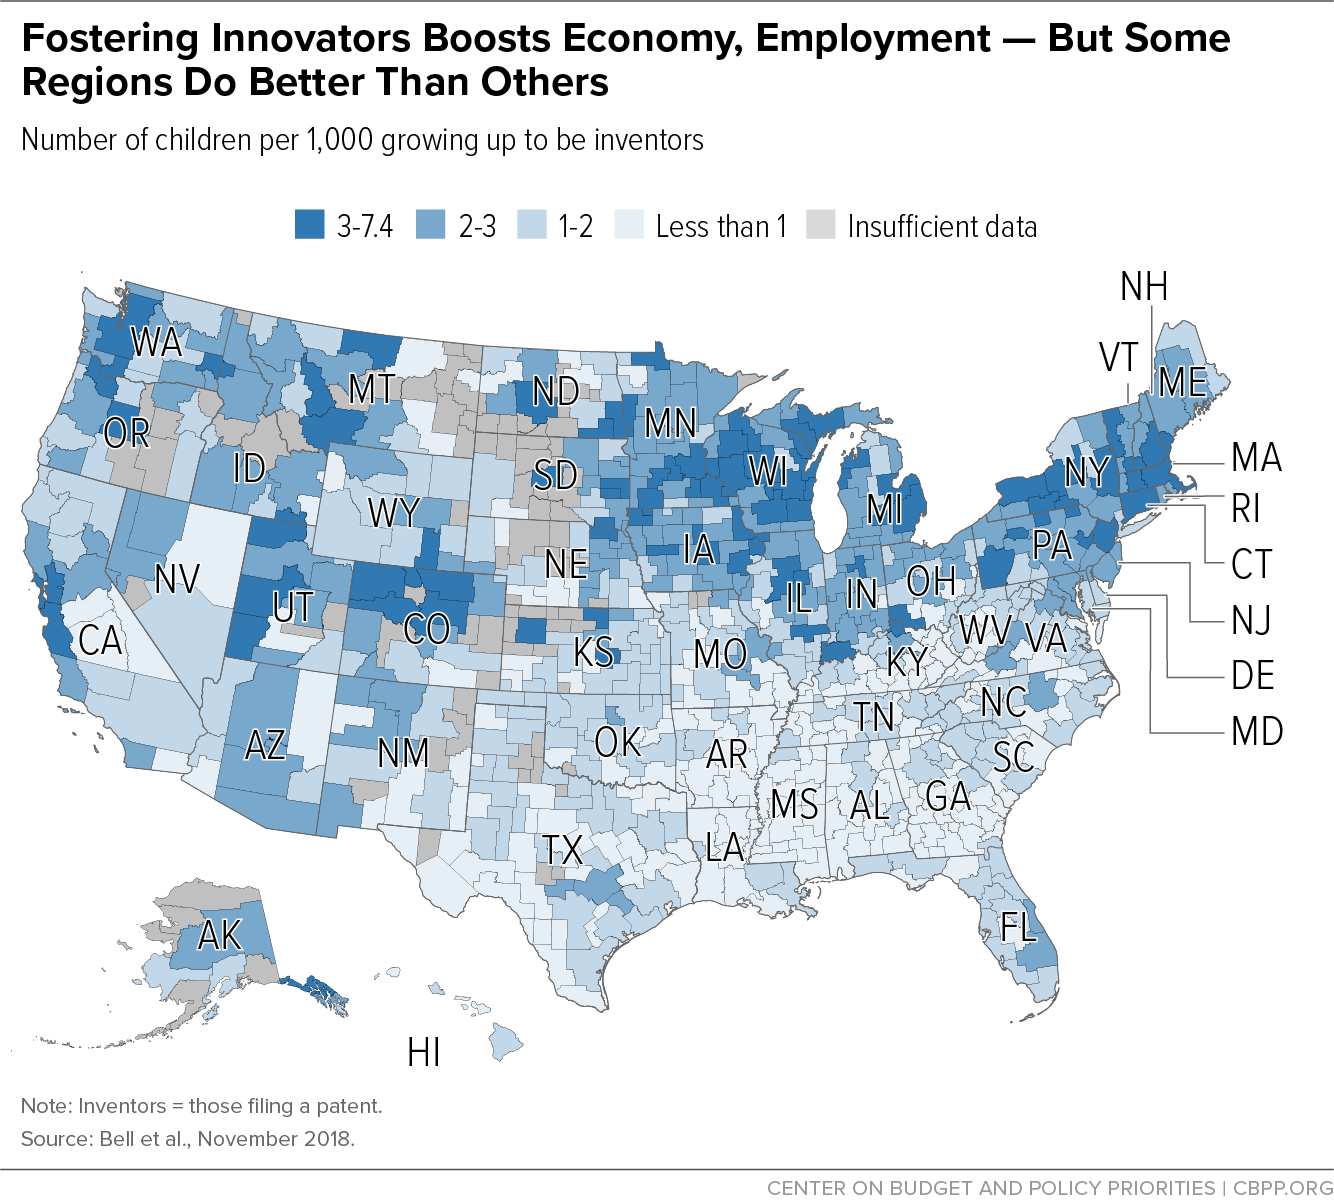
This clustering of innovation goes back a long time.[22] The basic geographic breakdown of innovation being higher in the Northeast, Midwest, and West Coast appears to be similar to the landscape of American innovation dating back to at least the late 1800s. As one major study describes, the breakdown of higher patent rates in those places paired with exceptionally low ones in the South was “remarkedly stable” across six decades from 1880 to 1940.[23]
These trends are in line with a broader body of research that finds inventors are more likely to come from certain communities than others, and that innovation tends to cluster in certain places.[24] Most U.S. patents — 63 percent — are developed by people living in just 20 metro areas home to 34 percent of the U.S. population, a 2013 study found.[25] High-patent areas are typically those with at least one major research institution, including Stanford in Silicon Valley and MIT and Harvard in Boston; overall, the 48 metro areas with high-ranking doctoral programs in science accounted for 62 percent of all patents from 2007 to 2011, while comprising just 46 percent of the nation’s metropolitan population.[26] Private R&D dollars in the United States also appear to be concentrated in the same regions that have proven most innovative over time, such as California and the Northeast.[27]
One explanation for this clustering effect is that inventors appear to be relatively mobile and willing to relocate to places more conducive to innovation, such as cities with a history or high density of inventors or with abundant access to the financial capital needed to get new ideas off the ground.[28] Innovation also tends to self-perpetuate in areas where it previously gained a foothold, since these areas generate social and professional networks of information-sharing and financial support, providing for additional breakthroughs over time.[29] Research in the adjacent field of entrepreneurship suggests an area’s overall quality of life — defined by factors such as access to quality local schools and cultural amenities — may play a role in attracting (or retaining) innovators as well. As one widely cited survey of high-growth startup founders found, “entrepreneurs at fast-growing firms usually decide where to live based on personal connections and quality of life factors many years before they start their firms.… 80 percent of them had lived for at least two years in the city where they started their companies.”[30]
Family Income Plays a Big Role in Whether Children Become Inventors as Adults
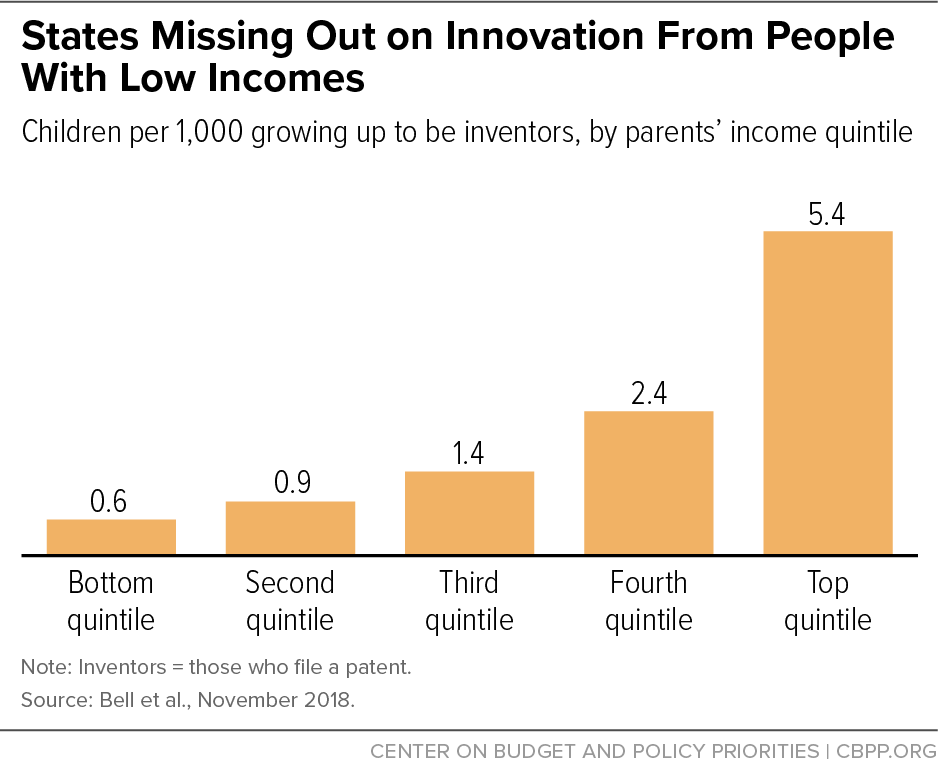
Children from more affluent environments are far likelier to become inventors as adults, even after accounting for other factors, research indicates. Data from the Lost Einsteins study show that an estimated 5.4 per 1,000 children from families in the richest 20 percent grow up to become inventors, compared to only 1.4 per 1,000 children from the middle 20 percent and 0.6 per 1,000 children from the lowest 20 percent. (See Figure 3.) In other words, children from high-income families are about nine times likelier to become inventors than children from low-income families, and nearly four times likelier than middle-income children.[31] Importantly, the report indicates that it isn’t a lack of aptitude that’s holding back low-income kids; it’s that aptitude alone isn’t enough. Children who do well on third-grade math tests are much likelier to become future innovators overall, but especially so if they also come from an affluent background. Among low-income families, high-scoring kids are only slightly more likely than low-scoring ones to become inventors.[32]
Other research has come to similar conclusions about the role of family income, specifically that it matters to innovation even after accounting for influences like educational level and IQ, though those things are important as well.[33] Factors that make it harder for young people from low-income environments to enter formal channels of innovation, as well as thrive more generally, include growing up in homes with fewer years of parental education, having access to a narrower range of life experiences among role models in the community (due in large part to repressive criminal justice policies and other forms of structural racism), and increased exposure to health and environmental hazards such as hunger and housing insecurity.
Structural Barriers Have Impeded the Diverse Ideas, Perspectives, and Creative Talents of Women and People of Color
For most of U.S. history, almost all recognized inventors have been white men. They accounted for about 96 percent of all patented inventors between 1880 and 1940, according to one study, despite comprising only 46 percent of Americans in that era. [34] (See Figure 4.) And looking at “star inventors,” or those credited with a track record of many influential patents or discoveries, only 1 out of 400 born before 1886 was a woman.[35] The bulk of these disparities were due to obstacles that blocked women and people of color from the path of innovation outright, such as barriers to higher education for women nationwide and racist policies that erected steep barriers for Black people living in the U.S. South.[36] At the same time, evidence indicates that when excluded groups did innovate, their contributions were often overlooked or miscredited to white men.[37]
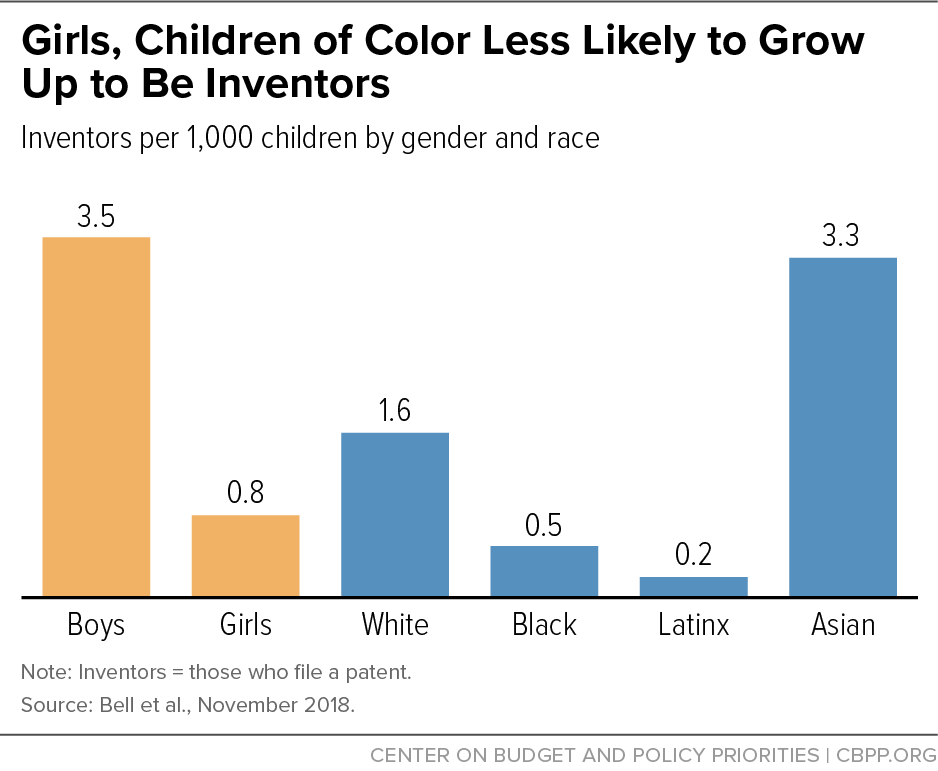
The legacy of past disparities remains with us today. The Opportunity Insights team estimates that only 0.5 per 1,000 Black children and 0.2 per 1,000 Latinx children grow up to patent new inventions, compared to 1.6 per 1,000 white children and 3.3 per 1,000 Asian American children.[38] Put another way, white Americans are about three times more likely than African Americans and eight times more likely than Latinx Americans to invent.
Women are also still underrepresented in innovation, a disparity that’s likely most pronounced for women of color — although the Lost Einsteins data do not allow for fine-grain estimates of the interplay between gender and race. The study estimates that women account for only about 18.5 percent of inventors nationwide, far below their shares of the U.S. population and the workforce. Only about 0.8 out of every 1,000 girls become inventors as adults, versus 3.5 of every 1,000 boys. (See Figure 5.) The female share of inventors varies somewhat between states, from a low of 11 percent in Idaho to a high of 29 percent in Rhode Island. In only 15 states do women account for 20 percent or more of people who file a patent and become inventors. (See Appendix Table 1.) Though women are innovating at higher rates than in the past, the United States wouldn’t reach gender parity of inventors for another 118 years at the current pace.[39]
Women, People of Color Who Overcame Barriers Contributed Mightily
Many women and people of color have contributed to innovations in a variety of fields throughout history and today, despite the steep barriers to them doing so. For instance, Patricia Bath (1942-2019) was the first African American woman to receive a medical patent, for her innovations in laser eye surgery. Mary Jackson (1921-2005) was NASA’s first female African American engineer. And Lonnie Johnson (1949-present) is an African American engineer who holds over 100 patents. Dr. Virginia Apgar (1909-1974) was a groundbreaking anesthesiologist who pioneered the Apgar Score, used to this day to gauge newborns’ well-being upon exiting the womb. Mary Sherman Morgan (1921-2004) is credited with developing a new kind of rocket fuel that may have “single-handedly saved America’s space program” in the 1950s.a These and other innovations from historically blocked groups contributed mightily to scientific and technological progress over the nation’s history, including untold contributions that went overlooked.
Indeed, these individuals’ accomplishments are all the more striking for the sexism, racism, and economic constraints that many of them had to struggle against to succeed — and that continue to block many people today. Women played an enormous role in the early days of NASA, for example, yet their contributions were often limited to areas of science seen at the time as “women’s work.”b And African American inventors, evidence suggests, sometimes sought to disguise their identity or hide their involvement in innovative pursuits during segregation; for example Garrett Morgan, who invented forerunners to the traffic light and gas mask, reportedly went so far as to hire white people to impersonate him.c Brilliant and successful women and people of color from the past are not exceptions to the rule, they are exceptions that prove the rule.
Moreover, although this report defines innovators mostly as those who file patents for new products or ideas, it is clear that states have also missed out on countless contributions from other types of creative talent over the course of U.S. history — architects, authors, bakers, journalists, muralists, musicians, photographers, poets, and professors — due to the same sorts of barriers that held back past inventors. These are people who help mold our society and enliven our communities, and we’ve lost so many of their contributions to structural racism, sexism, and other obstacles.
a Women You Should Know, “Rocket Girl: Son Restores Mother’s Lost Legacy As America’s First Female Rocket Scientist,” January 7, 2014, https://womenyoushouldknow.net/rocket-girl-son-restores-mothers-lost-legacy-americas-first-female-rocket-scientist/.
b Dylan Matthews, “Meet Margaret Hamilton, the badass '60s programmer who saved the moon landing,” Vox, July 2019, https://www.vox.com/2015/5/30/8689481/margaret-hamilton-apollo-software.
c See Cook, 2011.
Fostering Innovation Can Help States Grow More Prosperous, Equitable
If women, people of color, and children from non-rich families grew up to invent at the same rate as white men from high-income (top 20 percent) families, there would be four times as many inventors in America as there are today, according to the Lost Einsteins study. While data constraints prevent us from replicating the combined racial, gender, and income calculation at the state level, we can calculate states’ potential gain just from eliminating income disparities in innovation. This analysis likely captures a significant share of the resulting innovation gains among communities of color, since disparities by race and income are closely intertwined; in fact, the estimated state-level income gains appear to account for about three-fifths of the Lost Einsteins study’s combined racial, gender, and income effect nationwide.[40]
If children from non-rich families invented at the same rates as children from families at the top 20 percent of income, states could boost their number of inventors by as little as 1.8 times in Utah to as much as 5.4 times in the District of Columbia, as shown in Figure 6. (See Appendix II for more detail.) The potential gain is larger in states where innovation rates have historically been lower and more modest in states that have a higher degree of innovation today. Eliminating income disparities in innovation would be a particularly potent strategy in the South, where invention levels have trailed other regions. Resulting gains would also likely be most pronounced among people of color, in particular Black and Latinx residents, since disparities by race, ethnicity, and income are interrelated.
Opening innovation to a more diverse talent pool could help states both strengthen economic growth and make their economies more equitable, research indicates.
For one, if more young people are given a chance to develop their creative talents and pursue careers in science, medicine, technology, or other innovation-related fields, it might increase the number of new breakthroughs that are essential to driving economic growth and people’s well-being.[41] While we can’t calculate exactly how much expanding the pool of inventors would increase economic growth,[42] research suggests that removing barriers for low-income children and historically blocked groups could expand the overall pie. According to one study, declining labor market discrimination and more access to education for women and African Americans accounted for about 33 percent of growth in overall U.S. GDP per person from 1960 to 2010. Equalizing access to human capital formation and eliminating labor market discrimination for these groups could boost it by another 10 percent, the study also found.[43] An analysis of the gender gap in innovation estimated that eliminating the patenting shortfall among women with science and engineering degrees could increase GDP per capita by 2.7 percent.[44] Another study estimated that GDP per capita could rise by between 0.6 and 4.4 percent if more women and people of color were involved in the innovative process.[45] Other research details how enhancing opportunity for low-income children, such as through public investments in child care and early education, can yield substantial economic returns in time.[46]
Beyond possibly increasing the quantity of innovation and boosting economic growth, knocking down barriers for historically excluded groups could also enhance the quality of new innovations. The fact that scientific and technological innovation has historically been dominated by relatively wealthy white men is not just unfair to other groups, it’s likely bad for innovation itself. That’s because women, people of color, and children who face more difficult circumstances possess a diverse range of ideas, life experiences, and perspectives that society has historically missed out on. Studies suggest that reversing this fact could leverage states’ untapped creative talent in ways that both enhance growth and help ensure that gains from innovation are shared more equitably.
Various research from different fields lifts up the value that diversity, integration, and collaboration have on decision-making and innovation. The findings are nuanced, but studies suggest diversity and collaboration can play an especially important role in generating new ideas and incorporating varied viewpoints, leading in some cases to better results.[47] For example, one study found that academic papers with ethnically diverse co-authors are likelier to be published in more influential journals and to be cited more often.[48] Similarly, other studies document compelling evidence that interaction between researchers of different backgrounds and perspectives,[49] as well as more gender-balanced teams,[50] can result in higher-quality and more impactful innovations. Exposure to new ideas and continuous proximity to different cultures also appears to have some benefits for boosting creative thinking and innovative approaches to problem-solving, potentially leading to novel or previously overlooked solutions.[51] And, the fact that inventors tend to be highly concentrated in cities — in some cases even in specific neighborhoods[52] — where lots of people with diverse backgrounds live in close proximity may further illuminate the link between innovation and contact with distinct perspectives.[53]
In science and innovation specifically, studies indicate that incorporating more diverse researchers can change the composition and approach of research projects, potentially leading to new or better innovations that more homogeneous teams missed in the past.[54] For example, if more historically excluded groups are included in the overall process of innovation — from defining the question to research to implementation — the resulting breakthroughs might better target problems, such as health disparities, that disproportionately affect those groups.[55] When solutions to social and economic challenges are developed with the needs of formerly marginalized groups in mind, and with such groups’ input, evidence indicates it tends to benefit everyone.[56]
COVID-19 Crisis Highlights Importance of Innovation, Need for Structural Solutions
In March 2020, the emergence of COVID-19 presented states with an unprecedented fiscal and economic challenge, not to mention a steep cost in human lives and suffering. The emerging crisis — and the need for new medical treatments such as vaccines to confront it — has been a stark reminder of the role that innovation plays in protecting people’s health and well-being, as well as to ensuring our economic strength. There are two important points about the pandemic in relation to this report.
First, the pandemic has cast a bright light on the deep structural barriers that make many Americans — particularly people of color, women, and communities that economically struggle — especially vulnerable in times of crisis, let alone well-situated to realize their full social and economic potential. For instance, COVID-19 hit communities of color with higher rates of infection, hospitalization, and (especially among Black people) death, due to factors including wealth and income gaps, inadequate access to health care, and racial discrimination built into the health system.a The resulting economic recession also led to larger spikes in unemployment and poverty for people of color, due largely to their higher concentration in low-wage occupations and services industries most affected by pandemic-induced shutdowns.b And, the pandemic highlighted how women’s outsized share of caregiving responsibilities can undercut their economic success; for example, about 1.6 million fewer mothers were in the labor force in the fall of 2020 than there would have been without school closures, according to one analysis.c
Second, bold public investments will be crucial to fostering more innovation and diversifying access to it over time (as detailed later in this report), but the pandemic is hammering the revenues needed to pay for them. For example, states need to aggressively invest in K-12 schools, early learning, and colleges and universities, all while pursuing efforts to boost families’ economic security in the face of illness, hunger, housing eviction, job loss, and other hardship. Yet without some mix of additional federal fiscal aid and proactive revenue-raising by states and localities, current services are in dire risk of budget cuts and new, forward-looking investments on the scale needed seem unlikely. Although state revenues have come in a bit better than early projections suggested, we now estimate that combined state and local shortfalls could total more than $500 billion through 2022.d Further actions by federal policymakers — as well as states and localities — to bolster public finances in 2021 and beyond are sorely needed not only to confront the immediate harm of COVID-19, but also to allow for a stronger, more equitable economic trajectory over time.
a Erica Williams and Cortney Sanders, “3 Principles for an Antiracist, Equitable State Response to COVID-19 — and a Stronger Recovery,” Center on Budget and Policy Priorities, May 21, 2020, https://www.cbpp.org/research/state-budget-and-tax/3-principles-for-an-antiracist-equitable-state-response-to-covid-19.
b Chad Stone et al., “Weakening Economy, Widespread Hardship Show Urgent Need for Further Relief,” Center on Budget and Policy Priorities, November 10, 2020, https://www.cbpp.org/research/economy/weakening-economy-widespread-hardship-show-urgent-need-for-further-relief
c Claire Cain Miller, “When Schools Closed, American Turned to Their Usual Backup Plan: Mothers,” New York Times, November 17, 2020, https://www.nytimes.com/2020/11/17/upshot/schools-closing-mothers-leaving-jobs.html
d Michael Leachman and Elizabeth McNichol, “Pandemic’s Impact on State Revenues Less Than Earlier Expected But Still Severe,” Center on Budget and Policy Priorities, October 30, 2020, https://www.cbpp.org/research/state-budget-and-tax/pandemics-impact-on-state-revenues-less-than-earlier-expected-but
Tracing Innovation’s Racial and Gender Gaps Can Light the Path Forward
To chart a strategy for unlocking more innovation, state and local lawmakers must understand how the nation’s landscape of talent and innovation became skewed in the first place. At the heart of the matter is a force the Opportunity Insights team refers to as “exposure effects,” meaning that disparities in innovation by race, gender, and income are driven not by differences in innate ability but by one’s exposure to parents, mentors, or other role models who were themselves innovators.
Simply put, a child who grows up around people tinkering with things or constantly trying to patent or commercialize new ideas is far more likely to wind up doing so herself. A child who had an inventor as a parent is about nine times likelier to innovate than one who did not, the study estimates. About 18 out of every 1,000 children in households with an inventor become inventors as adults, compared to 2 out of every 1,000 children in non-inventor households. The importance of direct exposure to adult mentors is supported by broader research in the field, such as studies on college access detailing how high-achieving young people are less likely to apply to more selective colleges that match their abilities when they grow up in neighborhoods with fewer college graduates or receive less direct contact from admissions staff.[57]
Research suggests exposure effects play out in some nuanced ways when it comes to race and gender.[58] For example, the Opportunity Insights study observed that women who grew up in an area where women held a higher share of patents in a certain field were significantly more likely themselves to get patents in that field when they grew up. Though data constraints prevented the study from conducting the same analysis on race, it seems probable that children of color would also be more likely to innovate when they receive direct exposure to innovators of their own race, given other research in the field. Black children tend to see the largest improvements in school performance when paired with Black teachers, for instance (in part because white teachers often underestimate them, research suggests).[59] In other words, it seems valuable for children to see people who look like them as innovators or successful professionals for them to pursue similar career paths.
These exposure effects, in essence, create a continuously reinforcing cycle of innovation that stretches over generations. Today’s gaps in innovation by race and gender are not random, but rather clearly stem from the nation’s history of exclusion toward women and people of color. And state-to-state variations in innovation date back to at least the 1880s, research finds, highlighting how present-day disparities in innovation are tightly linked to past policies and practices rather than narrow differences in short-term policies choices today.[60] Unless policymakers confront the underlying causes of gaps in innovation, the chasm will persist.
Exclusion of Women and People of Color Impedes Innovation
The legacy of sexism and racism includes gendered power dynamics and the practices of private institutions, but also public policy, including tax and budget policy.[61] Because innovation is most likely to spring from families, networks, and communities where innovation happened before, it is today less likely to happen among people whose parents and grandparents were deliberately blocked from the opportunity in the first place. And while most policies and practices that are explicitly racist or sexist are now prohibited, structural barriers persist today in many forms, often to significant degrees.
Race
For much of American history, people of color were blocked from the mainstream economy by policies originating with slavery and Indian removal and later evolving into the convict leasing system, Jim Crow, racist immigration quotas, legal and de facto segregation in neighborhoods and schools, disinvestment in predominantly Black schools, and mass incarceration. These policies deny people of color basic rights, liberties, and opportunities, let alone the ability to innovate or to reach their full economic potential.
Explicitly racist policies like slavery and Jim Crow were concentrated in the South, but various forms of public and private discrimination — such as redlining, restrictive housing covenants, harsh local police practices, and intense white opposition to neighborhood integration and busing — were found in communities nationwide.[62] Other actions, such as egregious treatment of Native Americans, the segregation of the U.S. civil service in 1913, the exclusion of predominantly Black occupations from the Social Security Act of 1935, or the internment of Japanese Americans during World War II, were national in scope. These and other overt versions of racism continued deep into the 20th century and in some cases continue in modified form today, for example through mass incarceration and over-policing of Black and brown communities.
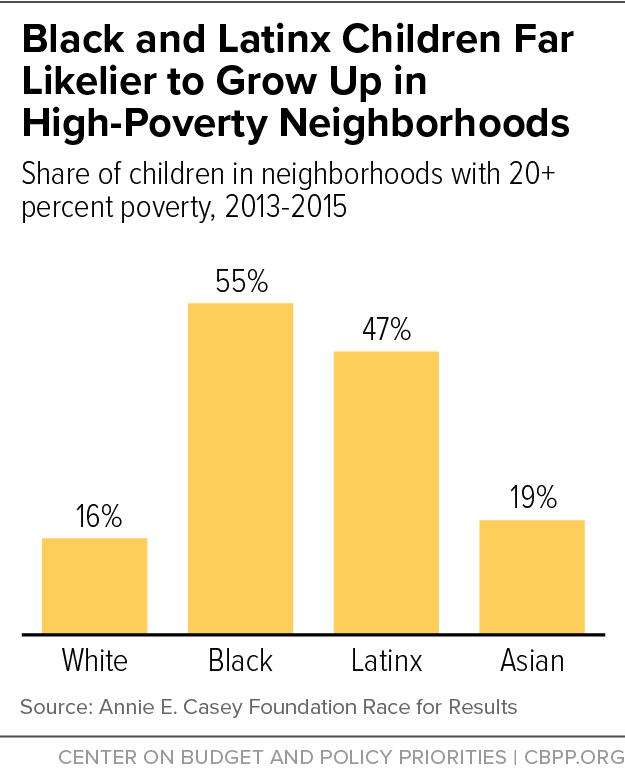
The legacy of past practices and laws continues to shape the opportunities available to people of color today. Plus, ongoing forms of discrimination and bias reinforce racial barriers, erecting a steep hurdle for people of color to exercise their full economic talents or capacity to create. For example, children from Black and Latinx families are far likelier to grow up in high-poverty neighborhoods, where they often lack access to the foundations of upward mobility like good schools, have exposure to a narrower band of life experiences among adult role models, and face a range of other obstacles.[63] An estimated 55 percent of Black and 47 percent of Latinx kids live in high-poverty neighborhoods, well above their white and Asian counterparts. (See Figure 7.) And children of color more commonly face toxic stress due to their environments, which harms personal and social development, can undermine individual and community health, and limits economic opportunity.[64]
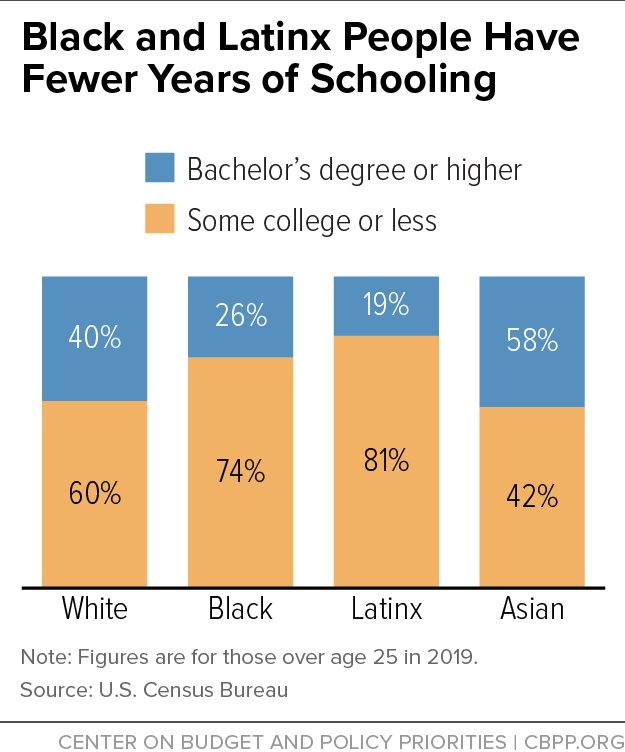
Structural racism and discrimination have also contributed to significant gaps in educational attainment over time, especially when paired with the sharply rising cost burdens working families face paying for college.[65] This trend is particularly important to innovation, given the link between propensity to innovate and parents’ level of schooling. As one widely cited study finds, a “father’s income and . . . education [are] highly correlated with becoming an inventor, especially through the effect on the level of a child’s education.”[66] Today, about 26 percent of African Americans and 19 percent of Latinx Americans have a four-year college degree or more, compared to about 40 percent of white people and 58 percent of Asian Americans. (See Figure 8.) Research also suggests that Black and Latinx Americans receive a lower quality of higher education overall. For example, they are overrepresented at for-profit institutions, which tend to have lower graduation rates and offer inferior instruction, and are significantly underrepresented at the nation’s highest-quality institutions.[67]
Educational gaps sometimes stem directly from racist policies and in other cases the reasons are more structural. For example, a 1992 Supreme Court case detailed how Mississippi, where more than a third of residents are African American, for decades tailored its higher education policies to sharply curtail graduate and doctoral opportunities for Black students after the supposed end of legal segregation.[68] At the same time, gaps exist in other areas of higher education — including in innovation-related fields such as science and medicine — due to the cumulative effect of racial disparities, public policies, and institutional practices. For instance, African Americans are still underrepresented in the medical field, comprising 7.7 percent of medical school students in 2016, below their 13.2 percent share of the U.S. population — something with important implications for both medical innovation and quality of care.[69] And fewer than 1 percent of doctorates in math are held by African Americans.[70]
Beyond education, well-documented disparities in the U.S. criminal justice system cause major disruption to families and networks of support in communities of color. An estimated 63 percent of both African Americans and Native Americans have had an immediate family member in prison or jail, according to one study, compared to 42 percent of white Americans.[71] And the harsh approach to immigrant enforcement that the Trump Administration and some state and local lawmakers have embraced in recent years is deeply harmful to many communities with large numbers of Latinx and Asian Americans.[72] Unfair treatment of Black and brown people starts at an early age, research shows. For example, Black children are likelier than their counterparts to be expelled starting as early as preschool, due in part to the spillover effects of structural racism — such as the stresses of poverty and health disparities that emerge as early as in the womb — but especially due to implicit biases that continue to be widely held in American culture.[73]
Policies that disrupt the pool of adults in communities of color, such as discriminatory immigration and criminal justice practices, as well as barriers to full educational or economic opportunity, could also play a role in undermining children’s future potential to invent. That is due to the importance of adult mentors and role models, which both the Opportunity Insights work and other research suggest is crucial in helping expose children to a wide range of life experiences and put them on a path to future success. Indeed, a breadth of research highlights the importance of stable households and quality relationships in children’s lives.[74] Mentors and role models come in many forms, including mothers and fathers, caregivers, neighbors, teachers, and community elders, and any caring adult in a child’s life plays a vital role in their future development. Yet access to role models varies somewhat across communities due in no small part to discriminatory policies of the past and present.
Various research illustrates how structural racism can disrupt the pool and narrow the range of life experiences among adult mentors in many communities of color. For example, one recent analysis details how many Black communities have a sizable population of “missing men,” or adult males who are absent from an area due to either incarceration or premature death. Nationwide, for every 100 Black women aged 25 to 54 living outside of jail, there are only 83 Black men; between white women and men the equivalent number is 99, or essentially parity.[75] Another study found that college enrollment for Black men fell noticeably after the launch of the federal “war on drugs” in the mid-1980s, which disproportionately targeted communities of color.[76] And, a separate study from the Opportunity Insights team finds that Black children are far likelier to grow up in high-poverty neighborhoods where fewer than half of fathers in the community are “present” (defined as claiming a child as dependent on male tax forms), which their analysis suggests could limit children’s access to the full range of adult mentors and life experiences.[77]
Gender
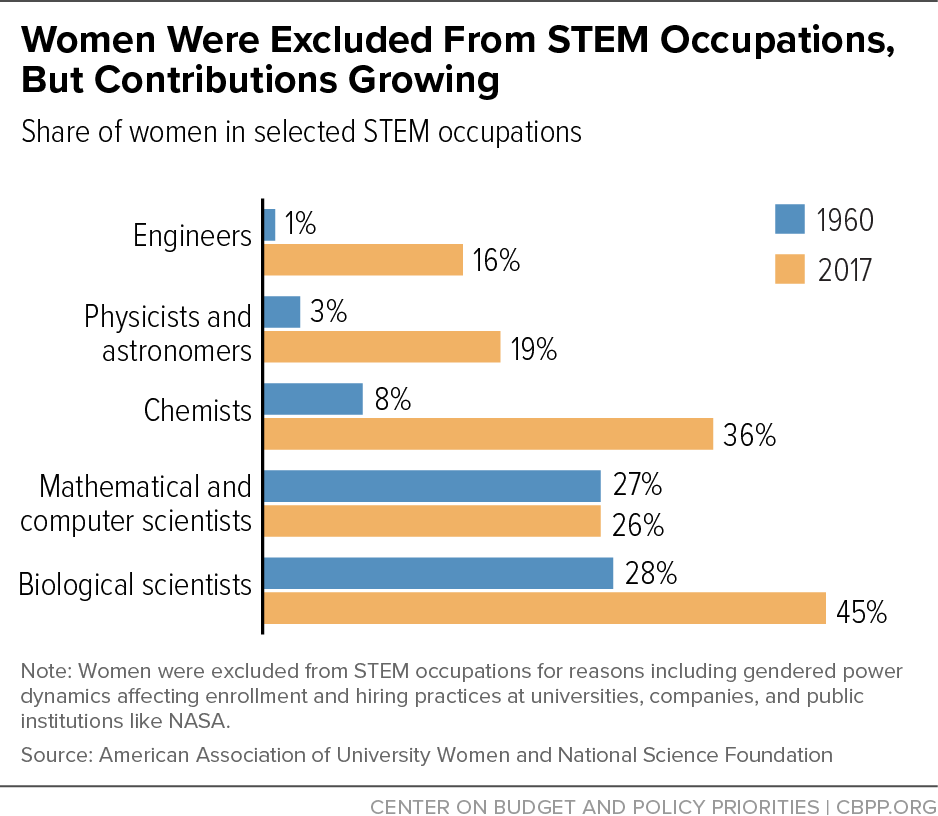
Similarly, women were and are far less likely to be inventors. Research indicates that they comprised about 3.5 percent of inventors in 1880, about 6.5 percent in 1940, and an estimated 18 percent today.[78] Women also account for only 16 percent of the nation’s engineers and 27 percent of mathematical and computer scientists. (See Figure 9.)[79] Though gender equity at educational and scientific institutions has improved markedly over prior decades, gains are uneven across the workforce; for instance, while women account for 34 percent of the total workforce at NASA, they constitute only 16 percent of that agency’s senior scientific and other senior-level positions.[80]
Innovation gender gaps are certainly not due to differences in innate ability, as confirmed by the Lost Einsteins study and other research. The Opportunity Insights team found that only 2.4 percent of the innovation gap between men and women could be attributed to third-grade math scores, since boys and girls test similarly at that age overall. Additional studies have found that gender disparities in STEM fields vary significantly between countries, echoing the importance of social, cultural, and policy factors over gender-based aptitude for math and science. For example, women receive nearly half of engineering degrees in Indonesia, and about a third in a diverse set of countries that includes Denmark, Greece, Mongolia, and Panama — compared to fewer than 20 percent in the United States.[81]
Men’s historical innovation dominance in the United States traces to a combination of public policy, private institutional practices, and gendered power dynamics that blocked women from creative pursuits. As with people of color, public policies systematically blocked women from economic opportunity for a broad swath of U.S. history, from an 1870s Supreme Court ruling letting states exclude married women from practicing law, to more recent policies such as a law allowing private employers to refuse to hire women with pre-school age children until 1971 and to advertise certain jobs as men-only until 1973.[82]
Women of color have faced particularly steep challenges, from slavery at the nation’s founding to employers broadly excluding Black and brown women from mainstream employment until the 1970s. New Deal-era legislation on minimum wage, overtime pay, and collective bargaining excluded the main sectors where Black women worked.[83] Today, women of color participate in the labor force at higher rates than men and white women and yet are paid less on average, due to historical and structural factors ranging from harsh criminal justice policies requiring more women of color to serve as breadwinners to discriminatory practices that push them disproportionately into low-wage service jobs.[84]
Women in general were often discouraged from pursuing opportunities when they chose and were allowed to do so, such as facing barriers to entering higher education and employment in lucrative fields including science or medicine. For example, women accounted for about 1 percent of engineers and less than 4 percent of physicists and astronomers in 1960. (See Figure 9.)[85] They made up only about 7 percent of medical school graduates in 1966, versus 46 percent in 2016.[86] These disparities have often stemmed from gendered power dynamics, namely that men exerted the lion’s share of control over the enrollment and hiring practices of universities, companies, and other avenues of advancement. While explicit sexism is less pronounced than in prior decades, stereotypes and implicit bias still permeate organizational decision-making; one study, for instance, found that STEM employers systematically underrated women’s mathematical capability — resulting in a sizable share of lower-performing men receiving jobs over higher-performing women.[87]
Similarly, gendered power dynamics that often manifest in rigid social norms further limit women’s career and life choices. Both today and in the past, women are (and were) likelier to serve as caregivers or homemakers than to pursue uninterrupted, lifelong careers — sometimes by choice but oftentimes due to other factors. One study found that while girls tend to outperform boys in math in non-wealthy school districts, the opposite is true in more affluent communities, at least in part because wealthier families are somewhat likelier to exhibit more traditional gender norms, such as investing more tutoring resources in male children or gravitating toward traditional, gender-specific extracurricular activities.[88] Other research estimates that about half of the gender achievement gap in mathematics is due to teachers’ systematic underrating of girls from kindergarten through eighth grade.[89] Male-dominated fields also tend to be less flexible in accommodating the needs of caregivers including parents of young children, research suggests, which can push some women out.[90] And another analysis determined that women are least likely to enter academic fields where they expect to encounter discrimination (such as getting less credit for co-authored reports) or face difficulty advancing, a finding that stretches beyond STEM fields to also include things like criminal justice and economics.[91]
Due to the role that female role models play in young girls’ innovative potential, this exclusion of women continues to play a significant role today. Indeed, the Lost Einsteins study estimates that if girls were as exposed to female inventors as boys are to male ones, the gender gap between male and female inventors would fall by half.
More Restrictive Places Appear Least Conducive to Innovation
It is also inescapable that the region of the country that appears least conducive to innovation today — the South — is the same region that historically enacted the harshest barriers to social and economic participation and that was most likely to underinvest in its own people, especially communities of color. Although states of the old Confederacy are certainly not alone in erecting barriers to Black and brown people, that region’s low-investment, racialized approach appears to have cast a long shadow of undermining both innovation and economic mobility broadly.
Of the ten lowest-innovation states today in the Lost Einsteins study (including the District of Columbia), nine of them were slaveholding states at the dawn of the Civil War.[92] Slavery’s long legacy continues to exert significant social and economic fallout today, a growing body of research suggests.[93] States with high slave populations in 1860 were disproportionately among the least inventive in the United States between 1880 and 1940, according to one study.[94] And swaths of the South with large slave populations before the Civil War remain some of the most economically depressed areas of the country today, as well as some of the hardest spots for children born into poverty to reach the middle class or beyond.[95]
Part of the explanation for this regional trend, in innovation and otherwise, is the historical barriers to opportunity that followed slavery. For example, one study details how patenting activity among African Americans from 1843 to 1930 was much lower in places with segregation laws, due to both formal and informal barriers to their participation.[96] Another recent analysis found that from 1870 to 1940, Black people living in the North were eight times more likely to receive a patent than Black people living in the South, and that the share of patents going to Black northerners was equal to their share of that region’s population (1.6 percent).[97]
In addition, school segregation and stark differences in education funding between Black and white children undercut opportunity for generations of African Americans, a trend that stretched well beyond the South to include other communities with large Black populations, such as Boston, Chicago, and New York.[98] At the same time, pockets of innovation in Southern locales like Austin, Texas and North Carolina’s Research Triangle highlight how state and local policymakers in more regressive political environments have been able to strengthen economic opportunity and invest in building blocks of equitable growth like good public schools and community colleges.[99]
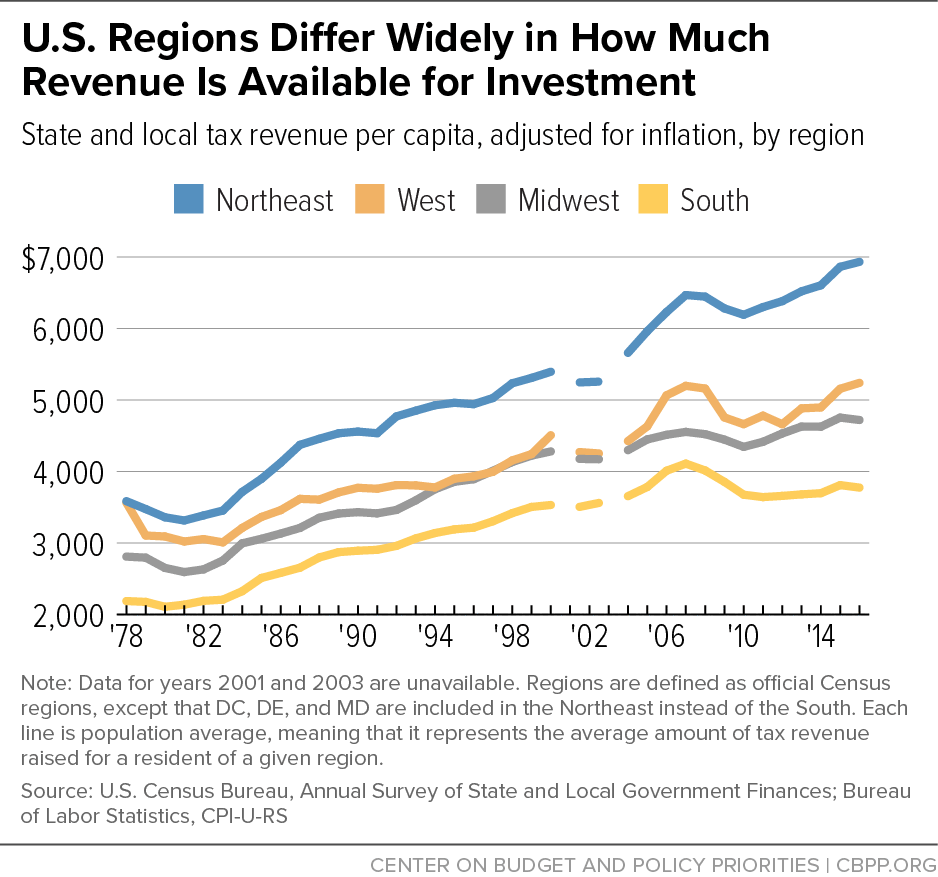
One relevant piece of the puzzle is that per person, the South has historically collected less revenue and invested less in public goods than other parts of the country. The region’s fiscal approach dates to antebellum times, when levies on slaveholders accounted for a sizable share of state revenues, and states collected relatively few broad-based taxes.[100] Following the Civil War, biracial Reconstruction governments were able to briefly pursue more aggressive tax policies in order to fund schools, infrastructure, and public assistance — with taxes in the South nearly doubling from 1860 to 1870, according to one study — but those gains were largely reversed by the “redeemed” white governments that seized control of most southern states by 1880.[101] The region’s low-tax, low-investment approach continues in less extreme form today. (See Figure 10.) Southern states raised an average $3,774 per resident in 2016, compared to $6,933 in the Northeast. These regional differences in state and local tax revenue per capita have been consistent since at least the late 1970s, according to available data.[102]
Another reason why regions with a history of repression appear less conducive to innovation is that, according to some research, places tend to be more productive and creative when their social norms are more open to personal expression and cultural change, rather than adherence to tradition.[103] For example, a study of math test scores among U.S. immigrants found that girls whose parents come from more gender-equal countries perform better than those whose parents come from less gender-equal countries.[104] The Lost Einsteins study points to some evidence that states where traditional gender stereotypes are less rigid tend to have more girls become inventors as adults.[105] And the Opportunity Insights team’s broader body of research indicates that restrictive racial policies are harmful not only for people of color — who are most directly and severely affected — but for many white residents of affected areas and their descendants as well.[106]
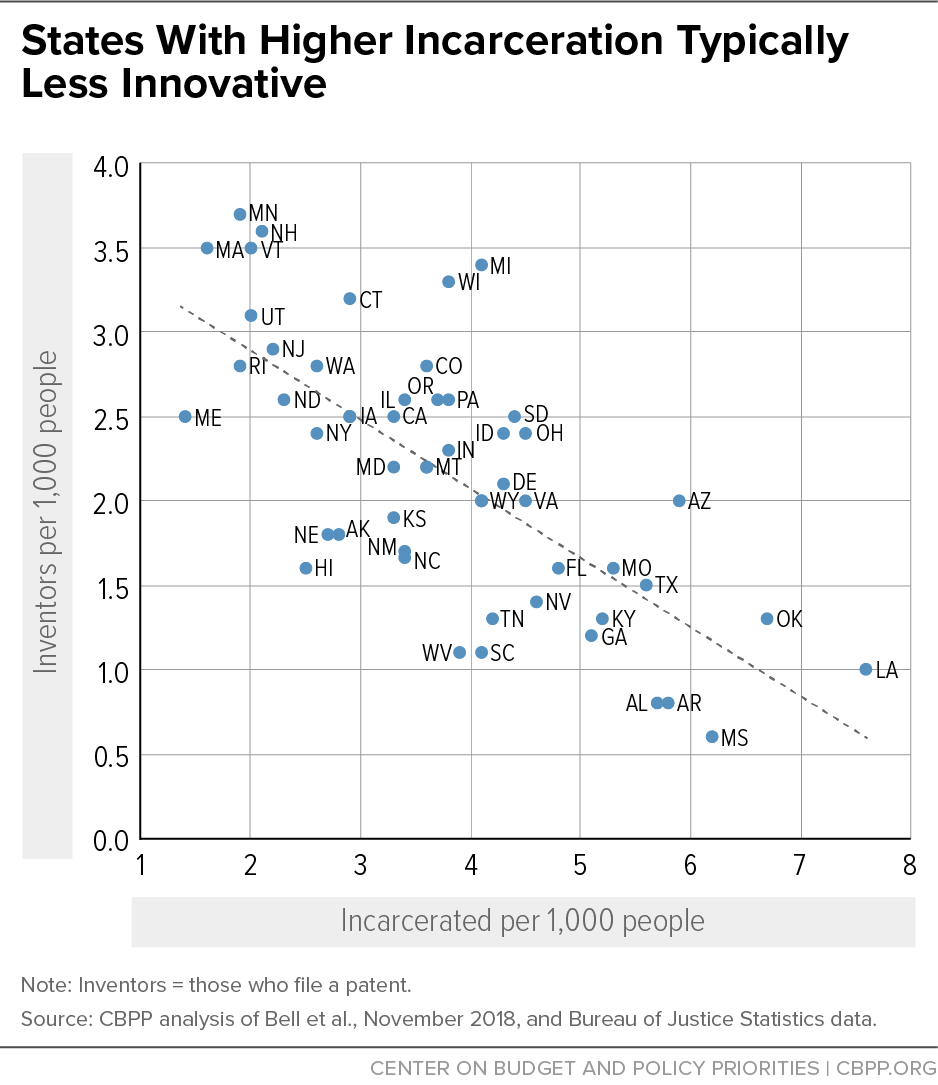
Social and political barriers to participation, as well as state and local policies that undercut people’s ability to reach their full economic potential, continue in many forms today nationwide. For instance, one study found that Black girls and boys in the South account for 24 percent of student enrollment but nearly half of students suspended or expelled from public schools, pointing to implicit bias and other problems in school discipline.[107] And states differ sharply on their rates of incarceration, from 137 people incarcerated per 100,000 state residents in Maine to a high of 760 per 100,000 people in Louisiana.[108] States with harsher incarceration policies appear to be somewhat less conducive to innovation. (See Figure 11.) Of the 25 lowest-innovation states, 18 have above-median levels of incarceration.
Tax Cuts Appear Unlikely to Find and Promote Lost Einsteins
Some lawmakers may find it appealing to try to boost innovation by slashing state or local tax rates. The full body of research on the interplay between tax policy and innovation is nuanced, with some studies finding tax rates play a meaningful role and others pointing to minimal or negligible effects. A recent Opportunity Insights study is in the latter camp, and while a full review on the links between state and local taxes and innovation is beyond the scope of this report, its findings are notable.
A 2019 companion report to the Lost Einsteins work, “Do Tax Cuts Produce More Einsteins? The Impacts of Financial Incentives vs. Exposure to Innovation on the Supply of Inventors,” finds that financial incentives, including tax cuts, appear unlikely to draw more high-impact inventors from overlooked or excluded groups into the field.a For one, financial incentives have only limited impact on the decisions of star inventors, given that they already receive huge financial returns from their inventions.b Additionally, financial incentives are poorly equipped to close racial or gender gaps in innovation, since those disparities are largely caused by lack of exposure to inventors and other creative talents at early ages — rather than lack of access to short-term financial resources as adults.
The 2019 companion report also notes that while lower income tax rates would likely increase the total number of inventors, the resulting impact on economic growth could be quite small since altering financial incentives would likely just draw in low-quality inventors at the margins, rather than the kind of prolific, high-quality innovators most responsible for economic growth.c Policies designed to entice more members of historically underrepresented groups into innovative pursuits earlier in life hold more promise, the study suggests.d
a Bell et al., 2019.
b The highest-paid 1 percent of inventors (whose annual income exceeds $1.6 million per year) earn more than 22 percent of inventors’ total income. The top-heavy nature of returns from innovation stands in contrast to other high-skilled professions, such as medicine or law, which have much more homogeneous income distributions. These very well-compensated inventors would presumably continue to innovate even if they made marginally lower returns. As described by Bell et al., “Intuitively, when returns are very skewed, taxes only affect inventors’ payoffs when they are very deep in the money and are not sensitive to financial incentives, resulting in small behavioral responses.”
c Put another way, tinkering with tax rates doesn’t attract any new “Einstein-level” inventors from historically marginalized groups, since people with that degree of potential talent were likely screened out of innovation at earlier ages due to other factors. As the Lost Einsteins team notes, “Although lower income tax rates do increase the number of inventors, their impact on aggregate (quality-weighted) innovation is likely to be quantitatively small. In contrast, increasing exposure to innovation could have substantial impacts on innovation by drawing more star inventors (“Einsteins”) into the field.”
d Will McGrew, “New research suggests early exposure to innovation is more effective than financial incentives in stimulating innovation,” Washington Center for Equitable Growth, April 29, 2019, https://equitablegrowth.org/new-research-suggests-early-exposure-to-innovation-is-more-effective-than-financial-incentives-in-stimulating-innovation/.
States Should Invest in People, Dismantle Barriers to Unleash More Innovation
The traditional tools policymakers have used to foster innovation, such as increasing funding for R&D, recruiting more young women in STEM fields, and expanding access to startup capital, are sensible ways to try and unlock more people’s creative talents.
The Lost Einsteins researchers, for example, conclude that targeted interventions such as STEM mentorships and intern programs are likely the most direct way to diversify access to innovation, due to the importance of young people gaining personal exposure to scientists and inventors. Evidence certainly suggests these strategies can play an important role. For example, one study of a gender-specific mentoring program in France found that just a one-hour connection with female role models from a scientific field boosted the chances that 12th grade girls would choose a STEM major after graduating high school by about 10 percent.[109]A recent study of a 1970s bootcamp-style program designed to increase diversity in the U.S. economics field found that participants were significantly more likely to apply to, attend, or complete a Ph.D. program in economics, as well as work in an economics-related academic job.[110] And an ongoing effort in Portland, Oregon to require tech-based companies to invest in community goals such as inclusive access to jobs, mentorship, and entrepreneurship opportunities in innovation appears promising.[111] More research is needed on how states could scale these sorts of personalized interventions, but exploring them further — such as through tailored programs and pilot projects on the local level — is a worthy endeavor.
At the same time, state policymakers can also pursue broader strategies designed to confront the underlying, structural reasons that caused the pool of U.S. innovators to become so skewed by race, gender, and income in the first place. Today’s innovation disparities stem from a long legacy of policies and practices that inhibited people’s opportunity to contribute. Due to structural racism and sexism going back generations, women and people of color are less likely to become inventors today, and states that were less conducive to innovation in the past are far likelier to still be so. Lawmakers committed to expanding the pool of inventors can begin by enacting policies with a proven track record of maximizing people’s underlying talents and ability to contribute, ranging from stronger and more equitable investment in public education to rolling back unwise criminal justice policies and boosting access to family leave. A diverse body of research, both on innovation itself and on economic opportunity more generally, suggests that state and local policies in this vein could help eliminate the structural barriers that block so many from creative pursuits, and thus promote more and better innovation both today and down the road. Available evidence suggests that the best ways to start include the following:
Prioritize high-quality learning for all children from birth through adolescence. Research on innovation stresses the importance of getting talented young people from diverse backgrounds on a path to innovation at an early age, a goal that state and local policymakers are well-positioned to pursue.[112] State and local governments provide more than 90 percent of the funding for K-12 schools nationally, though funding is still below pre-recession levels in many places.[113] And momentum has built in the past few years for broader and more equitable access to early education, with 15 states plus the District of Columbia now requiring that districts offer full-day kindergarten.[114] By boosting funding for public education at all ages and working to ensure it’s targeted in ways that do the most good, lawmakers can enrich the overall learning environment available to young people — putting them on a more likely path to future creative pursuits.
One promising area for additional investment is pre-K education, which several states have prioritized in recent years. Rigorous, conclusive evidence indicates that high-quality preschool creates the foundation for learning. But access to it is inequitable, varying widely across states, and low-income and many middle-class families cannot afford private programs.[115] States can choose from a range of proven strategies for expanding and improving their early education offerings, in particular adding pre-K slots, bolstering teacher pay and training, and strengthening support services for the youngest children and their families, especially those in poverty. Strengthening pre-K policies could have an even larger benefit if paired with efforts to improve access to quality early care for infants and toddlers (0-3 years old), such as through home visiting programs and enhancements to Early Head Start. Ensuring that young children from all backgrounds spend their earliest years in a safe and loving environment is essential to their future development.
Efforts to enrich children’s learning and maximize their creative potential can also continue through K-12. Studies on innovation suggest that while low-income children start out with similar innate abilities as their higher-income peers, the propensity to invent widens during children’s primary school years. Innate inventive ability (as measured by math scores) accounts for only about 6 percent of the innovation gap between low- and high-income children in the third grade, but 60 percent by the end of high school, the Lost Einsteins study found.[116] That suggests more intense, targeted state support for K-12 schools can help promising young people of all backgrounds stay on track.[117] The evidence is clear that school funding levels matter, as does how schools spend their resources.[118] One study, for example, found that low-income students whose school districts received a boost in funding performed better in school and earned more as adults.[119] And California has improved student outcomes with a new school funding formula designed to better target resources to high-poverty schools and districts with many disadvantaged students, including English learners, foster youth, and students from low-income families.[120]
Bolster families’ economic security so that more people can pursue innovation. Economic insecurity is linked to a range of bad outcomes for children, such as higher stress levels and lower educational achievement, and also weakens young people’s likelihood of realizing their economic potential as adults. Working to raise household income and make sure families can access the services they need is therefore a straightforward way for policymakers to foster more innovation long term, as well as to improve children’s outcomes and their likelihood of future success more generally. Lawmakers have many sensible tools at their disposal to achieve this goal, including providing targeted tax credits to working families,[121] expanding access to affordable health services,[122] or enacting a robust state minimum wage.
Enacting policies to raise family incomes and enhance economic security through public supports might foster additional innovation in the short run as well. Adults are more likely to pursue creative ventures when they feel economically secure and have a basic level of financial well-being that allows them to take risks, research suggests. For example, studies have found that low- and moderate-income people with entrepreneurial ideas are likelier to start a new business when they have access to public supports such as health insurance and food assistance.[123] And, a recent analysis of 35 developed countries found that places with higher social welfare spending also had more patenting — in part, the authors contend, because people are likeliest to exhibit high levels of creativity and innovation when they feel happier with their economic condition and less fearful of short-term calamity.[124]
Leverage investments in higher education to strengthen and diversify community networks of innovation. State and local spending is a major source of support for public colleges and universities; in 2017, it constituted 54 percent of the funds that public two- and four-year institutions used directly for teaching and instruction.[125] Protecting and expanding these investments — many of which remain depressed from a decade of disinvestment after the Great Recession — can play a multifaceted role in bolstering innovation long term.
For one, institutions of higher learning have historically served as hubs for fostering innovation. Expanding their footprint could heighten exposure to innovation for a larger and more diverse collection of young talent. The opening of three technical research universities in Finland boosted patenting there by 20 percent, one study found, in large part by drawing more students from surrounding regions into engineering programs.[126] Enriching local educational pathways could provide both immediate and long-term benefits: young adults already exhibiting innovative potential would have access to more options in the short term, while down the road talented children would have greater exposure to local mentors and role models engaged in those pursuits.[127] Investments in higher education might prove especially beneficial if targeted to institutions that serve large cohorts of people historically excluded from innovation, such as community colleges, women’s colleges, and HBCUs (historically Black colleges and universities).[128] Directing new financial support to learning institutions in a broad range of locales nationwide, rather than just traditional hubs of innovation, could also help narrow regional disparities over time.[129]
Sustained support for colleges and universities can also help identify and elevate promising young people from traditionally overlooked communities. For example, a large share of high-achieving students from struggling families fail to apply to any selective colleges or universities, a 2013 Brookings Institution study found.[130] About 15 high-achieving, high-income students apply to selective colleges for every 1 high-achieving, low-income student, the analysis found. Prior research points to a raft of low-cost interventions that show some promise in targeting these sorts of high-achieving yet overlooked young people.[131]
The benefits of increasing the supply of highly educated mentors and role models among historically excluded groups would likely be generational. As one recent study argues, parental education may be the most important influence on a young person’s likelihood to innovate, even more so than family income. The study’s authors note, “Our results suggest that by massively investing in education up to (STEM) Ph.D. level, a country should significantly increase its aggregate innovation potential while making innovation more inclusive” (emphasis added).[132]
Foster more diverse professional networks, communities, and schools. Diversity and collaboration can add value to decision-making and creative pursuits, and places with a history of racial segregation due to repressive public policies are less conducive to innovation, as described earlier in this report. One way to generate more innovation could therefore be to enact policies that help create more diverse and collaborative environments both for adults who have good ideas today, and for children, the potential innovators of tomorrow.
In the short run, this could mean experimenting with ways to connect up-and-coming innovators and entrepreneurs with more diverse professional networks, where they can come together with mentors and collaborators to share ideas, learn from one another, maximize creative thinking, and access potential sources of funding. For example, as part of their economic development strategies, some state and local governments provide funding to high-tech incubators, which are physical locations (sometimes attached to public research institutions) that provide budding entrepreneurs and innovators with services that include mentoring, networking, subsidized office space, and in some cases access to capital.[133] But women and people of color participate in incubators at relatively low rates, which likely limits the amount and impact of innovations such efforts produce.[134] To better link these historically excluded groups to the innovation sector, policymakers can look to promising models like the Emerging Technology Center in Baltimore, BioSTL in St. Louis, or TECH Fort Worth in Texas, which have employed a range of tactics such as enhanced recruitment and an inclusive approach to mentoring to boost participation rates among people of color and women.[135]
Looking long term, another strategy to enhance innovation could be policies that allow for more young people to grow up or attend school in diverse, integrated environments, since research suggests these settings may prove conducive to nurturing creative talent.[136] When young people (regardless of race) have opportunities to learn alongside those with backgrounds and life experiences different from their own, it can strengthen their ability to think critically and problem solve, and to do so in more novel and innovative ways.[137] It may also help instill a set of social values, such as greater empathy and lower racial prejudice, that allow young people to continue tapping the benefits of cross-group relationships as adults; for example, students who attended racially diverse high schools were more likely to live in diverse neighborhoods five years after graduation, according to one study.[138] Growing up with more access to mentors and role models with varying backgrounds can also carry such benefits as exposure to a wider range of career pathways and better preparation for how to thrive in diverse professional teams.[139]
For decades government policies created and enforced racial segregation and disinvested in low-income Black neighborhoods and other communities of color, leaving the racial and socioeconomic stratification of schools[140] and neighborhoods[141] deeply entrenched. These policies of segregation and disinvestment have resulted in the underfunding of schools attended predominantly by children of color, which evidence shows degrades instructional quality and limits student access to advanced courses, enrichment activities, and other avenues of advancement.[142] Working to reverse this legacy by adequately investing in all communities,[143] while looking for ways to enhance their diversity where possible, could offer policymakers a powerful tool to unlock more children’s innovative potential over time.
Pursue a range of policies that break down barriers for women, people of color, and others too often overlooked. Lastly, there are many ancillary efforts that could also help unlock the nation’s creative potential, in particular policies that seek to dismantle structural racism and sexism. One such effort is criminal justice reform. Disrupting the pool of adult mentors and role models — a trend closely linked to the legacy of bondage, over-policing, mass incarceration, and other forms of structural racism — undermines economic opportunity and the potential for innovation in some communities of color. It’s worth strengthening community networks of support by dismantling unwise criminal justice policies, including regressive criminal legal fees and fines. States can reduce their incarceration rates — without harming public safety — by reclassifying low-level felonies as misdemeanors where appropriate, expanding the use of alternatives to prison (such as fines and victim restitution), shortening jail and prison terms, and eliminating prison sentences for technical violations of parole or probation where no new crime has been committed.[144]
Another promising angle is to support family policies designed to help women balance work and caregiving, such as paid leave, affordable child care, and control over personal reproductive rights. Some evidence suggests women may be shying away from long-term career commitments due to the exorbitant costs of raising a family, along with outdated workplace norms around family leave.[145] Female physicians are likelier to reduce hours due to caregiving responsibilities, and they are less likely to advance to full professorships or leadership positions at medical schools.[146] Caregiving challenges are especially relevant to innovation given that inventors tend to make their highest-impact, most-cited discoveries in their mid-40s.[147] The challenges women face in pursuing careers in innovation reinforce the lack of female role models, which undermines the ability of young girls to see themselves as future innovators and further entrenches gender disparities in the field. While the United States is unique among Western nations in not providing paid maternity and parental leave, states and localities can fill the void; California, the District of Columbia, New Jersey, Rhode Island, and Washington State have enacted laws providing it, for instance, and Colorado passed a ballot measure in November 2020 that will phase in a program over the next three years.
Conclusion
Unlocking more people’s creative talents is an overlooked, exciting chance for states to bolster economic growth, dismantle barriers to opportunity, and build more prosperous, equitable communities. Our nation’s total pool of innovators and their contribution to our collective health and well-being are far lower than they could have been had all people been provided opportunities to thrive, rather than some being blocked due to race, gender, or background. Especially in historically low-innovation areas such as the South, states could gain mightily if more people had the opportunity to share their ideas and creative talents with the world.
Appendix I
| APPENDIX TABLE 1 | |||||||
|---|---|---|---|---|---|---|---|
| Innovation Rates and Gender Disparities, by State | |||||||
| State | Inventors per 1,000 children | Overall rank | Inventors per 1,000 male children | Male rank | Inventors per 1,000 female children | Female rank | Women inventors, percent of total |
| Alabama | 0.8 | 49 | 1.3 | 50 | 0.3 | 47 | 18.3% |
| Alaska | 1.8 | 32 | 3.0 | 32 | 0.6 | 34 | 15.8% |
| Arizona | 2.0 | 29 | 3.3 | 28 | 0.7 | 25 | 18.3% |
| Arkansas | 0.8 | 50 | 1.4 | 49 | 0.2 | 51 | 11.6% |
| California | 2.5 | 20 | 4.0 | 20 | 1.0 | 14 | 19.3% |
| Colorado | 2.8 | 10 | 4.7 | 9 | 1.0 | 11 | 16.8% |
| Connecticut | 3.2 | 7 | 5.2 | 8 | 1.3 | 5 | 20.0% |
| Delaware | 2.1 | 27 | 3.2 | 30 | 0.8 | 20 | 20.4% |
| District of Columbia | 1.0 | 48 | 1.7 | 46 | 0.3 | 48 | 15.0% |
| Florida | 1.6 | 37 | 2.5 | 37 | 0.7 | 28 | 22.4% |
| Georgia | 1.2 | 44 | 1.8 | 45 | 0.5 | 39 | 22.4% |
| Hawai’i | 1.6 | 36 | 2.3 | 40 | 0.9 | 19 | 26.5% |
| Idaho | 2.4 | 22 | 4.2 | 16 | 0.6 | 37 | 11.3% |
| Illinois | 2.6 | 16 | 4.2 | 18 | 0.9 | 16 | 17.8% |
| Indiana | 2.3 | 24 | 3.8 | 23 | 0.8 | 24 | 16.0% |
| Iowa | 2.5 | 17 | 4.2 | 15 | 0.8 | 22 | 15.3% |
| Kansas | 1.9 | 31 | 3.3 | 29 | 0.6 | 33 | 15.0% |
| Kentucky | 1.3 | 42 | 2.2 | 42 | 0.5 | 43 | 17.7% |
| Louisiana | 1.0 | 47 | 1.7 | 47 | 0.3 | 49 | 13.7% |
| Maine | 2.5 | 19 | 4.0 | 19 | 1.0 | 15 | 19.1% |
| Maryland | 2.2 | 26 | 3.5 | 26 | 0.9 | 18 | 20.6% |
| Massachusetts | 3.5 | 3 | 5.6 | 3 | 1.4 | 3 | 20.4% |
| Michigan | 3.4 | 5 | 5.5 | 4 | 1.2 | 7 | 17.8% |
| Minnesota | 3.7 | 1 | 6.1 | 1 | 1.3 | 6 | 17.0% |
| Mississippi | 0.6 | 51 | 0.9 | 51 | 0.2 | 50 | 16.8% |
| Missouri | 1.6 | 38 | 2.6 | 36 | 0.5 | 41 | 15.4% |
| Montana | 2.2 | 25 | 3.8 | 24 | 0.6 | 36 | 12.6% |
| Nebraska | 1.8 | 33 | 2.9 | 33 | 0.7 | 30 | 18.4% |
| Nevada | 1.4 | 40 | 2.4 | 39 | 0.4 | 45 | 15.1% |
| New Hampshire | 3.6 | 2 | 5.5 | 5 | 1.7 | 1 | 23.2% |
| New Jersey | 2.9 | 9 | 4.4 | 13 | 1.3 | 4 | 23.0% |
| New Mexico | 1.7 | 34 | 2.8 | 34 | 0.7 | 29 | 20.0% |
| New York | 2.4 | 21 | 3.9 | 22 | 1.0 | 10 | 20.0% |
| North Carolina | 1.7 | 35 | 2.7 | 35 | 0.6 | 31 | 19.3% |
| North Dakota | 2.6 | 15 | 4.4 | 12 | 0.7 | 26 | 14.0% |
| Ohio | 2.4 | 23 | 3.8 | 25 | 1.0 | 9 | 20.5% |
| Oklahoma | 1.3 | 41 | 2.3 | 41 | 0.4 | 46 | 14.1% |
| Oregon | 2.6 | 13 | 4.5 | 11 | 0.8 | 23 | 14.4% |
| Pennsylvania | 2.6 | 14 | 4.2 | 17 | 1.0 | 12 | 18.6% |
| Rhode Island | 2.8 | 12 | 4.0 | 21 | 1.6 | 2 | 28.7% |
| South Carolina | 1.1 | 46 | 1.6 | 48 | 0.5 | 38 | 24.8% |
| South Dakota | 2.5 | 18 | 4.4 | 14 | 0.6 | 35 | 11.4% |
| Tennessee | 1.3 | 43 | 2.1 | 43 | 0.4 | 44 | 16.9% |
| Texas | 1.5 | 39 | 2.4 | 38 | 0.5 | 40 | 17.2% |
| Utah | 3.1 | 8 | 5.2 | 7 | 0.8 | 21 | 13.6% |
| Vermont | 3.5 | 4 | 6.0 | 2 | 0.9 | 17 | 12.9% |
| Virginia | 2.0 | 30 | 3.2 | 31 | 0.7 | 27 | 18.5% |
| Washington | 2.8 | 11 | 4.6 | 10 | 1.0 | 13 | 16.8% |
| West Virginia | 1.1 | 45 | 1.8 | 44 | 0.5 | 42 | 20.5% |
| Wisconsin | 3.3 | 6 | 5.5 | 6 | 1.1 | 8 | 16.8% |
| Wyoming | 2.0 | 28 | 3.4 | 27 | 0.6 | 32 | 14.7% |
| United States | 2.2 | 3.5 | 0.8 | 18.5% | |||
Appendix II
| APPENDIX TABLE 2 | ||||||
|---|---|---|---|---|---|---|
| Gains From Eliminating Income Disparities in Innovation | ||||||
| State | Current innovation rates (inventors per 1,000 people), by parental income quintile | Potential gain from eliminating disparities | ||||
| Bottom 20% | Low-middle 20% | Middle 20% | Upper-middle 20% | Top 20% | ||
| Alabama | 0.2 | 0.3 | 0.6 | 1.1 | 2.8 | 3.5 |
| Alaska | 0.7 | 0.9 | 0.6 | 1.7 | 3.6 | 2.0 |
| Arizona | 0.7 | 1.0 | 1.5 | 2.1 | 4.9 | 2.4 |
| Arkansas | 0.2 | 0.4 | 0.9 | 1.6 | 2.0 | 2.6 |
| California | 0.9 | 1.1 | 1.5 | 2.3 | 6.0 | 2.4 |
| Colorado | 1.1 | 1.1 | 1.9 | 2.6 | 6.0 | 2.1 |
| Connecticut | 0.5 | 1.4 | 1.9 | 2.8 | 5.9 | 1.8 |
| Delaware | 0.3 | 0.6 | 1.2 | 2.0 | 5.4 | 2.6 |
| District of Columbia | 0.2 | 0.2 | 0.3 | 0.6 | 5.3 | 5.4 |
| Florida | 0.5 | 0.9 | 1.3 | 2.2 | 4.4 | 2.8 |
| Georgia | 0.2 | 0.4 | 0.9 | 1.4 | 3.2 | 2.7 |
| Hawai’i | 0.3 | 0.6 | 0.9 | 1.4 | 4.5 | 2.8 |
| Idaho | 1.3 | 0.9 | 2.0 | 3.2 | 5.2 | 2.1 |
| Illinois | 0.5 | 0.9 | 1.5 | 2.6 | 5.7 | 2.2 |
| Indiana | 0.6 | 1.0 | 1.4 | 2.6 | 5.4 | 2.3 |
| Iowa | 0.9 | 1.3 | 1.8 | 3.0 | 5.1 | 2.0 |
| Kansas | 0.6 | 1.0 | 1.4 | 2.3 | 3.8 | 2.0 |
| Kentucky | 0.4 | 0.6 | 0.8 | 1.5 | 4.4 | 3.3 |
| Louisiana | 0.3 | 0.4 | 0.8 | 1.2 | 3.4 | 3.5 |
| Maine | 0.7 | 1.4 | 1.8 | 3.0 | 6.5 | 2.6 |
| Maryland | 0.7 | 0.5 | 1.2 | 1.7 | 4.9 | 2.3 |
| Massachusetts | 1.0 | 1.4 | 2.4 | 2.9 | 6.6 | 1.9 |
| Michigan | 0.7 | 1.4 | 1.8 | 3.1 | 7.5 | 2.2 |
| Minnesota | 1.0 | 1.6 | 2.5 | 3.2 | 7.7 | 2.1 |
| Mississippi | 0.2 | 0.3 | 0.5 | 0.9 | 2.2 | 3.9 |
| Missouri | 0.4 | 0.7 | 1.2 | 1.9 | 3.9 | 2.5 |
| Montana | 0.9 | 0.8 | 2.2 | 3.5 | 5.0 | 2.3 |
| Nebraska | 0.4 | 1.2 | 1.4 | 1.9 | 3.8 | 2.1 |
| Nevada | 0.6 | 0.5 | 0.9 | 1.5 | 3.5 | 2.5 |
| New Hampshire | 1.0 | 1.9 | 1.9 | 3.2 | 7.4 | 2.1 |
| New Jersey | 0.8 | 1.3 | 1.5 | 2.4 | 5.3 | 1.9 |
| New Mexico | 0.5 | 0.9 | 1.4 | 2.0 | 6.2 | 3.6 |
| New York | 0.6 | 1.1 | 1.8 | 3.1 | 5.3 | 2.2 |
| North Carolina | 0.3 | 0.5 | 1.3 | 2.1 | 4.9 | 3.0 |
| North Dakota | 1.6 | 1.0 | 2.2 | 3.5 | 4.8 | 1.9 |
| Ohio | 0.6 | 0.9 | 1.6 | 3.0 | 6.1 | 2.5 |
| Oklahoma | 0.4 | 0.6 | 1.2 | 1.6 | 4.3 | 3.2 |
| Oregon | 0.9 | 1.6 | 1.6 | 2.6 | 6.3 | 2.4 |
| Pennsylvania | 0.6 | 1.1 | 1.6 | 3.1 | 5.8 | 2.2 |
| Rhode Island | 0.6 | 1.1 | 1.6 | 2.1 | 7.5 | 2.7 |
| South Carolina | 0.1 | 0.5 | 0.9 | 1.4 | 3.5 | 3.3 |
| South Dakota | 0.6 | 1.7 | 2.6 | 2.4 | 6.0 | 2.4 |
| Tennessee | 0.4 | 0.6 | 0.9 | 1.4 | 3.8 | 3.0 |
| Texas | 0.4 | 0.7 | 0.9 | 1.8 | 4.1 | 2.8 |
| Utah | 1.4 | 1.8 | 2.1 | 3.1 | 5.6 | 1.8 |
| Vermont | 1.8 | 1.6 | 2.9 | 4.7 | 6.4 | 1.8 |
| Virginia | 0.5 | 0.6 | 1.1 | 1.8 | 4.8 | 2.5 |
| Washington | 0.8 | 1.3 | 1.7 | 2.4 | 6.4 | 2.3 |
| West Virginia | 0.3 | 0.5 | 1.1 | 1.2 | 4.0 | 3.5 |
| Wisconsin | 0.7 | 1.5 | 2.4 | 3.2 | 7.1 | 2.2 |
| Wyoming | 1.4 | 0.7 | 1.5 | 2.4 | 4.3 | 2.1 |
| United States | 0.6 | 0.9 | 1.4 | 2.4 | 5.4 | 2.4 |
Appendix III: Methodology for State Gains From Eliminating Innovation’s Income Disparities
In their publicly available data, accessible at opportunityinsights.org, the Lost Einsteins researchers provide both overall state inventor rates and state inventor rates broken out by parental income quintile (bottom 20 percent vs. top 20 percent, for example). This allows us to examine the relationship between inventor rate and parental income in each state (see Appendix Table 2). Further, we can use this data to calculate the number of inventors that states would gain if all parental income quintiles had the same inventor rate as the top parental income quintile, that is, if states eliminated income disparities in innovation. We calculate this by dividing a state’s top quintile inventor rate by its overall inventor rate; from a practical perspective, this generates the same outcomes as would be achieved by assigning the inventor rate of children who grow up relatively affluent (top 20 percent) to what we describe in the report as “non-rich children,” or those raised in the bottom 80 percent.
For example, Alabama’s top quintile inventor rate is 2.8 per 1,000 children while its overall inventor rate is 0.8 per 1,000 children. Dividing 2.8 by 0.8, we see that Alabama would gain 3.5 times more inventors from eliminating income disparities in innovation. The Opportunity Insights data do not break out state inventor rates by race. However, given that income varies by race, gains from equalizing inventor rates across income are likely intertwined with gains from eliminating racial disparities; put another way, people of color would likely see a disproportionate gain if children from all income levels grew up to invent at the same level as those at the top.
It should also be noted that the Opportunity Insights data do provide state-specific disparities in invention rates by gender, which allows for estimates of how many additional inventors states could gain by eliminating the gender gap. However, combining the gains from eliminating disparities in both gender and income results in double counting because some portion of the gender gains are already included in the income gains. For this reason we have decided to limit our state-level analysis to parental income.
End Notes
[1] Alex Bell et al., “Who Becomes an Inventor in America? The Importance of Exposure to Innovation,” Opportunity Insights, revised November 2018, https://opportunityinsights.org/paper/losteinsteins/2018. Harvard economist Raj Chetty is among the authors in this and other Opportunity Insights research.
[2] The Lost Einsteins analysis includes estimates of invention levels by race, gender, and family income, though publicly available data do not allow replication of the combined racial, gender, and income calculation at the state level. Nonetheless, because people of color are overrepresented at lower levels of wealth and income, eliminating income disparities in innovation would inherently provide them disproportionate gains.
[3] For example, the creation of assembly line production cut the time to produce the Model T Ford by 68 percent over six years. More recently, information technology transformed the way companies produce and sell their goods and services, while tapping new markets and new business models. Michael Greenstone and Adam Looney, “A Dozen Economic Facts About Innovation,” Hamilton Project, August 5, 2011, https://www.hamiltonproject.org/papers/a_dozen_economic_facts_about_innovation.
[4] Audre Biciunaite, “Economic Growth and Life Expectancy — Do Wealthier Countries Live Longer?” Euromonitor International, March 14, 2014, https://blog.euromonitor.com/economic-growth-and-life-expectancy-do-wealthier-countries-live-longer/.
[5] Not all innovations are beneficial to human well-being, and even generally positive innovations can lead to substantial negative spillover effects, for example, advances in weaponry and chemical development, and the cotton gin which played a pivotal role in the United States’ westward expansion of slavery. Innovations such as fossil fuel extraction or tobacco cultivation may have bolstered economic growth but also caused critical harm to the environment and public health. Creative destruction is therefore a necessary but insufficient component of human progress — it must be accompanied by policies and value systems that enhance fairness, health, and overall well-being.
[6] See, for example, Charles I. Jones, “Sources of U.S. Economic Growth in a World of Ideas,” American Economic Review, Vol. 92, No. 1, 2002: 220-239; and Philippe Aghion and Peter Howitt, “A Model of Growth Through Creative Destruction,” Econometrica, Vol. 60, No. 2, 1992: 323-351.
[7] Both the Lost Einsteins work and some other research in the field characterizes “star inventors” as those in the top 5 percent of the distribution when it comes to patent citations. Citations are widely used as a measure of a patent’s scientific or economic impact, because they show the extent to which additional, later inventions in a field are building on that prior breakthrough.
[8] As the Opportunity Insights team describes, “Scientific progress is largely driven by a few star inventors who are highly compensated for their work by the market.” Their data indicate that only about 1 out of every 10,000 children grow up to reach the star inventor threshold, compared to 22 out of every 10,000 children who become inventors generally.
[9] Researchers often define “gazelle” firms as those that produce average annual job growth of at least 20 to 25 percent. Michael Mazerov and Michael Leachman, “State Job Creation Strategies Often Off Base,” Center on Budget and Policy Priorities, February 3, 2016, https://www.cbpp.org/research/state-budget-and-tax/state-job-creation-strategies-often-off-base.
[10] See, for example, Ryan A. Decker et al., “Where Has All The Skewness Gone? The Decline In High-Growth (Young) Firms In The U.S.,” NBER Working Paper No. 21776, January 2016, https://www.nber.org/papers/w21776; and Michael Mandel, “A Historical Perspective on Tech Job Growth,” Progressive Policy Institute, January 10, 2017, https://www.progressivepolicy.org/wp-content/uploads/2017/01/tech-job-boom-1-12c-17-formatted.pdf.
[11] Jonathan Rothwell et al., “Patenting Prosperity: Invention and Economic Performance in the United States and its Metropolitan Areas,” Brookings Institution, February 2013, https://www.brookings.edu/wp-content/uploads/2016/06/patenting-prosperity-rothwell.pdf.
[12] Ufuk Akcigit, John Grigsby, and Tom Nicholas, “The Rise of American Ingenuity: Innovation and Inventors of the Golden Age,” Harvard Business School Working Paper No. 17-063, 2017, https://www.hbs.edu/faculty/Pages/item.aspx?num=52130.
[13] The same analysis estimated that a low-patenting metro area could gain $4,300 more per worker over a decade if it became a high-patenting metro area. See Rothwell et al., pp. 17-19.
[14] See, for example, Mark Muro and Robert Maxim, “Big tech’s role in regional inequality,” Brookings Institution, October 9, 2018, https://www.brookings.edu/blog/the-avenue/2018/10/09/big-techs-role-in-regional-inequality/; and Jonathan Rothwell, “Regional Inequality and ‘The New Geography of Jobs,’” Brookings Institution, August 7, 2012, https://www.brookings.edu/blog/the-avenue/2012/08/07/regional-inequality-and-the-new-geography-of-jobs/.
[15] Atul Gawande, “Why Americans Are Dying from Despair,” New Yorker, March 16, 2020, https://www.newyorker.com/magazine/2020/03/23/why-americans-are-dying-from-despair.
[16] See, for example, Darrell M. West, “How the innovation economy leads to growth,” Brookings Institution, April 25, 2018, https://www.brookings.edu/testimonies/how-the-innovation-economy-leads-to-growth/; and Bruce Katz and Julie Wagner, “The Rise of Innovation Districts,” May 2014, Brookings Institution, https://www.brookings.edu/essay/rise-of-innovation-districts/.
[17] Nicholas Bloom, John Van Reenen, and Heidi Williams, “A Toolkit of Policies to Promote Innovation,” Journal of Economic Perspectives, Vol. 33, No. 3, 2019, pp. 163–184, https://pubs.aeaweb.org/doi/pdfplus/10.1257/jep.33.3.163.
[18] Lisa D. Cook, “Policies to Broaden Participation in the Innovation Process,” Hamilton Project, August 2020, https://www.brookings.edu/wp-content/uploads/2020/08/Cook_PP_LO_8.13.pdf.
[19] For a concise overview of how recent improvements in data and methods are allowing for a more sophisticated analysis of innovation, see pp. 4-6 of Alex Bell et al., “Do Tax Cuts Produce More Einsteins? The Impacts of Financial Incentives vs. Exposure to Innovation on the Supply of Inventors,” Opportunity Insights, January 2019, https://opportunityinsights.org/paper/do-tax-cuts-produce-more-einsteins-the-impacts-of-financial-incentives-vs-exposure-to-innovation-on-the-supply-of-inventors/.
[20] Bell et al., 2018. As noted, Chetty is among the authors in this and other Opportunity Insights research.
[21] For concise overviews of the Lost Einsteins study and its implications, see Matthew Yglesias, “Groundbreaking empirical research shows where innovation really comes from,” Vox, updated December 5, 2017, https://www.vox.com/2017/12/4/16706352/innovation-inequality-race-gender; and Alana Semuels, “America’s Lost Einsteins,” Atlantic, December 4, 2017, https://www.theatlantic.com/business/archive/2017/12/innovation-income-chetty/547202/.
[22] See, for example, Gerald Carlino and William R. Kerr, “Agglomeration and Innovation,” NBER Working Paper No. 20367, 2014, https://www.nber.org/papers/w20367.pdf; and Aaron Chatterji, Edward L. Glaeser, and William R. Kerr, “Clusters of Entrepreneurship and Innovation,” NBER Working Paper No. 19013, 2013, https://www.nber.org/papers/w19013.
[23] Akcigit, Grigsby, and Nicholas, pp. 10-13.
[24] In 1975 almost half of all counties had no patent activity at all, and today patenting is highly concentrated in metropolitan areas and near research universities. Ryan Nunn, Jana Parsons, and Jay Shambaugh, “The Geography of Prosperity,” Brookings Institution, 2018, https://www.brookings.edu/wp-content/uploads/2018/09/PBP_FramingChapter_compressed_0928.pdf.
[25] Rothwell et al., 2013.
[26] Ibid. Another 25 percent of metro area patents during that span were in an area with at least one science program (not top-ranked), while just 14 percent came from metro areas with zero doctoral programs in science — a group that contains 27 percent of the metropolitan population.
[27] Kristy Buzard and Gerald A. Carlino, “The Geography of Research and Development Activity in the U.S.,” FRB of Philadelphia Working Paper No. 09-16, August 12, 2009, https://papers.ssrn.com/sol3/papers.cfm?abstract_id=1448025.
[28] An estimated 59 percent of inventors between 1880 and 1940 were interstate migrants, according to one study, compared to 43 percent of the total population. States most likely to receive new inventors were those with higher levels of population density or a well-established financial sector, such as California and New York. Akcigit, Grigsby, and Nicholas, p. 9.
[29] As one study focused on research and development dollars describes, “A high geographic concentration of R&D labs creates an environment in which ideas move quickly from person to person and from lab to lab. Locations that are dense in R&D activity encourage knowledge spillovers, thus facilitating the exchange of ideas that underlies the creation of new goods and new ways of producing existing goods” (emphasis added). Buzard and Carlino.
Another study focused on African American inventors highlights the importance of social capital in fostering innovation, namely that inventors tend to be most prolific in settings where they can develop social ties to fellow inventors and readily share ideas through venues such as civic organizations or professional networks. Lisa D. Cook, “Inventing Social Capital: Evidence From African American Inventors, 1843-1930,” Michigan State University, May 2011, https://msu.edu/~lisacook/pats_great_paper_0511_final.pdf.
[30] Endeavor Insight, “What Do the Best Entrepreneurs Want in a City? Lessons from the Founders of America’s Fastest Growing Companies,” February 2014, p. 6, https://issuu.com/endeavorglobal1/docs/what_do_the_best_entrepreneurs_want.
[31] CBPP analysis of data from Opportunity Insights, available at https://opportunityinsights.org/data/?geographic_level=0&topic=0&paper_id=520#resource-listing.
[32] As the authors describe it, “Low-income children start out on relatively even footing with their higher-income peers in terms of innovation ability, but fall behind over time, perhaps because of differences in their childhood environment.” This finding is mirrored by prior research in the field indicating that low-income children struggle to reach their full economic potential due to systemic barriers, even when they stand out as high achievers in school or early in their careers.
[33] One widely cited 2017 study of patenting and family income in Finland found that people with fathers at the very top of the income distribution were about ten times likelier to become inventors than people with fathers from the bottom of the income distribution, but that this effect fell by about two-thirds once controlling for IQ and parents’ educational level. The authors contend that a large portion of the observed income effect may be explained by an indirect benefit of additional education, in that more educated people also tend to have higher incomes as adults. Philippe Aghion et al., “The Social Origins of Inventors,” NBER Working Paper No. 24110, December 2017, https://www.nber.org/papers/w24110.
Also, a 2015 study looking at U.S. census data back to 1930 found that people from richer backgrounds are more likely to become inventors, whereas those from simply more educated backgrounds are not. Murat Alp Celik, “Does the Cream Always Rise to the Top? The Misallocation of Talent in Innovation,” University of Pennsylvania, August 2015, https://economics.sas.upenn.edu/sites/default/files/filevault/event_papers/Celik_JMP.pdf
[34] Akcigit, Grigsby, and Nicholas, p. 9. It is worth noting that analyses of historical patent data are limited by the fact that not all inventions reach the final stage of filing a formal patent, due to factors including explicit racial or gender discrimination and lack of resources. For example, one study details the struggles that African Americans faced in accessing the formal patent system, especially when living in places marked by high levels of legal segregation, and describes evidence that some Black inventors sought to disguise their racial identity in order to see their ideas come to fruition or avoid negative repercussions. See Cook, 2011.
[35] B. Zorina Khan and Kenneth L. Sokoloff, “Institutions and Democratic Invention in 19th-Century America: Evidence from ‘Great Inventors,’ 1790-1930,” American Economic Review, Vol. 94, No. 2, May 2014. As cited in Akcigit, Grigsby, and Nicholas.
[36] A new study posits that much of the racial disparity was driven by oppressive institutions in the South, and that Black Americans living outside that region invented nearly as frequently as white Americans, relative to their share of the population. Jonathan Rothwell, Andre M. Perry, and Mike Andrews, “The Black innovators who elevated the United States: Reassessing the Golden Age of Invention,” Brookings Institution, November 23, 2020, https://www.brookings.edu/research/the-black-innovators-who-elevated-the-united-states-reassessing-the-golden-age-of-invention/?.
[37] See, for example, Susan Dominus, “Women Scientists Were Written Out of History. It’s Margaret Rossiter’s Lifelong Mission to Fix That,” Smithsonian Magazine, October 2019, https://www.smithsonianmag.com/science-nature/unheralded-women-scientists-finally-getting-their-due-180973082/.
[38] Although Asian American children grow up to invent at significantly higher rates than all other racial and ethnic groups in the Einsteins study, national research consistently points to sizable disparities within this racial category, which aggregate estimates often mask. For example, a 2016 analysis from the Washington Center for Equitable Growth notes that while 51 percent of Asian Americans and Pacific Islanders had a bachelor’s degree or higher at the time — an average share well above white Americans — that fact hid sizable differences among various subgroups. For example, rates ranged from highs of about 75 percent for Taiwanese and 73 percent for Indians to lows below 20 percent for groups such as Cambodians, Hmong, and Laotians. See “How data disaggregation matters for Asian Americans and Pacific Islanders,” Washington Center for Economic Growth, December 2016, https://equitablegrowth.org/how-data-disaggregation-matters-for-asian-americans-and-pacific-islanders/.
[39] Bell et al., 2018.
[40] The Lost Einsteins study includes estimates of potential inventor gains from eliminating disparities by race, gender, and family income. Due to various constraints of the publicly available data, we choose to only replicate the income piece of the calculation at the state level. Their analysis estimates that the national effect of equalizing invention rates for poor children, women, and people of color would be four times as many inventors. Our state-level analysis finds that achieving that end for non-rich children (regardless of race or gender) would boost the number of inventors by 2.4 times, so about 60 percent of the estimated nationwide increase.
[41] The extent to which diversifying the field of innovation would lead to more breakthroughs, and hence stronger economic growth, is a question of some debate. On one hand, attracting new entrants could expand the overall quantity of economic innovation, if new innovators bring new ideas and products that would have otherwise not been created. On the other hand, it is possible that innovation more closely resembles a zero-sum game, where additional innovation by people newly enticed into the field simply replaces innovation that would’ve already taken place, perhaps in another time or place. In that scenario, breaking down barriers for women, people of color, and low-income families would still have worthwhile benefits for economic equity, but wouldn’t necessarily enhance overall growth. Though even in this case, it would likely help a state or country grow more economically competitive relative to its rivals, both by tapping a broader pool of human talent and providing a more attractive locale for a diverse array of groups.
[42] As the Opportunity Insights team describes, “We caution … that this finding does not necessarily imply that aggregate welfare would be higher if these individuals were to enter innovation, as they might currently be pursuing other careers that also have substantial social returns.” Bell et al., 2018, p. 5.
[43] See Chang-Tai Hsieh et al., “The Allocation of Talent and U.S. Economic Growth,” University of Chicago, Becker Friedman Institute for Economics Working Paper No. 2019-93, June 18, 2019, pp. 29 and 33, https://bfi.uchicago.edu/working-paper/the-allocation-of-talent-and-u-s-economic-growth/.
[44] Jennifer Hunt et al., “Why Don’t Women Patent?” NBER Working Paper No. 17888, March 2012, https://www.nber.org/papers/w17888?ntw.
[45] Cook, 2020.
[46] See James Heckman, “Skill Formation and the Economics of Investing in Disadvantaged Children,” Science, June 2006, http://jenni.uchicago.edu/papers/Heckman_Science_v312_2006.pdf; and Timothy J. Bartik, “Investing in Kids: Early Childhood Programs and Local Economic Development,” W.E. Upjohn Institute, 2011, https://research.upjohn.org/up_press/207/ .
[47] Tomas Chamorro-Premuzic, “Does Diversity Actually Increase Creativity?” Harvard Business Review, June 28, 2017.
[48] Richard B. Freeman and Wei Huang, “Collaborating with People Like Me: Ethnic Coauthorship within the United States,” Journal of Labor Economics, July 2014, https://dash.harvard.edu/handle/1/20453995.
[49] “Interactions among inventors are strongly correlated with higher subsequent inventor productivity (i.e., inventor innovation quality), even after including several detailed controls, such as inventor fixed effects. Inventors learn from each other to produce better innovations.” And, “We find that interactions are crucial in explaining individual productivity and aggregate growth.” Ufuk Akcigit et al., “Dancing with the Stars: Innovation Through Interactions,” NBER Working Paper No. 24466, March 2018, https://www.nber.org/papers/w24466.
[50] Cristina Díaz-García, Angela González-Moreno, and Francisco Jose Sáez-Martínez, “Gender diversity within R&D teams: Its impact on radicalness of innovation,” Innovation, December 2014, https://www.tandfonline.com/doi/abs/10.5172/impp.2013.15.2.149.
[51] Jennifer Schmidt et al., “The Edge Effect,” NPR: Hidden Brain, July 2, 2018, https://www.npr.org/2018/07/02/625426015/the-edge-effect. These creative benefits are strongest in cases where people have a deep, ongoing relationship with those from other backgrounds, such as dating, working together in close proximity, or growing up in the same neighborhood, rather than just occasional contact. For further reading, see Jackson G. Lu et al., “‘Going Out’ of the Box: Close Intercultural Friendships and Romantic Relationships Spark Creativity, Workplace Innovation, and Entrepreneurship,” Journal of Applied Psychology, Vol. 102, No. 7, 2017, https://bit.ly/2J0cIZW.
[52] Richard Florida, “The Particular Creativity of Dense Urban Neighborhoods,” CityLab, November 2019, https://www.citylab.com/life/2019/11/neighborhood-population-density-cities-innovation-creativity/601258/.
[53] Case in point, an estimated 93 percent of the world’s recent patent applications were filed by inventors living in metropolitan areas with just 23 percent of the world’s population. Jonathan Rothwell, “Global Innovation: The Metropolitan Edition,” New Republic, March 16, 2012, https://newrepublic.com/article/101780/global-innovation-the-metropolitan-edition.
[54] Douglas Medin, Carol D. Lee, and Megan Bang, “Point of View Affects How Science Is Done,” Scientific American, October 1, 2014, https://www.scientificamerican.com/article/point-of-view-affects-how-science-is-done/.
[55] For example, a 2011 study found that among applicants to National Institutes of Health (NIH) project grants, only 1.5 percent self-identified as African American or Black and only 3.3 percent as Hispanic. Yet these groups are also significantly more likely than white Americans to report poor health outcomes, and infant mortality rates are more than twice as high for Black mothers (11.4 deaths per 1,000 births) than white mothers (4.9 deaths). National Institutes of Health, “NIH-commissioned study identifies gaps in NIH funding success rates for Black researchers,” August 18, 2011, https://www.nih.gov/news-events/news-releases/nih-commissioned-study-identifies-gaps-nih-funding-success-rates-black-researchers. For more on this topic, see Jennifer Sullivan, “Better State Budget, Policy Decisions Can Improve Health,” Center on Budget and Policy Priorities, February 21, 2019, https://www.cbpp.org/research/state-budget-and-tax/better-state-budget-policy-decisions-can-improve-health.
[56] Angela Glover Blackwell, “The Curb-Cut Effect,” Stanford Social Innovation Review, Winter 2017, https://ssir.org/articles/entry/the_curb_cut_effect.
[57] Caroline M. Hoxby and Christopher Avery, “The Missing ‘One-Offs’: The Hidden Supply of High-Achieving, Low Income Students,” NBER Working Paper No. 18586, December 2012, pp. 24-27, https://www.nber.org/papers/w18586.
[58] Exposure effects also vary by geography and type of invention; for instance, a child who grew up in Silicon Valley or whose parents or neighbors invented in computer programming is likely to become a tech-based inventor as well, rather than innovating in some other field. This helps explain why some areas of the country have carved out niches when it comes to innovation, as well as children’s likelihood to invent in specific fields, such as medical devices in Minneapolis or automobile advancements in Detroit.
[59] Hua-Yu Sebastian Cherng and Peter F. Halpin, “The Importance of Minority Teachers: Student Perceptions of Minority Versus White Teachers,” Educational Researcher, Vol. 45, No. 7, pp. 407–420, October 1, 2016, https://journals.sagepub.com/doi/full/10.3102/0013189X16671718. On teacher expectations, see Seth Gershenson, Stephen B. Holt, and Nicholas W. Papageorge, “Who Believes in Me? The Effect of Student-Teacher Demographic Match on Teacher Expectations,” Upjohn Institute Working Paper 15-231, 2015, https://research.upjohn.org/cgi/viewcontent.cgi?article=1248&context=up_workingpapers.
[60] Akcigit, Grigsby, and Nicholas.
[61] For a detailed analysis of how state tax and budget policies have contributed to structural racism, see Michael Leachman et al., “Advancing Racial Equity With State Tax Policy,” Center on Budget and Policy Priorities, November 15, 2018, https://www.cbpp.org/research/state-budget-and-tax/advancing-racial-equity-with-state-tax-policy.
[62] See, for example, Elizabeth Hinton, From the War on Poverty to the War on Crime, Harvard University Press, 2016; Michelle Alexander, The New Jim Crow: Mass Incarceration in the Age of Colorblindness, New Press, 2010; and Richard Rothstein, The Color of Law: A Forgotten History of How Our Government Segregated America, Liveright, 2017.
[63] Annie E. Casey Foundation, “Kids of Color More Likely to Live in High-Poverty Neighborhoods Now Than During Great Recession,” May 10, 2018, https://www.aecf.org/blog/kids-of-color-more-likely-to-live-in-high-poverty-neighborhoods-now/.
[64] K.A. Kilday, “How Does Toxic Stress Affect Low-Income and Black Children?” CityLab, May 8 2019, https://www.citylab.com/equity/2019/05/children-stress-neighborhoods-health-wellness-parent-study/589027/.
[65] Michael Mitchell et al., “State Higher Education Funding Cuts Have Pushed Costs to Students, Worsened Inequality,” Center on Budget and Policy Priorities, October 24, 2019, https://www.cbpp.org/research/state-budget-and-tax/state-higher-education-funding-cuts-have-pushed-costs-to-students.
[66] Akcigit, Grigsby, and Nicholas, p. 18. That analysis — which focused on historical innovation from 1880 to 1940 — found that people with a college degree were four times likelier to become an inventor than those with a high school diploma; an estimated 40 percent of inventors in 1940 had a college degree, versus only 10 percent of the non-inventor population.
[67] See, for example, Jonathan Rothwell, “Black Students at Top Colleges: Exceptions, Not the Rule,” Brookings Institution, February 3, 2015, https://www.brookings.edu/blog/social-mobility-memos/2015/02/03/black-students-at-top-colleges-exceptions-not-the-rule/.
[68] See United States v. Fordice, 505 U.S. 717, decided June 1992, and Debbie Elliott, “Integrating Ole Miss: A Transformative, Deadly Riot,” NPR, October 1, 2012, https://www.npr.org/2012/10/01/161573289/integrating-ole-miss-a-transformative-deadly-riot.
[69] See Jayne O’Donnell and David Robinson, “After decades of effort, African-American enrollment in medical school still lags,” USA Today, February 28, 2019, https://www.usatoday.com/story/news/health/2019/02/28/medical-school-student-african-american-enrollment-black-doctors-health-disparity/2841925002/; and Shankar Vedantam et al., “People Like Us: How Our Identities Shape Health And Educational Success,” NPR: Hidden Brain, June 3, 2019, https://www.npr.org/2019/06/03/729275139/people-like-us-how-our-identities-shape-health-and-educational-success.
[70] Amy Harmon, “For a Black Mathematician, What It’s Like to Be the ‘Only One,’” New York Times, February 18, 2019, https://www.nytimes.com/2019/02/18/us/edray-goins-black-mathematicians.html.
[71] fwd.us, “Estimates of Family Incarceration by Race and Ethnicity,” https://everysecond.fwd.us/chapter-3/#chapter3-5 (accessed July 2019).
[72] Erica Williams et al., “Inclusive Approach to Immigrants Who Are Undocumented Can Help Families and States Prosper,” Center on Budget and Policy Priorities, December 19, 2019, https://www.cbpp.org/research/state-budget-and-tax/inclusive-approach-to-immigrants-who-are-undocumented-can-help.
[73] Bill Hathaway, “Implicit bias may help explain high preschool expulsion rates for Black children,” Yale News, September 2016, https://news.yale.edu/2016/09/27/implicit-bias-may-explain-high-preschool-expulsion-rates-black-children.
[74] Shawn Fremstad and Melissa Boteach, “Valuing All Our Families,” Center for American Progress, January 2015, https://www.americanprogress.org/issues/poverty/reports/2015/01/12/104149/valuing-all-our-families/.
[75] Justin Wolfers, David Leonhardt, and Kevin Quealy, “1.5 Million Missing Black Men,” New York Times, April 20, 2015, https://www.nytimes.com/interactive/2015/04/20/upshot/missing-black-men.html.
[76] Tamara Gilkes Borr, “How the War on Drugs Kept Black Men Out of College,” Atlantic, May 15, 2019, https://www.theatlantic.com/education/archive/2019/05/war-drugs-made-it-harder-black-men-attend-college/588724/.
[77] Raj Chetty et al., “Race and Economic Opportunity in the United States: An Intergenerational Perspective,” NBER Working Paper No. 24441, revised June 2019, https://opportunityinsights.org/paper/race/. Less than 5 percent of Black children grow up in areas with a poverty rate below 10 percent and where more than half of fathers are present, compared to 63 percent of white children. To be clear, the study stresses that it’s the presence of fathers in a neighborhood as a whole, as opposed to in each individual home, that appears linked to a child’s likelihood of success. Rather than prescribing any particular family structure, this would seem to reinforce the importance of children having access to a diverse pool of adult role models — whether a parent, neighbor, or otherwise — with different lived experiences. As the authors put it, “The association with father presence is driven by a characteristic of the neighborhood in which the child grows up, not simply a direct effect of the marital status of one’s own parents.”
[78] Sarada Sarada, Michael J. Andrews, and Nicolas L. Ziebarth, “Changes in the demographics of American inventors, 1870-1940,” Explorations in Economic History, October 2019, https://www.sciencedirect.com/science/article/abs/pii/S0014498318301888; and Bell et al., 2018.
[79] Table S3-12, Employed Scientists and Engineers, by sex and occupation: 2017, “The State of U.S. Science and Engineering 2020,” National Science Board, https://ncses.nsf.gov/pubs/nsb20198/data.
[80] NASA Office of Diversity and Equal Opportunity, “NASA Equal Employment Opportunity Strategic Plan: FY 2017-19: FY 2017 Annual Report and Update,” October 2018, https://www.nasa.gov/sites/default/files/atoms/files/fy_2018_nasa_md-715_report_508.pdf.
[81] Christianne Corbett and Catherine Hill, “Solving the Equation: The Variables for Women’s Success in Engineering and Computing,” American Association of University Women, 2015, https://www.aauw.org/app/uploads/2020/03/Solving-the-Equation-report-nsa.pdf.
[82] National Women’s History Alliance, “Timeline of Legal History of Women in the United States,” https://nationalwomenshistoryalliance.org/resources/womens-rights-movement/detailed-timeline/ (accessed July 2019).
[83] Nina Banks, “Black women’s labor market history reveals deep-seated race and gender discrimination,” Economic Policy Institute, February 19, 2019, https://www.epi.org/blog/black-womens-labor-market-history-reveals-deep-seated-race-and-gender-discrimination/.
[84] Today, 78 percent of Black moms with children are employed compared with an average of just 66 percent of white, Asian American, and Latinx moms. Yet, in 2017, the median annual earnings for Black women working full time year-round was just over $36,000 — an amount 21 percent lower than white women. Valerie Wilson, “10 years after the start of the Great Recession, Black and Asian households have yet to recover lost income,” Economic Policy Institute, September 12, 2018, https://www.epi.org/blog/10-years-after-the-start-of-the-great-recession-black-and-asian-households-have-yet-to-recover-lost-income/.
[85] Catherine Hill, Christianne Corbett, and Andresse St. Rose, “Why So Few? Women in Science, Technology, Engineering, and Mathematics,” American Association of University Women, February 2010, https://www.aauw.org/app/uploads/2020/03/why-so-few-research.pdf.
[86] Association of American Medical Colleges, “Medical Students, Selected Years, 1965–2015,” https://www.aamc.org/download/481178/data/2015table1.pdf (accessed June 2019).
[87] Ernesto Reuben, Paola Sapienza, and Luigi Zingales, “How stereotypes impair women’s careers in science,” Proceedings of the National Academy of Sciences, Vol. 111, No. 12: 4403–08 (2014a).
[88] Recent research of standardized test scores for third- and eighth-graders in nearly every district in the country suggests that local norms may also play some role in disparities by gender. Specifically, while young girls perform better than boys on English tests regardless of their parents’ socioeconomic status, they tend to underperform boys in math but only in affluent communities. There is nearly no gender gap in math on average. Girls perform slightly better than boys in about a quarter of districts, particularly those that are predominantly African American and low income. Boys do slightly better in the rest, and much better in high-income and mostly white or Asian American districts. Claire Cain Miller and Kevin Quealy, “Where Boys Outperform Girls in Math: Rich, White and Suburban Districts,” New York Times, June 2018, https://www.nytimes.com/interactive/2018/06/13/upshot/boys-girls-math-reading-tests.html.
[89] Joseph Cimpian, “How our education system undermines gender equity,” Brookings Institution, April 23, 2018, https://www.brookings.edu/blog/brown-center-chalkboard/2018/04/23/how-our-education-system-undermines-gender-equity/, and Joseph P. Robinson-Cimpian, Sarah Theule Lubienski, and Colleen M. Ganley, “Teachers’ Perception of Students’ Mathematics Proficiency May Exacerbate Early Gender Gaps in Achievement,” Developmental Psychology, Vol. 50, No. 4, 1262-1281, https://pdfs.semanticscholar.org/0709/f13ba582e510689449b942610a5218761461.pdf.
[90] Janelle Gaines, “Women in Male-Dominated Careers,” Cornell HR Review, May 3, 2017, https://digitalcommons.ilr.cornell.edu/cgi/viewcontent.cgi?article=1099&context=chrr.
[91] Cimpian.
[92] The only low-innovation state today that does not meet this definition is West Virginia, which while technically part of slaveholding Virginia at the start of the Civil War, had negligible levels of slavery within its own territory.
[93] For one example, see Avidit Acharya, Matthew Blackwell, and Maya Sen, “The Political Legacy of American Slavery,” Journal of Politics, Vol. 78, No. 3, May 2016, https://scholar.harvard.edu/files/msen/files/slavery.pdf.
[94] Akcigit, Grigsby, and Nicholas.
[95] See, for example, Alana Semuels “Why It’s So Hard to Get Ahead in the South,” Atlantic, April 4, 2017, https://www.theatlantic.com/business/archive/2017/04/south-mobility-charlotte/521763/; and Gareth Cook, “The Economist Who Would Fix the American Dream,” Atlantic, August 2019, https://www.theatlantic.com/magazine/archive/2019/08/raj-chettys-american-dream/592804/.
[96] As the author notes, “More segregation corresponds to lower assigned-patent activity, whether considering total assigned patents or shares. Multiracial social networks, among other networks, became illegal, precarious, or infeasible. Increasing segregation, as measured by cumulative segregation laws, made some social networks illegal and others more precarious, which also erode previously integrated economic relations.” Cook, 2011, p. 19.
[97] See Rothwell, Perry, and Andrews.
[98] Nikole Hannah-Jones, “It Was Never About Busing,” New York Times, July 12, 2019, https://www.nytimes.com/2019/07/12/opinion/sunday/it-was-never-about-busing.html.
[99] Research Triangle Park, “The Transformative Impact of The Research Triangle Park — A Case Study,” February 15, 2018, https://www.rtp.org/transformative-impact-research-triangle-park-case-study/.
[100] Brian Lyman, “A permanent wound: How the slave tax warped Alabama finances,” Montgomery Advertiser, February 4, 2017, https://www.montgomeryadvertiser.com/story/news/politics/southunionstreet/2017/02/05/permanent-wound-how-slave-tax-warped-alabama-finances/97447706/.
[101] For more on this subject, see Trevor D. Logan, “Whitelashing: Black Politicians, Taxes, and Violence,” NBER Working Paper No. 26014, June 2019, https://www.nber.org/papers/w26014; and Pavithra Suryanarayan and Steven White, “Slavery, Reconstruction, and Bureaucratic Capacity in the American South,” January 26, 2019, https://papers.ssrn.com/sol3/papers.cfm?abstract_id=2951964.
[102] The chart shows state and local tax revenue per capita from 1977 to 2016, adjusted for inflation. Each line is a population average, meaning that it represents the average tax revenue raised for a resident of a given region. This same regional trend in state and local tax revenue also appears in other metrics, including revenue as a share of GDP (1997-2016) and revenue as a share of personal income (1977-2016).
[103] See, for example, Daron Acemoglu, Ufuk Akcigit, and Murat Alp Celik, “Young, Restless and Creative: Openness to Disruption and Creative Innovations,” NBER Working Paper No. 19894, revised August 2015, https://www.nber.org/papers/w19894; and Richard Florida, “The Economic Geography of Talent,” Annals of Association of American Geographers, Vol. 92, No. 4, 2002, http://creativeclass.com/rfcgdb/articles/5%20The_Economic_Geography_of_Talent.pdf.
[104] Natalia Nollenberger, Núria Rodríguez-Planas, and Almudena Sevilla, “The Math Gender Gap: The Role of Culture,” American Economic Review, Vol. 106, No. 5, pp. 257-261, May 2016, https://ideas.repec.org/a/aea/aecrev/v106y2016i5p257-61.html.
[105] Devin G. Pope and Justin R. Sydnor, “Geographic Variation in the Gender Differences in Test Scores,” Journal of Economic Perspectives, Vol. 24, No. 2: 95-108, Spring 2010, https://www.aeaweb.org/articles?id=10.1257/jep.24.2.95.
[106] As Chetty notes in an interview, “For whites, there are much lower rates of upward mobility throughout the South than you see in the rest of the country.” Ezra Klein, “You have a better chance of achieving ‘the American dream’ in Canada than in America,” Vox, August 15, 2019, https://www.vox.com/2019/8/15/20801907/raj-chetty-ezra-klein-social-mobility-opportunity.
[107] Edward J. Smith and Shaun R. Harper, “Disproportionate impact of K-12 school suspension and expulsion on Black students in southern states,” University of Pennsylvania, Center for the Study of Race and Equity in Education, 2015, https://web-app.usc.edu/web/rossier/publications/231/Smith%20and%20Harper%20(2015)-573.pdf.
[108] CBPP analysis of Bureau of Justice Statistics data.
[109] Thomas Breda et al., “Can female role models reduce the gender gap in science? Evidence from classroom interventions in French high schools,” PSE Working Papers halshs-01713068, HAL, 2018, https://ideas.repec.org/p/hal/psewpa/halshs-01713068.html.
[110] Charles M. Becker et al., “Can a summer make a difference? The impact of the American Economic Association Summer Program on minority student outcomes,” Economics of Education Review Vol. 53, pp: 46–71, 2016, https://www.sciencedirect.com/science/article/abs/pii/S0272775715300819.
[111] Andy Reed, “Evolving tax incentives: A shared value approach to economic development in Portland,” Brookings Institution, May 29, 2018, https://www.brookings.edu/blog/the-avenue/2018/05/29/evolving-tax-incentives-a-shared-value-approach-to-economic-development-in-portland/.
[112] Noah Smith, “America Lets Too Much Young Talent Go to Waste,” Bloomberg, February 6, 2019, https://www.bloomberg.com/opinion/articles/2019-02-06/america-neglects-talent-of-too-many-of-its-best-and-brightest.
[113] Michael Leachman and Eric Figueroa, “K-12 School Funding Up in Most 2018 Teacher-Protest States, But Still Well Below Decade Ago,” Center on Budget and Policy Priorities, March 6, 2019, https://www.cbpp.org/research/state-budget-and-tax/k-12-school-funding-up-in-most-2018-teacher-protest-states-but-still.
[114] Louisa Diffey, “50-State Comparison: State Kindergarten-Through-Third-Grade Policies,” Education Commission of the States, June 2018, https://www.ecs.org/kindergarten-policies/.
[115] As of 2017, the share of 4-year-olds served ranges from over 75 percent in Oklahoma to just 10 percent in Arizona, and enrollment rates are far lower among 3-year-olds, even in the best-practice states.
[116] In other words, low-income children fall behind over the course of childhood and adolescence due to factors other than raw intelligence, such as neighborhood environment and education quality. Bell et al., 2018, p. 16.
[117] Jeff Guo, “These kids were geniuses — they were just too poor for anyone to discover them,” Washington Post, September 22, 2015, https://www.washingtonpost.com/news/wonk/wp/2015/09/22/these-kids-were-geniuses-they-were-just-too-poor-for-anyone-to-discover-them/?noredirect=on.
[118] Bruce D. Baker, “Does Money Matter in Education?” Second Edition, Albert Shanker Institute, April 2019, http://www.shankerinstitute.org/resource/does-money-matter-second-edition.
[119] More specifically, this nationwide study examined the relationship between school funding and student outcomes from the early 1970s to 2011 and found that low-income children whose school districts received a 10 percent increase in per-pupil spending before they began their 12 years of public school had 10 percent higher earnings (and 17 percent higher family income) in adulthood, were likelier to complete high school, and were less likely as adults to be poor. C. Kirabo Jackson, Rucker C. Johnson, and Claudia Persico, “The Effects of School Spending on Educational and Economic Outcomes: Evidence from School Finance Reforms,” Quarterly Journal of Economics, Vol. 131, Issue 1, February 1, 2016, https://academic.oup.com/qje/article-abstract/131/1/157/2461148?redirectedFrom=fulltext.
[120] California’s ambitious funding reform was paired with an influx of new revenues from a sizable tax increase, and appears to already be paying dividends for students and communities, in particular those of color. The formula appears to be producing substantial gains in educational outcomes for low-income students and students of color, which could have been greater if all districts had targeted all funding as intended to primarily benefit these populations. Learning Policy Institute, “California’s Local Control Funding Formula Is Increasing Student Achievement and Graduation Rates,” February 2, 2018, https://learningpolicyinstitute.org/press-release/californias-local-control-funding-formula-increasing-student-achievement. See also Julia E. Koppich and Daniel C. Humphrey, “The Local Control Funding Formula (LCCF): What Have We Learned After Four Years of Implementation?” Getting Down to Facts II, September 2018, https://gettingdowntofacts.com/sites/default/files/2018-09/GDTFII_Report_Koppich-Humphrey.pdf.
[121] Institute on Taxation and Economic Policy, “State Tax Codes as Poverty Fighting Tools: 2018 Update on Four Key Policies in All 50 States,” September 2018, https://itep.org/state-tax-codes-as-poverty-fighting-tools-2018/.
[122] Sullivan.
[123] See Gareth Olds, “Food Stamp Entrepreneurs,” Harvard Business School Working Paper No. 16-143, June 2016, https://www.hbs.edu/faculty/Pages/item.aspx?num=50692; and Robert Fairlie et al., “Is Employer-Based Health Insurance a Barrier to Entrepreneurship?” American Society of Health Economists, June 2010, https://ssrn.com/abstract=1880523.
[124] Jun Koo, Young Jun Choi, and Iljoo Park, “Innovation and welfare: the marriage of an unlikely couple,” Policy and Society, August 2019, https://www.tandfonline.com/doi/full/10.1080/14494035.2019.1641380.
[125] Michael Mitchell et al., “Unkept Promises: State Cuts to Higher Education Threaten Access and Equity,” Center on Budget and Policy Priorities, October 4, 2018, https://www.cbpp.org/research/state-budget-and-tax/unkept-promises-state-cuts-to-higher-education-threaten-access-and.
[126] Otto Toivanen and Lotta Väänänen, “Education and Invention,” Center for Economic Policy Research, Discussion Paper No. 8537 (2011), http://aalto-econ.fi/toivanen/Toivanen_Vaananen_REStat16.pdf.
[127] The Lost Einsteins study suggests that strengthening local networks of innovation could provide a powerful tool over time — moving a child from an area at the 25th percentile of exposure to inventors, such as New Orleans, to one at the 75th percentile, such as Austin, Texas, would increase the child’s chances of growing up to invent by as much as 50 percent.
[128] Andre M. Perry and Rodney Sampson, “STEM talent exists in the South, but investment is appallingly lacking,” Brookings Institution, July 16, 2019, https://www.brookings.edu/blog/the-avenue/2019/07/16/stem-talent-exists-in-the-south-but-investment-is-appallingly-lacking/. For one example of how strengthening HBCUs could help boost access to innovation, see Nikole Hannah-Jones, “A Prescription for More Black Doctors,” New York Times Magazine, September 9, 2015, https://www.nytimes.com/2015/09/13/magazine/a-prescription-for-more-black-doctors.html.
[129] Jonathan Gruber and Simon Johnson, “Policy Summary: Jump-Starting America,” 2019, https://www.jump-startingamerica.com/policy-summary.
[130] Hoxby and Avery.
[131] Scott Jaschik, “Attracting the Missing Students,” Inside Higher Ed, April 1, 2013, https://www.insidehighered.com/news/2013/04/01/research-suggests-top-colleges-could-attract-many-more-high-achieving-low-income.
[132] That analysis found that people with a father or mother with a STEM Ph.D. are more than six times as likely to invent as those whose father or mother has only a base education (which the authors define as up to nine years of schooling), and that having a parent with a STEM instead of a non-STEM Ph.D. increases the probability to invent by more than 50 percent. Aghion et al., p. 39.
[133] Erin Sparks and Mary Jo Waits, “Growing State Economies: Twelve Actions,” National Governors Association Center for Best Practices, July 2012, https://www.nga.org/wp-content/uploads/2018/07/11HEINEMAN12ACTIONS.pdf. Also, while a full exploration of the issue is beyond the scope of this report, it is well established that women and people of color with entrepreneurial or innovative ideas face barriers to accessing venture capital and small business loans relative to their white male counterparts. Increased attention to this disparity by both policymakers and private lenders could help bolster equitable access to innovation as well. See Ben Hecht, “Why Entrepreneurs of Color Are Struggling,” CityLab, April 23, 2018, https://www.citylab.com/equity/2018/04/closing-the-racial-startup-gap/557012/.
[134] An estimated 25 percent of incubator clients on average are women and people of color, according to one estimate. JPMorgan Chase & Co. and the Initiative for a Competitive Inner City, “Creating Inclusive High-Tech Incubators and Accelerators: Strategies to Increase Participation Rates of Women and Minority Entrepreneurs,” May 2016, http://icic.org/wp-content/uploads/2016/04/ICIC_JPMC_Incubators_updated_post.pdf.
[135] Ibid. For further reading on the St. Louis example, see Maria Altman, “Report highlights BioSTL as example for building on city’s strengths,” St. Louis Public Radio, June 27, 2017, https://news.stlpublicradio.org/post/report-highlights-biostl-example-building-city-s-strengths#stream/0. For more reading on additional models focused on enhancing access for women, see Elyse Shaw and Cynthia Hess, “Closing the Gender Gap in Patenting, Innovation, and Commercialization: Programs Promoting Equity and Inclusion,” Institute for Women’s Policy Research, July 2018, https://iwpr.org/wp-content/uploads/2020/10/C471_Programs-promoting-equity_7.24.18_Final.pdf.
[136] Katherine W. Phillips, “How Diversity Makes Us Smarter,” Scientific American, October 1, 2014, https://www.scientificamerican.com/article/how-diversity-makes-us-smarter/.
[137] Amy Stuart Wells, Lauren Fox, and Diana Cordova-Cobo, “How Racially Diverse Schools and Classrooms Can Benefit All Students,” Century Foundation, February 9, 2016, https://tcf.org/content/report/how-racially-diverse-schools-and-classrooms-can-benefit-all-students/?agreed=1&agreed=1. See also Century Foundation, “The Benefits of Socioeconomically and Racially Integrated Schools and Classrooms,” April 29, 2019, https://tcf.org/content/facts/the-benefits-of-socioeconomically-and-racially-integrated-schools-and-classrooms/.
[138] K.J.R. Phillips et al., “Integrated Schools, Integrated Futures? A Case Study of School Desegregation in Jefferson County, Kentucky,” in From the Courtroom to the Classroom: The Shifting Landscape of School Desegregation, C.E. Smrekar and E.B. Goldring eds., 2009, pp: 239-70.
[139] Rebekah Bastian, “How School Segregation Leads to Inequitable Career Opportunities: An Interview With Nikole Hannah-Jones,” Forbes, December 13, 2019, https://www.forbes.com/sites/rebekahbastian/2019/12/13/how-school-segregation-leads-to-inequitable-career-opportunities-an-interview-with-nikole-hannah-jones/#3088732b52db.
[140] Sean F. Reardon et al., “Is Separate Still Unequal? New Evidence on School Segregation and Racial Academic Achievement Gaps,” Stanford Center for Policy Analysis, 2019, https://cepa.stanford.edu/content/separate-still-unequal-new-evidence-school-segregation-and-racial-academic-achievement-gaps.
[141] Racism and discriminatory public policies have played a central role in the creation and persistence of neighborhoods of extreme poverty, which are home primarily to people of color, particularly African Americans. These factors also contributed to the creation and persistence of high-opportunity neighborhoods, which are home primarily to white people. See, for instance, Rothstein and Sharkey, 2013, op. cit. For this reason, it is important to recognize that many of the characteristics of extreme-poverty neighborhoods that harm children’s health and chances of success are entangled with the forces of racism.
[142] Nationwide, districts that serve the most students of color receive about $1,800, or 13 percent, less per student than districts serving the fewest students of color. Ivy Morgan and Ary Amerikaner, “Funding Gaps: An Analysis of School Funding Equity Across the U.S. and Within Each State, 2018,” Education Trust, February 2018, https://edtrust.org/wp-content/uploads/2014/09/FundingGapReport_2018_FINAL.pdf.
[143] While we have much to learn about which interventions are effective in transforming low-income areas at a substantial scale, researchers have identified some successful examples of such changes, as well as promising efforts to improve outcomes for families in poor communities by targeting them with intensive services and supports for families. See, for example, Margery Austin Turner et al., “Opportunity Neighborhoods: Building the Foundation for Economic Mobility in America’s Metros,” US Partnership on Mobility From Poverty, February 2018, https://www.mobilitypartnership.org/opportunity-neighborhoods.
[144] State incarceration rates have risen primarily because states are sending a much larger share of offenders to prison and keeping them there longer. Michael Mitchell and Michael Leachman, “Changing Priorities: State Criminal Justice Reforms and Investments in Education,” Center on Budget and Policy Priorities, October 28, 2014, https://www.cbpp.org/research/changing-priorities-state-criminal-justice-reforms-and-investments-in-education.
[145] Anne-Marie Slaughter, “Why Women Still Can’t Have It All,” Atlantic, August 2012, https://www.theatlantic.com/magazine/archive/2012/07/why-women-still-cant-have-it-all/309020/.
[146] Dhruv Khullar, “Being a Doctor Is Hard. It’s Harder for Women,” New York Times, December 7, 2017, https://www.nytimes.com/2017/12/07/upshot/being-a-doctor-is-hard-its-harder-for-women.html.
[147] Bell et al., 2019.
More from the Authors

Areas of Expertise