Medicaid Cuts in House ACA Repeal Bill Would Limit Availability of Home- and Community-Based Services
The House-passed bill to “repeal and replace” the Affordable Care Act (ACA), which the Senate is now considering, would make home- and community-based services (HCBS) that states fund through Medicaid especially vulnerable to deep cuts. Facing steep cuts in their overall federal Medicaid funding, states would likely curtail these services, which in 2013 allowed almost 3 million seniors and adults and children with disabilities to receive care at home instead of in a nursing home.[1] (See Appendix Table 1.)
All told, the House bill would radically restructure Medicaid’s federal financing and effectively end the ACA’s Medicaid expansion. The Congressional Budget Office analysis of an earlier version of the bill with virtually identical Medicaid provisions estimated it would reduce Medicaid enrollment by 14 million people by 2026 and cut federal Medicaid funding by $839 billion over ten years. The bill consequently would have a major impact on health care for the more-than-70 million people who rely on Medicaid.[2]
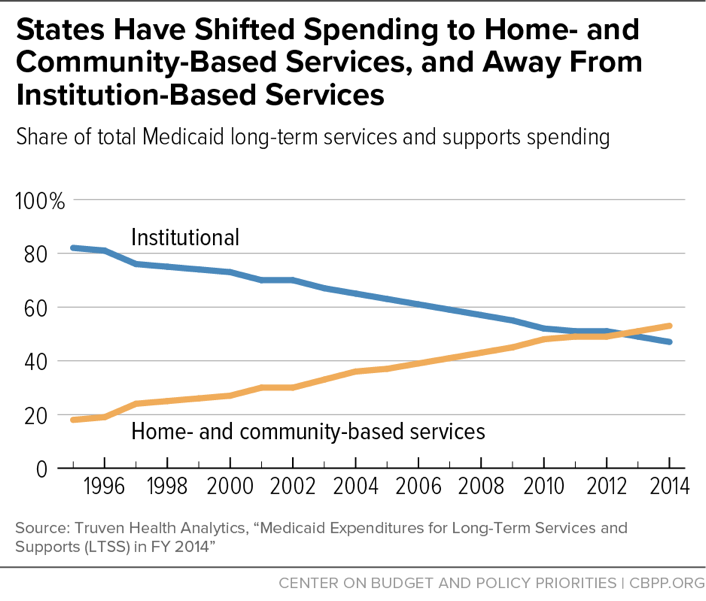
Federal HCBS waivers and other state options have given states new ways to address the needs of their residents, including seniors as well as both children and adults with serious disabilities. Progress by the states has been dramatic; the share of Medicaid expenditures for long-term services and supports that states allocate to HCBS has climbed from 18 percent in 1995 to 53 percent in 2014, with the number of people served with HCBS rising dramatically as well. States now spend more for HCBS than for nursing home care.
Capping and cutting federal funding would force many states to make excruciating decisions. The House bill — officially the American Health Care Act (AHCA) — would place a fixed cap on per-beneficiary federal Medicaid funding, cutting federal funding to the states by growing amounts over time. Capping and cutting federal funding would force many states to make excruciating decisions on whom they cover, the benefits they provide, and how much they pay providers, and likely would jeopardize coverage and care for vulnerable populations that Medicaid covers. Seniors, as well as children and adults with disabilities, who rely on Medicaid-funded services to avoid having to live in a nursing home or other institution — and those who will need such services in the future — would be among those hit hardest. The House bill’s cuts would likely prompt many states to roll back their progress in expanding access to care in the community and prevent them from making more progress in the future.
That’s because unlike most services in Medicaid, which states must cover, most HCBS are optional Medicaid benefits that states can cut when they face funding shortfalls.[3] (The services that states provide in their HCBS programs vary, but they generally provide home health services plus help with chores, meals, transportation, and other services such as adult day care and respite care for family caregivers.) Most states already limit HCBS due to funding constraints, and HCBS are a likely target if states must make substantial cuts due to federal funding shortfalls, because they spend more on optional HCBS than on any other optional benefit. The AHCA would therefore likely generate large increases in HCBS waiting lists. Some states could eliminate their HCBS programs altogether.
As the population ages, the need for HCBS will grow, as will the need for the direct care workers who deliver HCBS services, including nursing assistants, home health aides, and personal care aides. The direct care workforce is poorly paid, and it will be hard to meet the growing demand without improving their wages and training. The AHCA’s federal funding caps would leave states hard-pressed to meet the needs of a growing population in need of HCBS and other long-term services and supports.
House Bill’s Per Capita Cap Cuts Federal Medicaid Funding for All States
Medicaid is a federal-state partnership that provides affordable, high-quality health insurance to children, pregnant women, seniors and people with disabilities. Medicaid’s current financing structure in which the federal government matches state spending at a state-specific rate — now averaging 64 percent — allows spending to account for the variation in health care markets, residents’ needs, and state policy choices. It also allows states to respond to increases in health care costs that occur due to changing demographics, new ways of delivering care, new medical technology and prescription drugs, epidemics, public health emergencies, and environmental disasters.[4]
The AHCA would change Medicaid’s financing structure by capping federal funding on a per-beneficiary basis (a “per capita cap”).[5] The AHCA’s per capita cap on federal funding is intended to reduce federal Medicaid costs, by setting the cap for each state below the federal government’s projected Medicaid spending under current law and adjusting the cap by a rate below expected cost growth. Shortfalls in federal funds would grow over time as the rate of growth wouldn’t keep up with growth in health care costs.[6]
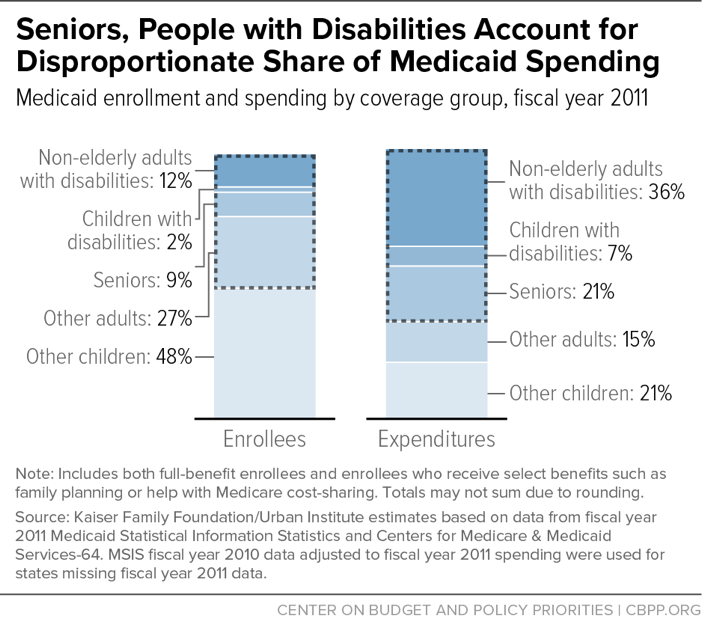
Medicaid is already highly efficient, covering people at lower costs than private insurance and with slower growth in per-beneficiary costs over time, which means that states wouldn’t be able to absorb a loss in federal funding without cutting eligibility, benefits, or provider payments.[7] No group covered by Medicaid would be immune to these cuts in coverage, especially seniors and people with disabilities, who accounted for over 60 percent of Medicaid spending in 2011.[8] (See Figure 1.)
How the House Repeal Bill’s Per Capita Cap Works
Under the House bill, each state’s overall federal funding for Medicaid would be capped beginning in 2020. The cap would be based on the number of beneficiaries in each of five groups — children, seniors, people with disabilities, adults covered under the ACA’s Medicaid expansion, and non-expansion adults, such as low-income parents and pregnant women — and per-beneficiary spending for each of those groups.[9] To determine the overall federal funding cap, the federal government would first calculate federal Medicaid spending per beneficiary in each state in 2016, projected forward based on the medical component of the Consumer Price Index (M-CPI), a slower rate than the rate of growth the Congressional Budget Office currently projects for Medicaid. Because the caps would be based on federal spending in the state in 2016, states effectively would be locked into a base of what they spent on care in 2016 and growth insufficient to meet beneficiaries’ needs over time.
Under the AHCA, in 2020, based on the above calculations, the federal government would then determine a per-beneficiary amount for each eligibility group for 2020. Next, each per-beneficiary cap would be multiplied by the number of beneficiaries in each eligibility group and together would equal the overall federal funding cap for the state. If a state spent more on one group in a year than that group’s allotment, it could stay within its capped federal funds if it spent less on other groups. In any year, if a state claimed more than its overall cap it would have to pay back the federal funds above the cap the following year.
Beginning with the calculation for 2020, the growth rate for the per-beneficiary caps for seniors and people with disabilities would change to M-CPI plus 1 percentage point. While the per capita cap growth rate for seniors and people with disabilities would be higher than the growth rate for children and adults starting in 2020, seniors and people with disabilities would still be subject to eligibility and benefit cuts. The overall inadequacy of the cap across all groups would lead to federal funding shortfalls, requiring states to cut across their entire Medicaid programs, regardless of how much each population’s per capita cap contributed to the total shortfall.
Per Capita Cap Would Jeopardize Long-Term Services and Supports for Seniors and People with Disabilities
The AHCA caps the federal funds available to states to operate their Medicaid programs, but it doesn’t change the mandatory benefits that Medicaid must provide for seniors and people with disabilities or that individual states must cover.[10] Care in a nursing home remains a mandatory benefit, and most HCBS, increasingly popular alternatives to institutional care, are still optional, which means states choose whether and to what extent to cover them. The amount states spend on care for seniors and people with disabilities varies considerably, which is reflected in differences in per-beneficiary spending across states. (See Appendix Table 2.)
Because the AHCA bases per-beneficiary caps for each group on what the state spent in 2016, it’s unlikely states would expand the availability of HCBS in the future, whether by increasing eligibility or the types of HCBS. Without cutting other services, states wouldn’t have room under the overall federal funding cap for new spending. The more likely scenario, if federal funding was capped and states had to cut their programs, is that they would roll back HCBS.[11] The risk of cuts to HCBS is especially great because states spend more on HCBS than any other optional benefit, and most states already limit HCBS due to constraints on available funding.
Medicaid Expansion Isn’t Squeezing Out Funding for HCBS
Opponents of the Medicaid expansion have repeatedly claimed falsely that it is squeezing out funding for other Medicaid beneficiaries and causing long waiting lists for HCBS, a claim the Washington Post’s fact checker gave “4 Pinocchios.”a And Department of Health and Human Services Secretary Tom Price has described the AHCA as an attempt “to improve the Medicaid system, make it more responsive to patients so that there are more resources to be able to be utilized for the disabled and the aged.”b The truth is there isn’t a connection between waiting lists for HCBS and Medicaid expansion. Nine of the 11 states without HCBS waiting lists are expansion states, and the two states with the biggest waiting lists (Texas and Florida) are non-expansion states.
As this paper shows, the real threat to HCBS is capping federal funds for Medicaid.
a Judith Solomon, “False Claims That the Medicaid Expansion Is Causing Waiting Lists,” Center on Budget and Policy Priorities, March 20, 2017, https://www.cbpp.org/blog/false-claims-that-the-medicaid-expansion-is-causing-waiting-lists. For more, see Michelle Ye He Lee, “Did the Obamacare Medicaid expansion force people onto wait lists?,” Washington Post, March 24, 2017, https://www.washingtonpost.com/news/fact-checker/wp/2017/03/24/did-the-obamacare-medicaid-expansion-force-people-onto-waitlists/?utm_term=.1014c08a6868.
b Mallory Shelbourne, “Price: Medicaid will be more ‘'responsive’' under GOP plan,” The Hill, May 7, 2017, http://thehill.com/homenews/sunday-talk-shows/332273-price-medicaid-will-be-more-responsive-under-gop-plan.
States Are Shifting Long-Term Services and Supports from Institutional Care to the Community
HCBS waivers became available in 1981 to provide states with a way to provide long-term services and supports (LTSS) outside of institutions. Skilled nursing care and home health services have always been mandatory services in Medicaid, but because many individuals need services beyond home health care to stay in their homes, Medicaid was biased toward institutional care.[12] HCBS waivers gave states new ways to address the LTSS needs of their residents, including seniors and children and adults with disabilities, which has led to a big shift in the program since 1981. Progress has been dramatic, with the share of LTSS spending on HCBS climbing from 18 percent in 1995 to 53 percent in 2014.[13] (See Figure 2.)
The services states provide in their HCBS programs vary, but they generally provide home health services plus help with chores, meals, transportation, and other services such as adult day care and respite care for family caregivers. Many states have multiple HCBS programs targeted to specific groups, and the package of services for each program is designed to ensure that members of the target population get the services they need to remain in their homes instead of having to be placed in a nursing home.
HCBS waivers also allow people who were previously only financially eligible if they were applying all their income to care in a nursing home or other institution to become eligible for Medicaid outside of the institution and receive the services they need to stay in their homes. States also provide HCBS to children with disabilities whose parents have incomes above Medicaid limits.
Under traditional Medicaid rules, parental income isn’t counted if children are placed in an institution, but it is counted when they live at home. In 1981, President Reagan addressed the harsh choice often faced by parents of children with special health care needs and created an option for states to allow children to get care at home through a waiver of Medicaid rules on counting parental income. In 1982, an option was added to the Medicaid statute, allowing states to provide HCBS to children without getting a waiver of federal rules. As of 2015, all states but one (Tennessee) used one of these eligibility pathways for children.[14] (See Appendix Table 3.)
The ACA enhanced state options for HCBS. The ACA significantly improved an option first added to the Medicaid statute in 2005 by allowing states to target services to particular populations and making other changes that help states address the needs of people with behavioral health conditions who aren’t eligible for HCBS waivers.[15] It also provided states higher matching funds as an incentive for states to implement the Community First Choice option, which provides eligible beneficiaries with comprehensive community-based services as an alternative to care in an institution. The AHCA would eliminate this incentive, putting the program in jeopardy in the eight states that have taken it up and making it less likely that other states will adopt it.[16]
HCBS Services at High Risk Under Republican Health Bill
Unlike nursing home care, which must be provided to all financially eligible beneficiaries who meet functional and medical criteria, states can control their expenditures for HCBS based on their fiscal and organizational capacity to support the services. States usually do this by limiting the number of slots available for people served by HCBS waivers and creating waiting lists, and they would likely further limit HCBS services under a per capita cap.
The largest share of state spending on optional Medicaid services by far goes for HCBS, new data from the Medicaid and CHIP Payment and Access Commission (MACPAC) show.[17] MACPAC sorted 2013 Medicaid spending and enrollment data into four categories — spending on mandatory services for mandatory enrollees, optional services for mandatory enrollees, mandatory services for optional enrollees, and optional services for optional enrollees — and also looked separately at mandatory and optional spending on long-term services and supports, which include both institutional care and HCBS. Overall, MACPAC found that about two-thirds of all Medicaid spending was for services provided to seniors and people with disabilities, and just over one-third of total Medicaid spending was on optional services, with the bulk of those services going to seniors and people with disabilities:
- Optional services represented close to half of spending for care provided to people with disabilities and seniors, while less than 1 percent was for children and 29 percent was for adults without disabilities.
- Of the total $146.5 billion in spending on optional services, $129 billion (88 percent) was for services provided to seniors and people with disabilities.
- Most spending on optional services for both seniors (64 percent) and people with disabilities (57 percent) was for LTSS, but the share of mandatory spending on LTSS was much lower (15 percent) for people with disabilities than seniors (72 percent), showing the greater reliance on home- and community-based services for people with disabilities and higher concentration of spending on nursing home care for seniors.
Because HCBS represent such a large share of state spending on optional services, which states can cut, AHCA would likely lead to big increases in HCBS waiting lists or the elimination of HCBS waivers altogether in many states as federal funding shortfalls grew.
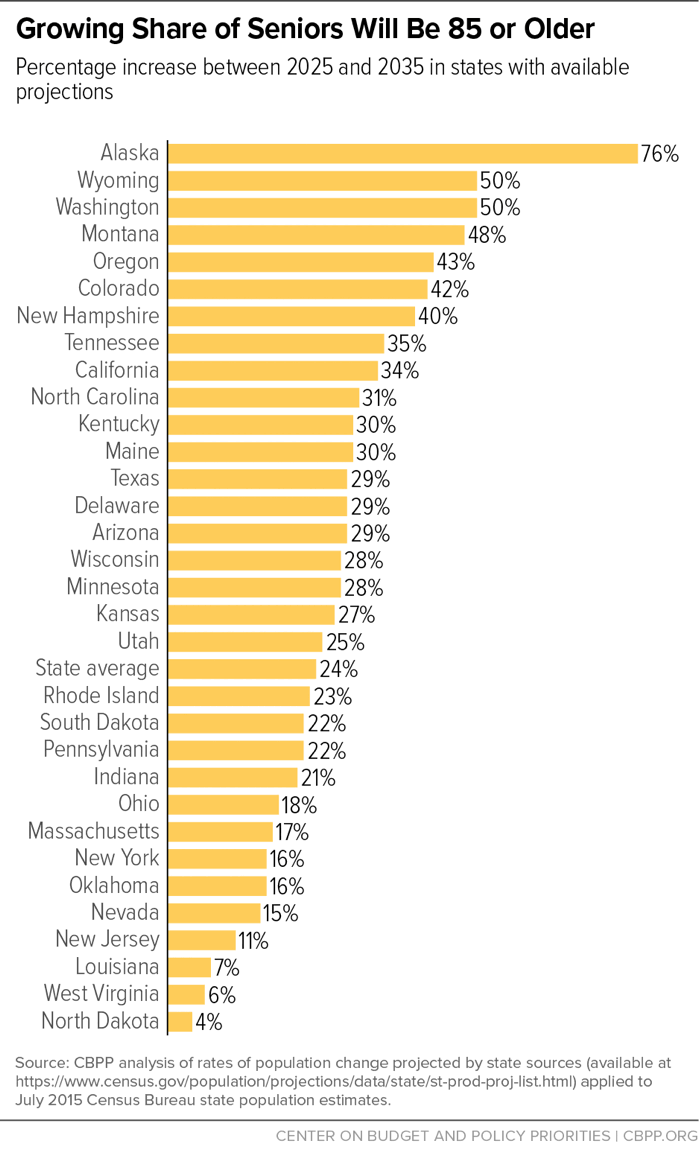
The aging of the population adds to those risks. Per beneficiary costs for seniors will increase as the baby boomers age and more seniors move from “young-old age” to “old-old age.” A look at 32 states with available estimates shows that all these states will experience a rise in the share of seniors who are 85 and older between 2025 and 2035, in most cases by at least 25 percent. (See Figure 3.) People in their 80s or 90s have more serious and chronic health problems and are likelier to require long-term services and supports. For example, seniors aged 85 and older incurred average Medicaid costs in 2011 that were more than 2.5 times higher than those aged 65 to 74. But under the AHCA, each state’s funding per senior beneficiary would be based on its spending per senior beneficiary in 2016, so federal funding wouldn’t adjust to reflect the rise in seniors’ per-beneficiary costs.[18] The resulting funding shortfall would further squeeze states’ capacity to keep up with the growing need for HCBS and other services.
States with lower per-beneficiary costs in 2016 would be even harder pressed to maintain their HCBS and meet future demands. An analysis of how states would have fared in 2011 had a cap like the AHCA’s been implemented in 2004 based on spending levels in 2000 showed that states with lower per-beneficiary spending in the base year experienced faster cost growth in subsequent years and were more likely to experience shortfalls in federal funding.[19]
Per Capita Cap Would Affect Direct Care Workforce Providing HCBS
The per capita cap would also likely make it harder to meet the growing need for direct care workers who deliver HCBS, including nursing assistants, home health aides, and personal care aides, making it hard for many families to find the care they need.[20] In 2014, there were 3.27 million direct care workers comprising 20.8 percent of the nation’s health workforce. The Bureau of Labor Statistics estimates an additional 1.1 million direct care workers will be needed by 2024 — a 26 percent increase over 2014.[21]
Direct care workers generally receive low wages, averaging between about $10 and $13 an hour in 2015.[22] A recent National Academy of Medicine report cited the need for adequate compensation and better training to address high turnover resulting from low pay and inadequate training.[23]
A per capita cap would exacerbate the shortage of direct care workers, which is already described as a crisis in some areas.[24] Medicaid pays for a large share of the care delivered by direct care workers so there is a direct link between state capacity to increase provider reimbursement and the direct care workforce’s salaries and working conditions. Improvements in wages for direct care workers would increase per-beneficiary costs, making it harder or even impossible for states to stay under their federal funding caps. As a result, capped federal funding would leave little room for home health providers to increase wages and other enhancements to attract and maintain a sufficient skilled workforce.
The AHCA’s effective elimination of the Medicaid expansion would also affect health care available to the direct care workforce. In addition to low pay, direct care workers often don’t have an offer of employer coverage. In 2010, 28 percent of direct care workers were uninsured, compared with 17 percent of all workers. By 2014 the shares fell to 21 percent and 16 percent, respectively, representing an increase of about 500,000 direct care workers with insurance. The coverage gains were due mostly to the Medicaid expansion.[25] The effective repeal of the Medicaid expansion would reverse this progress for direct care workers.
Conclusion
Faced with deep and growing cuts from a per capita cap, states would likely cut back HCBS to reduce Medicaid costs in the short run, even though doing so could ultimately lead more seniors and people with disabilities to be forced into nursing homes, worsening their quality of life and raising long-term state costs. Ohio Governor John Kasich pointed to HCBS as one way he has managed the growth in Medicaid costs in his state, which has a highly successful Medicaid expansion.[26] The growing use of HCBS and other innovations states have been adopting in their programs would be at risk if the AHCA’s per capita cap were enacted.[27]
| APPENDIX TABLE 1 | |
|---|---|
| Total Medicaid Home- and Community-Based Services Participants, by State | |
| State | 2013 |
| Total | 2,994,685 |
| Alaska | 9,291 |
| Alabama | 20,019 |
| Arkansas | 36,564 |
| Arizona | 40,364 |
| California | 440,841 |
| Colorado | 49,755 |
| Connecticut | 55,932 |
| District of Columbia | 12,432 |
| Delaware | 2,077 |
| Florida | 105,041 |
| Georgia | 56,694 |
| Hawaii | 4,691 |
| Iowa | 42,089 |
| Idaho | 18,435 |
| Illinois | 125,386 |
| Indiana | 44,313 |
| Kansas | 32,349 |
| Kentucky | 39,289 |
| Louisiana | 47,772 |
| Massachusetts | 76,751 |
| Maryland | 33,554 |
| Maine | 11,547 |
| Michigan | 102,810 |
| Minnesota | 103,268 |
| Missouri | 96,714 |
| Mississippi | 25,240 |
| Montana | 9,285 |
| North Carolina | 107,911 |
| North Dakota | 6,925 |
| Nebraska | 15,702 |
| New Hampshire | 11,692 |
| New Jersey | 65,022 |
| New Mexico | 26,642 |
| Nevada | 11,792 |
| New York | 281,283 |
| Ohio | 139,520 |
| Oklahoma | 35,306 |
| Oregon | 46,196 |
| Pennsylvania | 92,225 |
| Rhode Island | 1,350 |
| South Carolina | 25,360 |
| South Dakota | 7,394 |
| Tennessee | 19,009 |
| Texas | 196,974 |
| Utah | 11,947 |
| Virginia | 44,557 |
| Vermont | 5,564 |
| Washington | 82,712 |
| Wisconsin | 91,054 |
| West Virginia | 21,195 |
| Wyoming | 4,850 |
| APPENDIX TABLE 2 | |||
|---|---|---|---|
| State Variation in Medicaid Per Enrollee Spending for Seniors and People with Disabilities | |||
| Spending per enrollee, fiscal year 2011 | |||
| State | Children with Disabilities |
Non-Elderly Adults with Disabilities |
Seniors |
| Alabama | $11,020 | $9,903 | $18,473 |
| Alaska | $32,734 | $28,151 | $24,288 |
| Arizona | $32,303 | $19,300 | $16,145 |
| Arkansas | $14,317 | $13,894 | $20,484 |
| California | $24,909 | $19,268 | $12,019 |
| Colorado | $17,834 | $20,045 | $18,478 |
| Connecticut | $17,273 | $31,039 | $30,560 |
| Delaware | $20,091 | $24,136 | $27,666 |
| DC | $21,952 | $29,948 | $27,336 |
| Florida | $13,373 | $15,584 | $14,253 |
| Georgia | $7,829 | $11,475 | $14,142 |
| Hawaii | $21,472 | $16,574 | $18,439 |
| Idaho | $23,073 | $21,426 | $15,558 |
| Illinois | $12,534 | $16,941 | $11,431 |
| Indiana | $14,827 | $20,151 | $21,269 |
| Iowa | $21,263 | $20,036 | $21,163 |
| Kansas | $14,282 | $17,875 | $18,328 |
| Kentucky | $12,442 | $12,954 | $15,757 |
| Louisiana | $11,264 | $16,235 | $15,491 |
| Maine | $22,424 | $16,270 | $19,881 |
| Maryland | $20,678 | $24,415 | $23,491 |
| Massachusetts | $10,351 | $19,146 | $27,205 |
| Michigan | $16,994 | $14,784 | $17,599 |
| Minnesota | $25,425 | $27,159 | $25,030 |
| Mississippi | $11,963 | $13,260 | $18,592 |
| Missouri | $20,759 | $17,370 | $17,020 |
| Montana | $21,203 | $15,549 | $26,704 |
| Nebraska | $17,451 | $17,449 | $14,997 |
| Nevada | $12,391 | $16,762 | $13,226 |
| New Hampshire | $53,557 | $21,313 | $26,794 |
| New Jersey | $18,759 | $20,217 | $19,160 |
| New Mexico | $21,966 | $17,661 | N/A |
| New York | $20,082 | $37,132 | $28,336 |
| North Carolina | $17,971 | $14,403 | $10,518 |
| North Dakota | $18,360 | $29,813 | $31,155 |
| Ohio | $15,499 | $22,768 | $27,494 |
| Oklahoma | $14,460 | $15,117 | $12,315 |
| Oregon | $18,737 | $18,180 | $24,253 |
| Pennsylvania | $16,634 | $16,372 | $21,372 |
| Rhode Island | $30,043 | $19,588 | $16,998 |
| South Carolina | $13,366 | $12,707 | $12,256 |
| South Dakota | $16,689 | $19,816 | $16,374 |
| Tennessee | $6,945 | $16,044 | $15,745 |
| Texas | $18,261 | $17,503 | $14,739 |
| Utah | $21,683 | $19,391 | $11,763 |
| Vermont | $42,030 | $13,967 | $14,258 |
| Virginia | $15,418 | $19,681 | $16,367 |
| Washington | $17,152 | $16,072 | $16,183 |
| West Virginia | $14,045 | $12,867 | $23,243 |
| Wisconsin | $9,950 | $18,130 | $16,344 |
| Wyoming | $18,684 | $26,830 | $32,199 |
| United States | $16,758 | $18,912 | $17,522 |
| APPENDIX TABLE 3 | ||||||||
|---|---|---|---|---|---|---|---|---|
| State Variation in Medicaid Eligibility and Services for Seniors and People with Disabilities | ||||||||
| Optional Eligibility Pathways, 2015 | Optional HCBS | |||||||
| States | 100% FPL | Katie Beckett or equiv. waiver | Work Dis. Buy In | LTC Special Income Rule | Pers. Care Serv., 2013 | Sec. 1915 (i), 2015 | CFC, 2016 | |
| Alabama | X | X | ||||||
| Alaska | X | X | X | X | ||||
| Arizona | X | X | X | X | ||||
| Arkansas | X | X | X | X | X | |||
| California | X | X | X | X | X | X | ||
| Colorado | X | X | X | X | ||||
| Connecticut | X | X | X | X | X | |||
| Delaware | X | X | X | X | X | |||
| DC | X | X | X | X | X | X | ||
| Florida | X | X | X | X | X | |||
| Georgia | X | X | X | |||||
| Hawaii | X | X | ||||||
| Idaho | X | X | X | X | X | X | ||
| Illinois | X | X | X | |||||
| Indiana | X | X | X | X | X | |||
| Iowa | X | X | X | X | ||||
| Kansas | X | X | X | X | ||||
| Kentucky | X | X | X | |||||
| Louisiana | X | X | X | X | X | |||
| Maine | X | X | X | X | X | |||
| Maryland | X | X | X | X | X | X | ||
| Massachusetts | X | X | X | X | X | |||
| Michigan | X | X | X | X | X | X | ||
| Minnesota | X | X | X | X | X | |||
| Mississippi | X | X | X | X | ||||
| Missouri | X | X | X | |||||
| Montana | X | X | X | X | X | X | ||
| Nebraska | X | X | X | |||||
| Nevada | X | X | X | X | X | |||
| New Hampshire | X | X | X | X | X | |||
| New Jersey | X | X | X | X | X | |||
| New Mexico | X | X | X | X | ||||
| New York | X | X | X | X | X | |||
| North Carolina | X | X | X | X | ||||
| North Dakota | X | X | X | |||||
| Ohio | X | X | X | X | ||||
| Oklahoma | X | X | X | X | ||||
| Oregon | X | X | X | X | X | X | ||
| Pennsylvania | X | X | X | X | ||||
| Rhode Island | X | X | X | X | X | |||
| South Carolina | X | X | X | |||||
| South Dakota | X | X | X | X | ||||
| Tennessee | X | X | ||||||
| Texas | X | X | X | X | ||||
| Utah | X | X | X | X | X | |||
| Vermont | X | X | X | X | ||||
| Virginia | X | X | X | X | ||||
| Washington | X | X | X | X | X | |||
| West Virginia | X | X | X | X | ||||
| Wisconsin | X | X | X | X | X | |||
| Wyoming | X | X | X | |||||
| United States | 21 States | 50 States | 44 States | 44 States | 32 States | 17 States | 8 States | |
End Notes
[1] Terence Ng et al., “Medicaid Home and Community-Based Services Programs: 2013 Data Update,” The Kaiser Commission on Medicaid and the Uninsured, October 2016, http://kff.org/medicaid/report/medicaid-home-and-community-based-services-programs-2013-data-update/.
[2] For a summary of the Medicaid changes in the AHCA, see “House Health Care Bill Ends Medicaid as We Know It,” Center on Budget and Policy Priorities, May 9, 2017, https://www.cbpp.org/research/health/house-health-care-bill-ends-medicaid-as-we-know-it.
[3] Of the 3 million people receiving HCBS services in 2013, about 672,000 received mandatory home health benefits, 774,000 received personal care services (an optional HCBS benefit), and 1.55 million received services through an HCBS waiver. Ng et al., op cit.
[4] See, for example, Jocelyn Guyer and David Rosales, “Medicaid’s Role in Public Emergencies and Health Crises,” State Health Reform Assistance Network, April 2017, http://www.statenetwork.org/wp-content/uploads/2017/04/RWJF_Manatt_HealthCrisis_IssueBrief_Final.pdf.
[5] States would also have the option of converting Medicaid to a block grant for children, adults (other than seniors and people with disabilities), or both. Edwin Park, Judith Solomon, and Hannah Katch, “Updated House ACA Repeal Bill Deepens Damaging Medicaid Cuts for Low-Income Individuals and Families,” Center on Budget and Policy Priorities, March 21, 2017, https://www.cbpp.org/research/health/updated-house-aca-repeal-bill-deepens-damaging-medicaid-cuts-for-low-income.
[6] Edwin Park, “Medicaid Per Capita Cap Would Shift Costs and Risks to States and Harm Millions of Beneficiaries,” Center on Budget and Policy Priorities, February 27, 2017, https://www.cbpp.org/research/health/medicaid-per-capita-cap-would-shift-costs-and-risks-to-states-and-harm-millions-of.
[7] See Teresa A. Coughlin et al., “What Difference Does Medicaid Make? Assessing Cost Effectiveness, Access, and Financial Protection under Medicaid for Low-Income Adults,” Kaiser Family Foundation, May 2013, http://kff.org/medicaid/issue-brief/what-difference-does-medicaid-make-assessing-cost-effectiveness-access-and-financial-protection-under-medicaid-for-low-income-adults/; Edwin Park et al., “Frequently Asked Questions About Medicaid,” Center on Budget and Policy Priorities, updated January 21, 2016, https://www.cbpp.org/research/health/frequently-asked-questions-about-medicaid; Medicaid and CHIP Payment and Access Commission, “Report to Congress on Medicaid and CHIP,” June 2016, https://www.macpac.gov/wp-content/uploads/2016/06/Trends-in-Medicaid-Spending.pdf.
[8] MaryBeth Musumeci and Katherine Young, “State Variation in Medicaid Per Enrollee Spending for Seniors and People with Disabilities,” Kaiser Family Foundation, May 1, 2017, http://kff.org/medicaid/issue-brief/state-variation-in-medicaid-per-enrollee-spending-for-seniors-and-people-with-disabilities/. With coverage of adults under the expansion, the share of spending on seniors and people with disabilities is now closer to 50 percent.
[9] The following populations are excluded from the per capita cap model: qualified Medicare beneficiaries, beneficiaries receiving emergency Medicaid and family planning services, beneficiaries enrolled under the tuberculosis and breast and cervical cancer eligibility groups, beneficiaries enrolled in employer sponsored premium assistance, American Indians and Alaska Natives, and children enrolled in the Children’s Health Insurance Program.
[10] The block grant option for children and adults other than seniors and people with disabilities would allow states to stop providing benefits that are now mandatory, such as Medicaid’s comprehensive benefit for children known as EPSDT (Early and Periodic, Screening, Diagnostic and Treatment).
[11] See information on Medicaid.gov at https://www.medicaid.gov/medicaid/hcbs/.
[12] Home health services include nursing services, home health aide services, medical supplies, and equipment. 42 CFR §441.15.
[13] Terence Ng et al., “Medicaid Home and Community-Based Services Programs: 2013 Data Update,” The Kaiser Commission on Medicaid and the Uninsured, October 2016, http://kff.org/medicaid/report/medicaid-home-and-community-based-services-programs-2013-data-update/.
[14] Musemeci and Young.
[15] States can’t have waiting lists for HCBS services available under the state option, which has been taken up by 18 states.
[16] Jessica Schubel, “Little-Noticed Medicaid Changes in House Plan Would Worsen Coverage for Children, Seniors and People with Disabilities and Increase Uncompensated Care,” Center on Budget and Policy Priorities, March 15, 2017, https://www.cbpp.org/research/health/little-noticed-medicaid-changes-in-house-plan-would-worsen-coverage-for-children.
[17] Martha Heberlein, “Analysis of Mandatory and Optional Populations and Benefits,” Medicaid and CHIP Payment and Access Commission, April 21, 2017, https://www.macpac.gov/wp-content/uploads/2017/04/Review-of-June-Report-Chapter-Analysis-of-Mandatory-and-Optional-Populations-and-Benefits.pdf.
[18] Matt Broaddus, “Population’s Aging Would Deepen House Health Bill’s Medicaid Cuts for States,” Center on Budget and Policy Priorities, March 24, 2017, https://www.cbpp.org/blog/populations-aging-would-deepen-house-health-bills-medicaid-cuts-for-states.
[19] Loren Adler, Matthew Fiedler, and Tim Gronniger, “Effects of the Medicaid Per Capita Cap Included in the House-Passed American Health Care Act,” Brookings Institution, May 2017, https://www.brookings.edu/wp-content/uploads/2017/05/es_chp_medicaidpercapitacap_adlerfiedlergronniger_51017.pdf.
[20] Judith Graham, “A Shortage of Caregivers,” New York Times, February 26, 2014, https://newoldage.blogs.nytimes.com/2014/02/26/a-shortage-of-caregivers/.
[21] Judith Graham, “Severe Shortage of Direct Care Workers Triggering Crisis,” Kaiser Health News, May 9, 2017, https://www.disabilityscoop.com/2017/05/09/severe-shortage-care-crisis/23679/.
[22] Government Accountability Office, “Long-Term Care Workforce: Better Information Needed on Nursing Assistants, Home Health Aides, and Other Direct Care Workers, GAO-16-718, August 2016, http://www.gao.gov/assets/680/679100.pdf.
[23] John W. Rowe et al., “Preparing for Better Health and Health Care for an Aging Population,” National Academy of Medicine, September 19, 2016, https://nam.edu/wp-content/uploads/2016/09/Preparing-for-Better-Health-and-Health-Care-for-an-Aging-Population.pdf.
[24] Graham, Kaiser Health News.
[25] Stephen Campbell, “The Impact of the Affordable Care Act on Health Coverage for Direct Care Workers,” PHI, March 2017, https://phinational.org/research-reports/impact-affordable-care-act-health-coverage-direct-care-workers.
[26] CNN State of the Union interview, May 7, 2017.
[27] Judith Solomon, “Caps on Federal Medicaid Funding Would Give States Flexibility to Cut, Stymie Innovation, Center on Budget and Policy Priorities, January 18, 2017, https://www.cbpp.org/research/health/caps-on-federal-medicaid-funding-would-give-states-flexibility-to-cut-stymie
More from the Authors

Areas of Expertise