It Pays to Work: Work Incentives and the Safety Net
Some critics of various low-income assistance programs argue that the safety net discourages work. In particular, they contend that people receiving assistance from these programs can receive more, or nearly as much, from not working — and receiving government aid — than from working. Or they argue that low-paid workers have little incentive to work more hours or seek higher wages because losses in government aid will cancel out the earnings gains.
Adults in poverty are significantly better off if they get a job, work more hours, or receive a wage hike.Careful analysis of the data and research demonstrates, however, that such charges are largely incorrect and that it pays to work. In the overwhelming majority of cases, in fact, adults in poverty are significantly better off if they get a job, work more hours, or receive a wage hike. Various changes in the safety net over the past two decades have transformed it into more of what analysts call a “work-based safety net” and substantially increased incentives to work for people in poverty.
Indeed, evidence from a new Congressional Budget Office (CBO) study, as well as other data and research, show that:
-
Working is nearly always substantially better from a financial standpoint than not working. A critical question is whether the safety net is designed so it is worthwhile for someone who isn’t working to take a job. The answer is clear: the financial incentive to take a job is unmistakable.
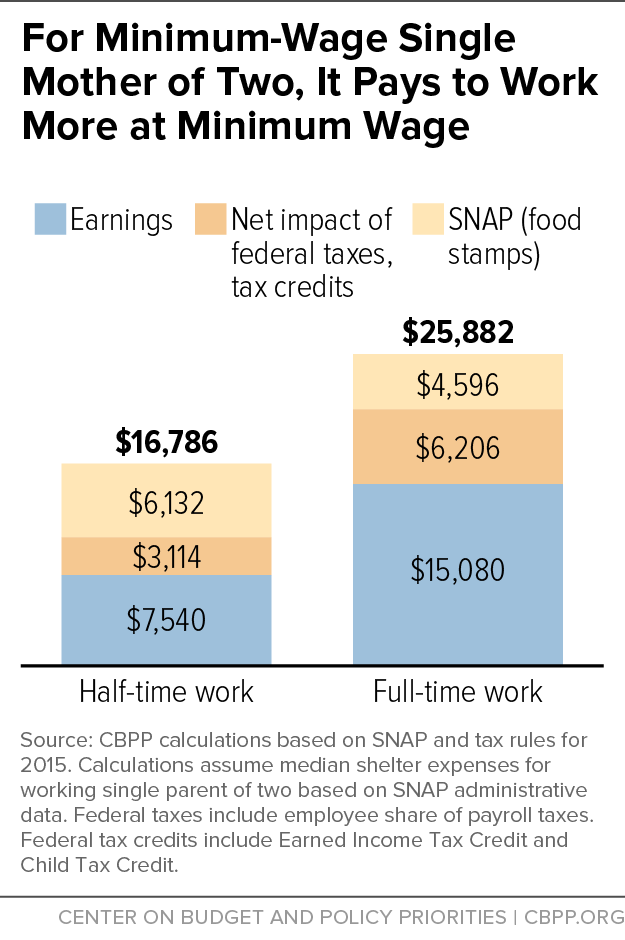
To illustrate, we first consider taxes that apply to all poor single-parent families that work, along with benefits that go to all such families that qualify for them. After taking into account state and federal taxes, including federal tax credits like the Earned Income Tax Credit (EITC) and Child Tax Credit (which grow for low earners as their earnings rise), plus SNAP food assistance, a hypothetical single mother with two children taking a half-time job at the federal minimum wage gains over $10,000 in net annual income compared to not working. Her family’s income more than doubles. If she takes a full-time job at the federal minimum wage, her family is nearly $20,000 better off than if she doesn’t work; her family’s net income quadruples.[2] Since the EITC and Child Tax Credit rise more for these families as earnings increase than their SNAP benefits decline, their assistance from government policies rises as they work more. The safety net as a whole thus increases their incentive to work.
We also consider scenarios in which families receive Temporary Assistance for Needy Families (TANF) benefits or housing assistance, which are not available to most poor families that meet those programs’ eligibility criteria. Even in the relatively infrequent examples where poor families receive both TANF and housing assistance, which generally phase down as earnings rise, the families’ incomes typically are substantially higher off if they work than if they don’t.
- Workers in poverty typically have a greater incentive to work more hours or at higher wages than other workers do. Workers with earnings below the poverty line face “marginal tax rates” — i.e., the reduction in benefits or increase in taxes for each additional dollar earned — that are typically well below those that other workers face. The median or typical worker with earnings below half of the poverty line has a marginal tax rate of 14 percent, according to CBO’s recent analysis of marginal tax rates, meaning that he or she loses 14 cents in higher taxes and/or lower benefits for each additional dollar earned. Workers with earnings between 50 and 100 percent of the poverty line typically face marginal tax rates of 24 percent. In contrast, the groups of earners with somewhat higher incomes that CBO examined typically have marginal tax rates of about 33 or 34 percent.
- Workers just above the poverty line typically also gain substantially from working additional hours or obtaining higher wages. Workers with earnings between 100 and 150 percent of the poverty line typically face marginal tax rates of 34 percent, according to CBO, or less than half the 80 or 90 percent rates that some critics of low-income assistance programs incorrectly portray as the norm.
- Critics’ examples assume that workers receive an unusual combination of benefits that few low-income workers actually get. The often-cited examples are generally atypical worst-case scenarios that apply only to a small fraction of families with children — namely, families that: a) have income in certain fairly narrow ranges, typically just above the poverty line; and b) receive an unusual combination of government benefits, all or most of which phase down in the same income range. We estimate that only about 3 percent of single mothers with two children and earnings below 150 percent of the poverty line (below about $29,000) receive the EITC, SNAP, and either TANF or housing aid (or both) and are in the earnings range where these benefits all phase down simultaneously — and consequently face marginal tax rates above 80 percent. The proportion is even smaller for other family configurations.
These findings are consistent with two other important findings, which also rest on a growing body of academic studies and data analysis on work incentives and the safety net.
- Changes in the safety net over the past two decades have significantly increased work incentives for people in poverty. Over recent decades, cash benefits have generally shrunk for nonelderly, nondisabled people who are not working, while tax credits and health assistance have expanded for low-income people who are working. Policymakers have significantly expanded the EITC and created and expanded a low-income component of the Child Tax Credit, both of which are strictly limited to families with earnings. For most working-poor families, these credits either grow with each additional dollar earned — thereby lowering workers’ marginal tax rates and increasing incentives to work — or remain unchanged. Studies have repeatedly shown that the EITC has markedly increased the share of single mothers who work.
- The safety net as a whole has little effect on work effort by low-income workers. A comprehensive review of the research on the effects of different aspects of the safety net on work found that the behavioral response is small enough, in aggregate, that it has almost no impact on the substantial degree to which the safety net lifts people out of poverty.[3] A number of factors, beyond the fact that most poor workers face low marginal tax rates, may account for the small behavioral response. Many low-wage workers have limited flexibility to adjust their work schedules without threatening their job status. And workers likely conclude that working more hours or accepting a promotion will benefit their careers over the long term. Research also shows that many families don’t fully understand how benefits (particularly tax credits) adjust as earnings rise and don’t make the technical marginal-rate calculations that certain economic theories assume.
All this isn’t to suggest that policymakers should ignore circumstances in which marginal tax rates can be quite high. But it’s important to recognize that such circumstances are concentrated among a modest fraction of families with earnings just above the poverty line that receive benefits from a number of programs that phase down simultaneously and, just as importantly, that reducing such marginal rates involves very difficult tradeoffs.
There are really only two options to lowering marginal tax rates. One is to phase out benefits more slowly as earnings rise; this reduces marginal tax rates for those currently in the phase-out range. But it also extends benefits farther up the income scale and increases costs considerably, a tradeoff that many policymakers may not want to make. The second option is to shrink (or even eliminate) benefits for people in poverty so they have less of a benefit to phase out, and thus lose less as benefits are phased down. This reduces marginal tax rates, but it pushes the poor families into — or deeper into — poverty and increases hardship, and thus may harm children in these families. In effect, the second option would “help” the poor by making them worse off.
The “solution” that some who use marginal-tax-rate arguments to attack safety net programs advance — block grants with extensive state flexibility — doesn’t resolve these difficult tradeoffs. Instead, it passes the buck in making these trade-offs from federal decision-makers to state decision-makers.
The Critique
Some conservative critics of the safety net argue that its structure discourages work by creating exceptionally high marginal tax rates. In Paul Ryan’s first major speech as House Speaker, for example, he asserted that the safety net is “trapping people in poverty,” suggesting that a single mother with one child working at the minimum wage loses 80 or 90 cents in higher taxes and lower benefits for each additional dollar she earns.[4] He and other speakers at a Republican forum on poverty and opportunity in South Carolina on January 9, 2016 consistently repeated this type of example as part of a broad indictment of the safety net.
This example, however, is the exception, not the rule. As shown below, it takes an unusual combination of benefits that few low-income workers receive, over relatively narrow earnings ranges, to reach those rates. For the typical worker in poverty, the benefit loss from additional earnings is a very modest fraction of the amount in Speaker Ryan’s example.
Further, while this analysis focuses on marginal tax rates, it bears noting that the general characterization of the safety net as a “poverty trap” is fundamentally off the mark. Since the War on Poverty began in the 1960s, the safety net’s effectiveness in lifting people out of poverty has increased about ten-fold. Using the Supplemental Poverty Measure — which most analysts favor over the official measure because it counts benefits from the EITC, SNAP, and the like in measuring poverty — safety net programs in 1967 lifted out of poverty only 4 percent of those who would otherwise have been poor. Today, they lift out 42 percent of the otherwise poor. The safety net lifted 36 million Americans above the poverty line in 2014.[5]
Net Income From Working Exceeds That From Not Working
It is widely agreed that the safety net should be constructed so people who aren’t working (but are able to) gain considerable income from finding employment. In this regard, the safety net generally is designed well.
One way to look at this issue is by examining examples involving single-parent families that are eligible for refundable tax credits, SNAP, and health insurance. We chose these programs because they are available to all eligible families that apply and therefore have the broadest impact on low-income households’ marginal tax rates.
We focus part of our analysis on poor families with children — as do most analyses of marginal tax rates and the poor — because they are eligible for substantially more in government benefits than poor able-bodied adults without children. Poor adults who aren’t raising children (and aren’t disabled) don’t face steep marginal tax rates because they receive little safety net assistance to begin with — and thus they aren’t affected by most benefit phase-downs. We also focus on single-parent families because they have much higher poverty rates and rely more heavily on safety net benefits than married-couple families do.
In the examples below, we examine a single mother with two children because about 86 percent of low-income single parents are single mothers and they have an average of 1.8 children. Our findings would be very similar, however, if we had instead considered a single mother with one child. (Throughout, we examine single-mother families in which there are no related adults or cohabitating partners present; we also assume earnings are the families’ only source of private income.)
The most common major benefits package that a single mother with two children and no earnings receives consists of SNAP and Medicaid.[6] The family’s annual SNAP benefits of $6,132 (unless indicated otherwise, all figures in this analysis are in 2015 dollars) would leave it well below the poverty line. And since SNAP can be used only for food, the family would have few resources to meet other basic needs. (The less frequent combinations of benefits in which families receive TANF or housing assistance are described below.)
If this mother finds a job working full time at the federal minimum wage of $7.25 an hour, her annual earnings will rise to about $15,080. She will begin to pay payroll taxes[7] but will also become eligible for sizable help from the federal EITC and Child Tax Credit. On the benefit side, she will lose some SNAP food assistance, but her family will remain eligible for Medicaid in most states.[8]
On balance, her family will gain almost $20,000 in annual income from taking the full-time minimum-wage job. Her income will quadruple. (See Table 1.)
If this mother instead got a job working half-time at the minimum wage, the family would also be much better off compared to not working. Its annual income would increase by $10,600, or more than double, and it would remain eligible for Medicaid in the large majority of states.
In these examples, when the mother takes a job, her family’s total income grows by more than her earnings increase. In other words, her marginal tax rate is negative, not positive.[9] This is because the EITC and Child Tax Credit grow with each additional dollar earned until hitting their maximum levels. (The EITC starts growing with the first dollar earned; the Child Tax Credit starts once earnings exceed $3,000.) The income gains from the EITC and Child Tax Credit significantly exceed the income losses from payroll taxes and any reduction in SNAP benefits.[10]
| TABLE 1 | |||
|---|---|---|---|
| Impact of Work on Earnings, Taxes, and Benefits for Single Mother of Two | |||
| Not Working | Working half-time at minimum wage of $7.25 | Working full-time at minimum wage of $7.25 | |
| Earnings | $0 | $7,540 | $15,080 |
| Taxes and benefits | |||
| Payroll taxes, employee share | 0 | -577 | -1,154 |
| EITC | 0 | 3,010 | 5,548 |
| Child Tax Credit | 0 | 681 | 1,812 |
| SNAP | 6,132 | 6,132 | 4,596 |
| Net effect of taxes and benefits | 6,132 | 9,246 | 10,802 |
| Net income | $6,132 | $16,786 | $25,882 |
Recent research by Johns Hopkins University’s Robert Moffitt, one of the nation’s leading experts in this field, underscores the relevance of these examples. Moffitt found that among families with children receiving SNAP, the vast majority “face cumulative negative marginal rates.”[11]
The above examples do not include TANF cash assistance and housing assistance, since a substantial majority of poor families with children don’t receive such aid. We estimate that one in three single mothers with two children and no earnings receive TANF cash aid; similarly, about one in three receive housing assistance.[12]
A considerably smaller fraction — we estimate 15 percent — of single mothers with two children and no earnings receive SNAP and TANF and housing assistance. Since all three of these benefits can phase out at the same time, these families can face considerably higher marginal tax rates than families receiving only SNAP. Nonetheless, such families receiving multiple benefits are still much better off financially if the mother works than if she doesn’t.
- If the mother takes a full-time minimum-wage job, in the typical case she would keep the large majority (73 percent) of the additional dollars earned.[13] Her earnings would increase by about $15,000, while her net income would rise by $11,000.
- Similarly, if the mother takes a half-time minimum-wage job, in the typical case she would keep 73 percent of the additional dollars earned. Her earnings would increase by about $7,500, while her net income would rise by about $5,500.
Absence of Child Care Can Be an Impediment to Taking a Job
Due to insufficient funding, only one in six families eligible for child care assistance receives it. TANF mothers generally are eligible for child care assistance if they go to work, but most poor mothers don’t receive TANF and don’t receive child care aid if they are employed. Without access to subsidized child care, the only option for many low-income working parents is to cobble together low-cost (and often low quality and unreliable) child care from relatives, friends, or others. The high cost of child care can make it difficult to take a job or work more hours.
Thus, for many low-income families with children, the principle obstacle to working is not a high marginal tax rate from tax and benefit provisions, but insufficient funding for child care assistance. (For families with earnings that do receive child care aid, however, an increase in earnings can result in less or no child care assistance and thereby add to marginal tax rates.)
CBO Data Show Marginal Tax Rates Are Low for Workers in Poverty
The above examples show how single mothers with children typically gain considerably from taking a job. Their earnings increases are much greater than any reduction in benefits. Their marginal tax rates when taking a job, compared to not working, are nowhere close to 80 or 90 percent.
In a comprehensive recent examination of marginal tax rates among low- and moderate-income households,[14] CBO considered a wide range of family compositions, including families with children, single individuals, and childless couples. CBO’s primary focus was not to examine the income gains from taking a job versus not working, but to estimate the marginal tax rates for each additional dollar earned at particular earnings levels.
As Figure 1 shows, CBO found:
- Workers in poverty face marginal tax rates typically far below those for other workers. The median, or typical, worker with earnings below half the poverty line has a marginal tax rate of 14 percent. For workers with earnings between half the poverty line and the poverty line, the typical marginal tax rate is 24 percent. These rates are below the typical rate of 33 or 34 percent for the groups of earners above the poverty line that CBO examined.
- Workers just above the poverty line also gain considerably from earning more. Workers with earnings between 100 and 150 percent of the poverty line typically face marginal tax rates of 34 percent, according to CBO. This means they are about $2 better off for every $3 of additional earnings.
- Both workers in poverty and those just above the poverty lines typically face marginal tax rates much lower than those often cited by critics of safety net programs. Even at 34 percent, the typical marginal tax rate for workers just above the poverty line is less than half the 80 or 90 percent figures that some critics cite.
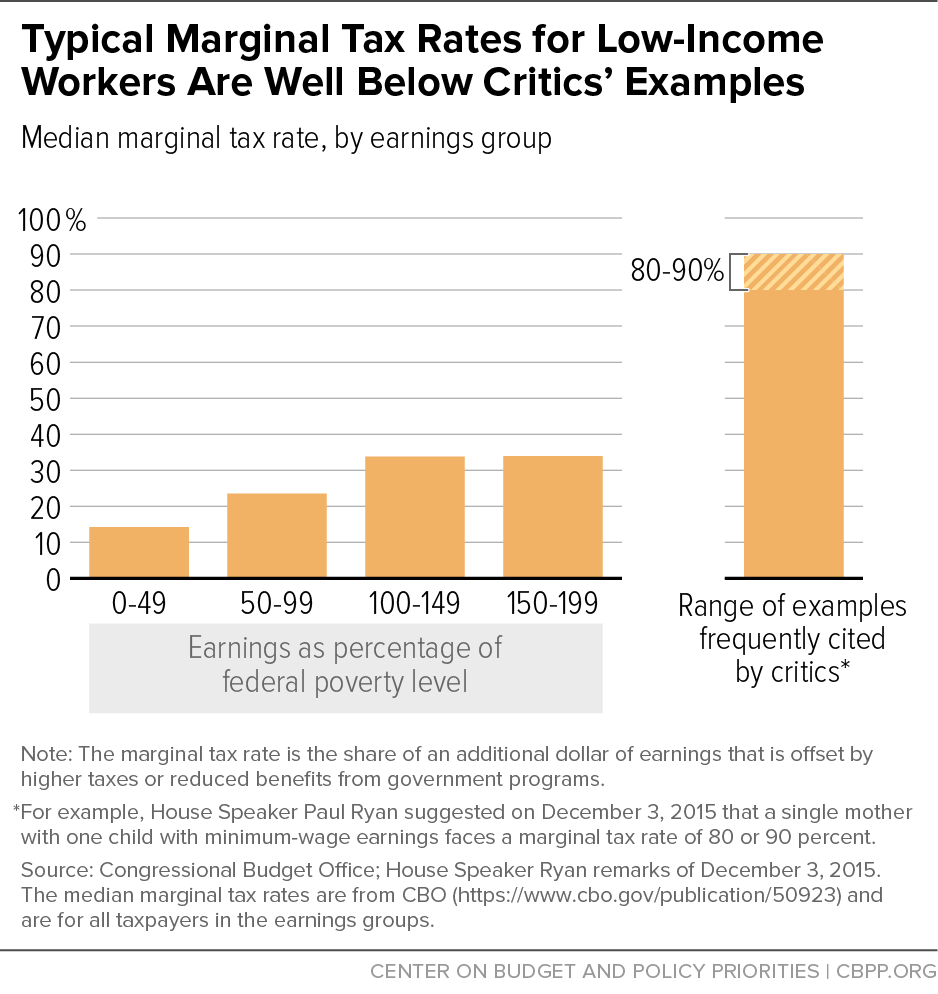
Just 1.1 percent of taxpayers earning less than 450 percent of the poverty line have marginal tax rates of 80 percent or above, according to CBO. (CBO did not provide an estimate for smaller earnings ranges.)
CBO’s analysis covers workers under age 65 who do not receive disability income or Supplemental Security Income; it considers state and federal taxes (including refundable tax credits) as well as SNAP and cost-sharing subsidies for health insurance. Had CBO included a broader range of benefits, such as TANF and housing benefits, the typical marginal tax rates would have been only modestly higher, because these programs go to much smaller shares of the low-income population than SNAP and the refundable tax credits do. Including more benefits would also have increased CBO’s estimate for the share of lower-income workers facing marginal tax rates above 80 percent, but the share very likely would still be very small.
At the same time, CBO includes both the employee and employer shares of the payroll tax in estimating marginal tax rates, leading to higher rates; in our examples, we use only the employee share. In the context of assessing the degree to which payroll taxes influence work decisions, omitting the employer share is more reasonable. The employer share of the payroll tax doesn’t even appear as a deduction from workers’ paychecks. It’s implausible that workers, in deciding whether to take a raise or work more hours, consider the impact on the employer share of payroll taxes.[15]
Poor Families Generally Have Incentive to Increase Wages or Work Hours, and Raising the Minimum Wage Would Help
These CBO data show that low-income households in general are significantly better off if they work more hours or receive an increase in their hourly wage rate. Typically, they retain the lion’s share of any earnings increase. The typical household with earnings below half the poverty line keeps 86 cents of each additional dollar earned, CBO found; the typical household between half the poverty line and the poverty line keeps 76 cents of each additional dollar earned, and the typical household modestly above the poverty line keeps 66 cents of each additional dollar earned.
Poor families with children have an even larger incentive than these CBO figures indicate, because the CBO figures are for all households. Families with children receive larger EITCs and Child Tax Credits as their earnings increase (until they reach the maximum credit amounts).
Returning to our earlier example of a mother with two children, if her earnings double because she moves from half-time to full-time work at the minimum wage (or continues working half-time but her pay doubles, to twice the minimum wage), her earnings increase by $7,500. But her net income increases even more, by $9,100, reflecting the larger tax credits she receives. (See Figure 2.)
Some have argued that low-income households would benefit little from raising the minimum wage because of the loss of government benefits. The results of an Urban Institute analysis show otherwise. Calculating the effects of raising the federal minimum wage from $7.25 to $10.10 an hour,[16] the analysis found that, in the aggregate, workers and their families would gain substantially more than they would lose. The affected households would retain three of every four dollars in increased earnings from this rise in the wage standard, with a net income gain of $33 billion overall. (The estimates were made for 2010.)
Specifically, Urban estimated that the minimum-wage increase would:
- boost workers’ net earnings by $44.9 billion;
- increase their net federal and state income and employee payroll taxes by $10.2 billion; and
- reduce government cash and noncash benefits by $1.5 billion, taking into account government benefits outside of health care assistance.
In other words, the roughly $45 billion in added wages would be partly offset by a loss of about $12 billion due to lower benefits and higher taxes, but households would receive a net income gain of $33 billion.[17]
Safety Net Changes Have Reduced Marginal Tax Rates for the Poor
Policymakers in recent decades have significantly expanded safety net assistance to those who are working. Much of this additional assistance results from several expansions of the EITC and the creation and expansion of the low-income component of the Child Tax Credit.
Both credits go only to families that work, and they grow (“phase in”) with additional earnings until reaching their maximum value. In the phase-in range, the positive work incentive effect is very substantial. For a family with two children, the EITC grows by 40 cents for every dollar earned until reaching a maximum of $5,548 at earnings of $13,870.[18] Meanwhile, once the family’s earnings exceed $3,000, it begins to receive the Child Tax Credit as well. The Child Tax Credit grows by 15 cents for every dollar earned until the family’s earnings reach about $16,300, when the family qualifies for the maximum credit of $2,000 for a family with two children.
A substantial body of research finds that the EITC is highly effective at increasing employment rates among single mothers. One notable study found that the positive work incentive provided by the EITC expansions of the mid-1990s induced more single mothers to go to work than did welfare reform policy changes such as time limits and work requirements.[19] (The Child Tax Credit has been less studied.)
Annual Tax Credits Versus Monthly Benefits
The timing of tax-credit and benefit receipt could potentially influence some work decisions. The EITC and Child Tax Credit are received in lump-sum payments once a year (during tax season), while program benefits are provided in monthly payments. Wages are usually paid weekly or bi-weekly.
Over earnings ranges in which the tax credits phase in, the added benefit of larger credits may be muted for some families since the credits aren’t received for several months or more, while any benefit reductions may occur within a month. However, surveys show that many families prefer the tax credits’ lump-sum annual payments, as they provide a way to save up for large purchases such as a new refrigerator or major home repairs. It also bears noting that in the large majority of cases, a single mother’s monthly income still goes up considerably when she becomes employed irrespective of her tax credit benefits, because the increase in her earnings each month will exceed any monthly loss in other benefits.
Over the earnings ranges in which the EITC phases down, the effect is in the other direction. The family loses annually distributed EITC benefits as its weekly or bi-weekly earnings rise. In this case as well, the typical family still ends up ahead; even if its EITC and program benefits are falling, the reduction in benefits and increase in other work-related taxes typically will be significantly outweighed by the increase in earnings.
In addition, the 2010 Affordable Care Act significantly reduced work disincentives for many working-poor parents. Before health reform, Medicaid eligibility for working parents in the typical (or median) state ended at just 61 percent of the poverty line, creating a substantial work disincentive “cliff.” Health reform changed this markedly, especially in the District of Columbia and the 31 states (and counting) that have adopted its Medicaid expansion.[20] In those states, working parents remain eligible for Medicaid until their income reaches 138 percent of the poverty line, and those whose earnings rise above that level qualify for subsidies to purchase health coverage in the new insurance marketplaces, if they lack access to affordable employer-based coverage.[21] This is just one of the many ways in which state choices can influence marginal tax rates.
All told, the transformation of the safety net over the past few decades into more of what analysts call a “work-based safety net” represents a major change in U.S. social policy, with both positive and negative consequences. Generally speaking, while work incentives and support for workers are considerably stronger for the poor today than in previous decades,[22] cash assistance is significantly weaker for very poor families with children in which a parent is unsuccessful in the labor market and lacks earnings, including families in which parents have substantial barriers to employment.
TANF cash assistance for families with children has declined particularly sharply. For every 100 poor families with children, only 23 received TANF cash assistance in 2014, down sharply from 82 for every 100 poor families with children in 1979 and 68 for every 100 such families in 1996 under TANF’s predecessor, the Aid to Families with Dependent Children (AFDC) program.[23]
The combined effect: “While no time series of cumulative MTRs [i.e., marginal tax rates] is available, there is little question that they have fallen significantly over time,” concludes Johns Hopkins University’s Robert Moffitt, noting the dramatic decline in TANF recipients (which has lowered the number of people who lose cash assistance benefits as their earnings rise) and the expansion of the EITC and Child Tax Credit (the benefits of which increase or remain stable as earnings grow for most poor workers).[24]
Safety Net Has Only Modest Effects on People’s Work Choices
A team of scholars with expertise on safety net programs undertook a comprehensive review of the research on how the major means-tested and social insurance programs affect people’s choices about work. Individual programs can have significant effects (some negative, some positive) on how much people work, the review found. But in combination, the programs’ work disincentives are small enough to have “almost no effect” on the safety net’s overall impact in reducing poverty. “We find that, while there are significant behavioral side effects of many programs, their aggregate impact is very small and does not affect the magnitude of the aggregate poverty impact of the [safety net] system,” the authors concluded.[25]
One reason for this outcome surely is that, as shown above, most low-income families do not face high marginal tax rates. There are a number of other reasons why marginal tax rates have little overall impact on behavior, even among those who face high marginal rates.
- Workers frequently have little control over their work hours. “In-depth sociological and economic research finds that low-wage workers, the target population for the EITC, have less discretion and control over work schedules than higher-wage workers,” an examination of the relevant literature concluded. The authors’ own survey of EITC recipients found that “it was virtually impossible for them to manipulate their employment … situations given the lack of control and stability offered by their low-wage jobs.”[26]
- Higher marginal tax rates can lead some people to work less, but others to work more. Researchers often note that while a higher marginal tax rate may persuade someone to work less than he or she otherwise would, by lowering the net benefit from working an additional hour, a higher marginal rate also can induce some other workers to work more hours, in order to reach a particular level of after-tax income such as the level needed to afford rent and other basic needs.
-
Workers likely don’t turn down raises or promotions out of fear that raising their incomes would cost them too much in lost benefits. A study by Jennifer Romich based on interviews of low-income working families found that “Over the 3 years of fieldwork, there were no reported instances in which workers directly declined a raise or promotion.”[27] The findings, while based on a very small sample size, suggest that once in a job, workers generally don’t turn down advancement opportunities because of marginal tax rates.[28]
This may reflect a longer-term perspective on their work careers. Turning down a promotion because of a high marginal tax rate might be very unwise for a worker’s future earnings potential, jeopardizing future promotions. Added hours, promotions, and the like can help put people on a career trajectory with substantial income gains over time.
- The lack of information about or understanding of safety net programs means workers are less likely to take marginal tax rates into account. The Romich study found, “[C]hanges in means-tested benefits are not obvious to the worker when he or she initially decides to accept a raise, take a second job, or work overtime hours.”[29] The above-cited survey of EITC recipients reported that the respondents “cannot predict how their EITC refund would change if they altered their labor supply.”[30] The differing structures and timing of these programs, and the inherent difficulty of marginal tax rate calculations, mean that workers frequently do not make the detailed technical estimates that certain economic theories assume.
Last, in critical ways, workers prefer income earned through a paycheck to the same amount of income received through a benefit payment. One reason is that families have more control over how they spend cash earnings than in-kind benefits. A second reason is that the poor, like the non-poor, typically value work and self-sufficiency. As Kathryn Edin and Luke Shaefer concluded in their recent book on the difficult circumstances facing families with little or no income: “Everything we’ve learned about the $2-a-day poor suggests that it is typically the opportunity to work that is lacking, not the will, and that ensuring work opportunity would do no end of good.”[31]
The Rare Cases Where Marginal Tax Rates Exceed 80 Percent
The high marginal tax rates that do occur because of the phase-out of safety net programs are in large part among workers with earnings just above the poverty line, not workers in poverty. Even here, marginal tax rates of 80 percent or more are rare, occurring only for workers receiving a wide range of government assistance whose components can phase out at the same time. Among the major programs this analysis examines, the families that fall into this category would need to receive housing assistance or TANF as well as the EITC and SNAP. [32]
- Nearly all near-poor families with children (defined as those with earnings between 100 percent and 150 percent of the poverty line) receive the EITC, which begins phasing out around the poverty line.[33]
- The majority of near-poor families with children receive SNAP, which begins phasing out well below the poverty line and continues phasing out for the near-poor.
- A very small minority of near-poor families with children receive housing assistance, which (like SNAP) begins phasing out well below the poverty line and continues phasing out for the near-poor.
- Only a tiny proportion of families whose annual earnings put them in the near-poor category receive TANF. While the TANF phase-down structure varies by state, TANF benefits are phased out in nearly all cases before family earnings reach the poverty line.
A single parent with earnings just above the poverty line who receives the EITC, SNAP, and housing benefits would likely have a marginal tax rate above 80 percent.[34] If the family has two children, its EITC would phase out at a 21 percent rate, its SNAP benefits at a 24 percent rate, and housing aid at a 30 percent rate. It also would have payroll taxes of 7.65 percent deducted from its paycheck and (in a typical state) pay state income tax of about 3 percent.
But very few low-wage families with children receive the EITC and SNAP and housing aid and have earnings in the range where all of these benefits are phasing out simultaneously, creating very high marginal tax rates. We estimate that just 3 percent of all single mothers with two children with earnings below 150 percent of the poverty line fall into this category and face marginal tax rates exceeding 80 percent.[35] Near-poor two-parent families with children are even less likely to receive this combination of aid, and near-poor households without children never receive such a combination because they don’t receive the EITC and are much less likely than single-parent families to receive SNAP or housing aid.
Reducing Marginal Tax Rates Involves Difficult Tradeoffs
While marginal tax rates exceeding 80 percent are rare, many families with earnings just above the poverty line can face high rates (in the neighborhood of 60 percent) even if they don’t, for instance, receive housing assistance. All else being equal, it would be desirable to lower the marginal tax rates of near-poor families that face very high rates as well as of other low-income families facing high rates. But doing so requires difficult tradeoffs.
The safety net has multiple goals. In addition to promoting work, it should reduce poverty and hardship and promote opportunity. It must also operate within appropriate cost constraints.
In assessing any proposed changes to the safety net, it’s essential to examine how the changes would influence the balance of these goals. Broadly speaking, there are only two ways to reduce marginal tax rates:
-
Change the phase-out structure of particular programs. One way to do this is to increase earnings disregards so benefits don’t phase down until families reach higher income levels. Another way is to slow down the rate at which benefits phase out.
The large tradeoff here is the price tag. Increasing earnings disregards — or phasing benefits out more slowly — increases costs.
In addition, lowering marginal tax rates for some workers can raise marginal tax rates for others. For example, when benefits phase out more slowly, marginal tax rates fall for workers in the current phase-out range but rise for those with higher incomes who previously didn’t qualify for the benefit (though they will be better off overall because of their new benefit receipt).
- Reduce (or eliminate) the amount of assistance available to households receiving full benefits, which usually are the poorest households. If benefits are lowered, they can be phased out more slowly (or over a smaller income range), reducing marginal tax rates. And if benefits are eliminated, there are no benefits to phase down. The obvious tradeoff, however, is that reducing or eliminating assistance harms poor families and children and increases hardship. In addition, a growing body of research indicates this may also have negative long-term consequences for poor children.
Medicaid “Cliffs” and Potential Loss of Housing Assistance Raise Difficult Questions
For poor or near-poor workers, some of the most complicated situations influencing work decisions occur when they are in danger of losing benefits altogether. One “cliff” described in this paper occurs in most states that have not adopted the Affordable Care Act’s Medicaid expansion. In the typical such state, a single parent in a family of three is fully eligible for Medicaid only until the parent’s earnings reach 44 percent of the poverty line. The parent loses Medicaid coverage at that point (except for certain parents who receive transitional coverage) and doesn’t qualify for subsidies to purchase coverage in the ACA’s health insurance marketplaces until his or her earnings reach 100 percent of the poverty line. States can eliminate such cliffs and increase the incentive to earn more by adopting the Medicaid expansion, which is almost fully financed by the federal government.
Workers who would lose housing voucher assistance altogether — not because of a cliff but because their earnings have increased to the point where their benefits have completely phased out — may also face a difficult decision. Housing assistance is not an entitlement provided to every family that meets the program’s eligibility criteria, and if a family loses rental assistance due to a jump in earnings but its earnings later decline and the family again meets the income eligibility limits for housing aid, it won’t automatically regain such assistance. The family may have to go on a long waiting list to receive assistance again.
The potential policy responses here entail more tradeoffs. Changing the program’s benefit formula to keep such families in the program would shift assistance from lower-income families to more moderate-income families, making the program less effective in preventing homelessness and stabilizing poor families’ housing. An alternative would be to significantly increase the number of rental vouchers to shorten waiting lists for vouchers; doing so would increase program costs.
Most of those who argue that high marginal tax rates trap people in low-wage jobs do not explain what changes they would make to reduce these rates. Do they recommend phasing out benefits more slowly, at increased cost? Do they recommend cutting back program benefits and tax credits for working-poor parents and children with very low incomes even though that would make these families worse off and push them deeper into poverty?
These critics tend to say that the answer lies in converting various safety net programs to block grants and turning them over to the states.[36] Apart from posing large risks that federal funding won’t respond when poverty and need increase, such as during recessions, and that federal funding will erode over time, as it has for most other block grants,[37] this answer essentially evades the question by deflecting the issue of how to balance the desire for lower marginal tax rates against other core safety net goals. The significant tradeoffs regarding marginal tax rates remain, regardless of whether policy decisions are made at the federal or state level.
End Notes
[1] This paper draws from earlier CBPP publications. See Sharon Parrott and Robert Greenstein, “Policymakers Often Overstate Marginal Tax Rates for Lower-Income Workers and Gloss Over Tough Trade-Offs in Reducing Them,” December 3, 2014, https://www.cbpp.org/research/policymakers-often-overstate-marginal-tax-rates-for-lower-income-workers-and-gloss-over. A condensed version of that paper is available at https://www.cbpp.org/research/policymakers-often-overstate-marginal-tax-rates-for-lower-income-workers-and-gloss-over-0
[2] This calculation excludes the value of health benefits, which, in most states, would not be affected in these scenarios, because the mother and her children would remain eligible for Medicaid. The calculation also doesn’t include extra costs from working, such as child care expenses, or subsidies to help cover those expenses.
[3] Yonatan Ben-Shalom, Robert Moffitt, and John Karl Scholz, “An Assessment of the Effectiveness of Anti-Poverty Programs in the United States,” Institute for Research on Poverty, Discussion Paper no. 1392.11, revised June 2011.
[4] Speaker Ryan’s Press Office, “#ConfidentAmerica: Full Text of Speaker Ryan’s Remarks at the Library of Congress,” December 3, 2015, http://www.speaker.gov/press-release/full-text-speaker-ryans-remarks-library-congress?Source=GovD.
[5] Danilo Trisi, “Safety Net’s Anti-Poverty Effectiveness has Grown Nearly Ten-Fold Since 1967,” Center on Budget and Policy Priorities, January 4, 2016, https://www.cbpp.org/blog/safety-nets-anti-poverty-effectiveness-has-grown-nearly-ten-fold-since-1967.
[6] An estimated 40 percent of single mothers with two children and no earnings receive SNAP but not TANF or housing assistance; 18 percent receive SNAP and TANF; 18 percent receive SNAP and housing aid; 15 percent receive SNAP and TANF and housing aid; 7 percent receive no help from any of these programs. Source: CBPP calculations based on data from the Current Population Survey for 2009-2012, adjusted for underreporting of TANF and SNAP, using the Urban Institute’s TRIM3 policy microsimulation model (baseline data) developed and maintained by the Urban Institute under primary funding from the Department of Health and Human Services, Office of the Assistant Secretary for Planning and Evaluation (HHS/ASPE). TRIM3 project website, trim3.urban.org, downloaded January 22, 2015.
[7] Working-poor families with children are exempt from state income taxes in the large majority of states, so no deduction for state taxes is assumed here. This example also ignores state EITCs, which boost the returns to work compared to not working. They are in place in 26 states and Washington, D.C.
[8] Under current law, in 34 states (31 of which have chosen the Medicaid expansion) and the District of Columbia, a single parent with two children remains eligible for Medicaid after obtaining a full-time minimum wage job.
[9] Similarly, if the family’s earnings went from $0 to half the poverty line (about $9,640 in 2015), its net income would increase by $13,500. If the family’s earnings went from $0 to the poverty line (about $19,280), its net income would increase by about $21,500. In these examples, as well, the family’s income would grow by more than its earnings, and the family’s marginal tax rate would be negative.
[10] The EITC for these families phases in at a 40 percent rate, and the Child Tax Credit at a 15 percent rate. SNAP disregards a modest amount of earnings in determining benefit levels and typically phases out benefits at a 24 percent or 36 percent rate, depending on other expenses such as rents and utilities. The examples in Table 1 assume the family receives SNAP’s median shelter-cost deduction, as reflected in SNAP administrative data. Employee payroll taxes equal 7.65 percent of wages.
[11] Robert A. Moffitt, “Multiple Program Participation and the SNAP Program,” November 30, 2014. This is a revised version of a paper presented at the September 2013 conference “Five Decades of Food Stamps,” sponsored by the University of Kentucky Center for Poverty Research and the Institute for Research on Poverty.
[12] CBPP calculations based on data from the Current Population Survey for 2009-2012 adjusted for underreporting of TANF and SNAP, using the Department of Health and Human Services/Urban Institute’s TRIM model.
[13] These calculations can vary depending on a family’s shelter costs and TANF and housing benefits. For this figure, we used typical values for all three areas. For TANF, this meant using the benefit level and benefit-reduction approach for Kansas (which provides the median level of benefits among all states and has a representative phase-down structure). For housing, this meant using the median value for the lessor of the payment standard or the contract rent plus the utility allowance.
[14] Congressional Budget Office, “Effective Marginal Tax Rates for Low- and Moderate-Income Workers in 2016,” November 2015, https://www.cbo.gov/sites/default/files/114th-congress-2015-2016/reports/50923-MarginalTaxRates.pdf.
[15] Explained numerically, our approach assumes a worker making $10 an hour who is deciding whether to work one more hour would take into account that 76.5 cents (or 7.65 percent of $10) in payroll taxes (the employee share) would be deducted from his paycheck. CBO’s approach assumes that the worker would focus not on the hourly wage of $10 but on his total real compensation of $10.77 an hour (which includes the employer’s share of payroll taxes) and conclude that the employer and employee payroll taxes together reduce that amount by $1.53 (or 14.2 percent).
[16] The Urban Institute conducted this analysis for the Children’s Defense Fund. See Linda Giannarelli et al., “Reducing Child Poverty in the U.S.: Costs and Impacts of Policies Proposed by the Children’s Defense Fund,” The Urban Institute, January 2015, Appendix Tables C3.2A and C3.2B, http://www.urban.org/sites/default/files/alfresco/publication-pdfs/2000086-Reducing-Child-Poverty-in-the-US.pdf. The Urban simulations assume modest job losses due to the higher minimum wage and a wage increase for some workers above the new minimum wage due to “spillover” effects of the wage increase.
[17] These are aggregate results. There is considerable variation in the effects of minimum-wage increases on workers in households with different incomes and levels of benefit receipt.
[18] Parameters are for tax year 2015.
[19] CBPP analysis of results from Jeffrey Grogger, “The Effects of Time Limits, the EITC, and Other Policy Changes on Welfare Use, Work, and Income among Female-Headed Families,” Review of Economics and Statistics, May 2003 and data from the March 1999 Current Population Survey.
[20] Jesse Cross-Call, “Louisiana Will Be the Next Southern State to Expand Medicaid,” Center on Budget and Policy Priorities, January 12, 2016, https://www.cbpp.org/blog/louisiana-will-be-the-next-southern-state-to-expand-medicaid.
[21] The exchange subsidies have a mixed effect on marginal tax rates. On the one hand, they mean that families whose earnings rise above Medicaid income eligibility limits don’t abruptly lose government health assistance altogether (often described as falling off a benefit “cliff”). At the same time, the subsidies phase out as earnings rise, modestly increasing marginal tax rates.
[22] One recent study found that “A household that increased its income from $0 to $1,000 lost $206 in 2000, but only $92 in 2014.” Karen Long Jusko, “The Poverty and Inequality Report,” Pathways, Stanford University, Special Issue 2015.
[23] Ife Floyd, LaDonna Pavetti, and Liz Schott, “TANF Continues to Weaken as a Safety Net,” Center on Budget and Policy Priorities, updated October 27, 2015, https://www.cbpp.org/research/family-income-support/tanf-continues-to-weaken-as-a-safety-net.
[24] Robert Moffitt, Economics of Means-Tested Transfer Programs in the United States, Introduction to Volume 1, November 9, 2015, http://papers.nber.org/books/moff14-1.
[25] Op. cit., Ben-Shalom, Moffitt, and Scholz. The authors conducted their analysis for 2004.
[26] Laura Tach and Sarah Halpern-Meekin, “Tax Code Knowledge and Behavioral Responses among EITC Recipients: Policy Insights from Qualitative Data,” Journal of Policy Analysis and Management, Vol. 33, No. 2 (Spring 2014), pp. 417 and 434. This paper reflected an in-depth interviews with 155 families receiving the EITC in Boston in 2007.
[27] Jennifer L. Romich, “Difficult Calculations: Low-Income Workers and Marginal Tax Rates,” Social Service Review, Vol. 80, No. 1 (March 2006), p. 57. The study combined in-depth interviews of 40 Wisconsin families over a three-year period starting in 1997 with administrative data on benefit receipt and employment and earnings.
[28] While the behavioral responses to the phase-down of benefits may not be large, the Romich study found that families were frustrated that their circumstances didn’t improve to a larger extent when their earnings rose, though some expressed satisfaction that they had become more self-sufficient.
[29] Ibid. p. 49.
[30] Op. cit., Tach and Hapern-Meekin, page 414.
[31] Kathryn J. Edin and H. Luke Shaefer, $2.00 a Day: Living on Almost Nothing in America, 2015, p. 159.
[32] Among single-mother families with two children and annual earnings between the poverty line and 150 percent of the poverty line, we estimate that at some point in the year, 8 percent receive the EITC, SNAP, and housing assistance; 2 percent receive the EITC, SNAP, and TANF; and under 1 percent receive the EITC, SNAP, housing assistance, and TANF. CBPP calculations based on data from the Current Population Survey for 2009-2012, adjusted for underreporting of TANF and SNAP, using the Department of Health and Human Services/Urban Institute TRIM model.
[33] For a single-mother family with two children, the EITC begins to phase out at $18,110, about $1,000 below the poverty line. The EITC also begins to phase out at $18,110 for a single mother with one child, which is about $1,800 above the poverty line for such a family.
[34] This worker’s exact marginal tax rate can vary depending on a state’s tax system and certain decisions it makes concerning SNAP and housing assistance rules.
[35] The 3 percent estimate represents the share of mothers with two children and earnings below 150 percent of the poverty line who meet the following conditions: they are in the phase-down range of the EITC, and at some point during the year, they received SNAP and housing or TANF benefits (or both).
The calculation includes two assumptions that bias the figure upwards. One is the inclusion of families that received TANF at some point during the year and are in the EITC phase-down range based on their annual earnings. Many of these families are unlikely to have received TANF benefits at the same time they were working rather than at different points during the year; they might have received TANF early in the year, for instance, but subsequently obtained employment that took them off TANF (and led them to end up with annual earnings in the EITC phase-down range). Second, the 3 percent calculation assumes that all families that receive housing assistance and have earnings in the EITC phase-down range also face a phase-down of their housing benefits for each additional dollar they earn. In fact, some housing assistance beneficiaries in this earnings range pay flat rents: their housing benefits do not phase out as their earnings rise.
On the other hand, largely because the calculation reflects a focus on beneficiaries of the EITC, SNAP, TANF, and housing aid, it doesn’t capture some families that face very high marginal tax rates. These include families that are affected by the Medicaid “cliff” in states that haven’t adopted the Affordable Care Act’s Medicaid expansion, and families that receive child care assistance that phases down (under their state’s rules for child care aid) at the same time that other benefits they receive also phase down.
CBPP calculations based on data from the Current Population Survey for 2009-2012, adjusted for underreporting of TANF and SNAP benefits, using the Department of Health and Human Services/Urban Institute TRIM model.
[36] The critics often overlook the substantial flexibility states already have to influence marginal tax rates. For example, they set eligibility and phase-out rules for TANF, can implement state EITCs to promote work among low-income people, and can expand Medicaid to higher income levels.
[37] Speaker Ryan has advanced a plan to provide state flexibility through the creation of an “Opportunity Grant”. For a discussion of why that approach would likely increase poverty and hardship, see Robert Greenstein, “Ryan and Block-Granting the Safety Net,” Center on Budget and Policy Priorities, December 3, 2015, https://www.cbpp.org/blog/ryan-and-block-granting-the-safety-net.
More from the Authors