- Home
- Food Assistance
- SNAP Helps Struggling Families Put Food ...
Chart Book: SNAP Helps Struggling Families Put Food on the Table
The Supplemental Nutrition Assistance Program (SNAP) is the nation’s most important anti-hunger program.
- SNAP reaches millions of people who need food assistance. It’s one of the few means-tested government benefit programs available to almost all households with low incomes. For basic information on the program, see “Policy Basics: The Supplemental Nutrition Assistance Program.”
- SNAP promotes long-term health and well-being, especially for children. Research shows that SNAP reduces poverty and food insecurity, and that over the long term, these impacts lead to improved health and economic outcomes, especially for those who receive SNAP as children. For more on the long-term impacts of SNAP, see “SNAP Works for America’s Children” and “SNAP is Linked with Improved Nutritional Outcomes and Lower Health Care Costs.”
This chart book highlights some key characteristics of the 38 million people using the program as well as trends and data on program administration and use.[1] It complements more detailed analyses on particular aspects of SNAP, available on our website.
Part I: SNAP Responds to Changes in Poverty and the Economy
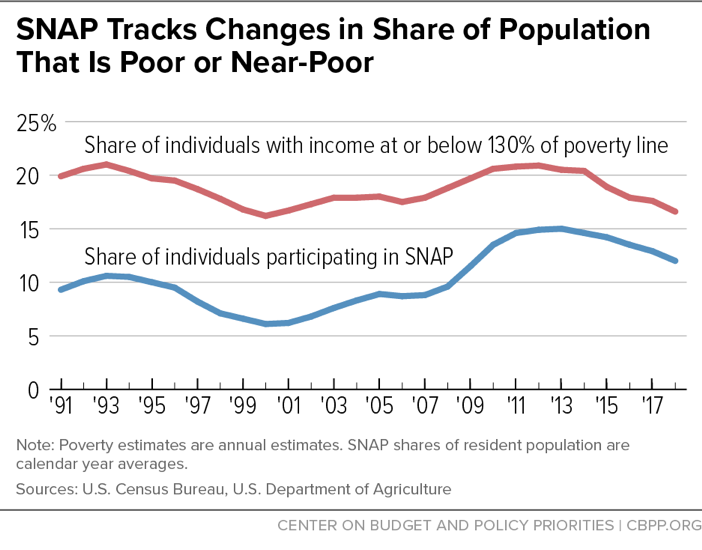
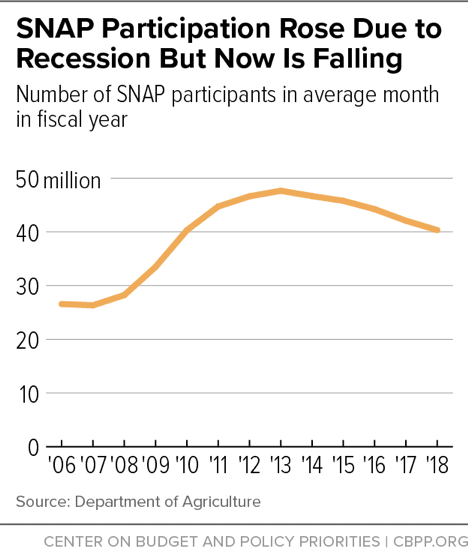
The number of SNAP participants rises during economic downturns and falls as the economic recovery reaches low-income households. After unemployment insurance, SNAP historically has been the most responsive federal program in assisting families and communities during economic downturns. The Great Recession was no exception. SNAP grew rapidly between 2008 and 2011, as the recession and lagging recovery led more low-income households to qualify and apply for help.
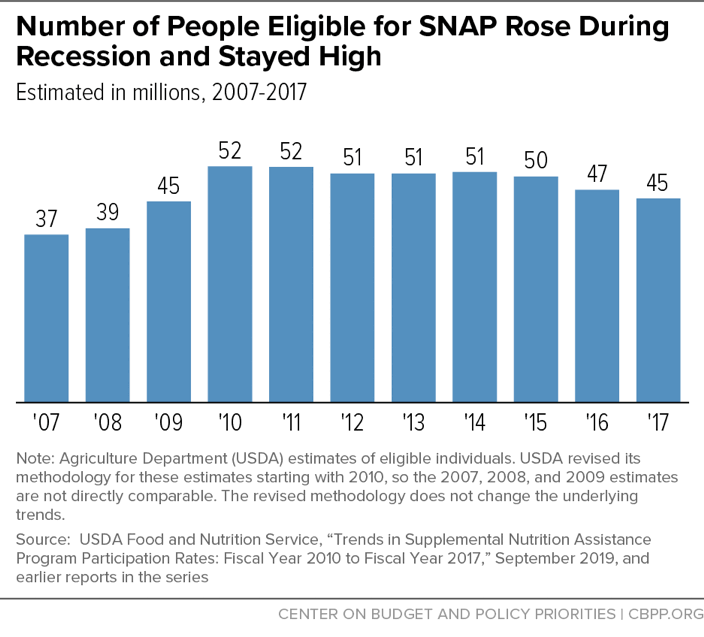
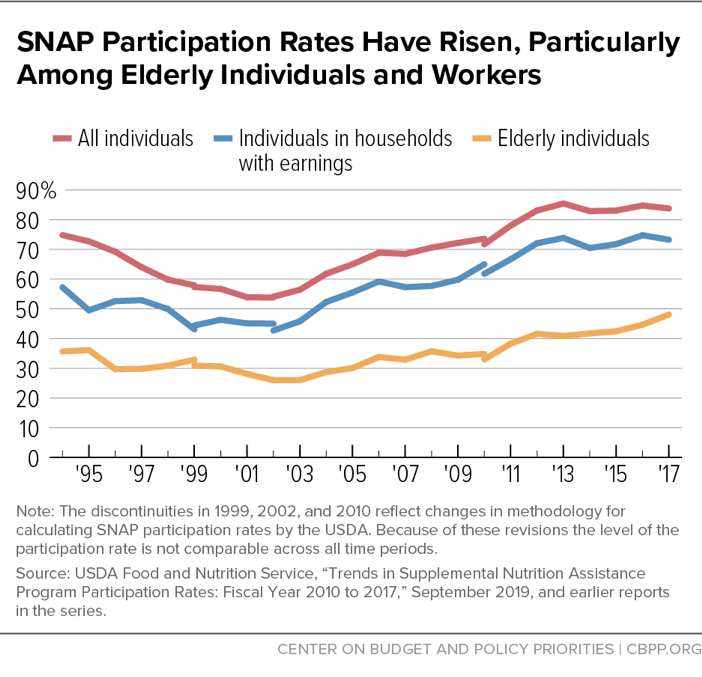
The number and share of eligible people participating in SNAP rose significantly during the Great Recession and stayed high during the slow recovery, driving SNAP caseload growth. Poverty and food insecurity both rose substantially in the recession, making more people eligible for SNAP; both have since fallen back to pre-recession levels. In 2018 the official poverty rate fell below its 2007 level and is closer to the lower, 2001 level.[2] Similarly, food insecurity has fallen to its 2007 level.[3] While indicators such as the unemployment rate show that the economy has improved, the number of people eligible for SNAP fell more slowly after the Great Recession due to the slow decline in poverty. SNAP also reached a higher share of eligible people: the participation rate among eligible individuals rose from 69 percent in 2007 to 84 percent in 2017 (the most recent year for which USDA estimates are available).[4]
Research on the Great Recession finds that economic factors (such as the unemployment rate) explain between about half and 90 percent of the increase in SNAP caseloads between 2007 and 2011.[5]
As the effects of the economic recovery have been felt more broadly, SNAP caseloads have been declining faster. Caseloads expanded significantly between 2007 and 2011 as the recession and lagging economic recovery dramatically increased the number of low-income households that qualified and applied for help. These changes were temporary, however. SNAP caseloads grew more slowly in 2012 and 2013, fell by 2 percent in both 2014 and 2015, and have since been falling faster. Nationally, SNAP caseloads have been falling for five years; about 7 million fewer people participated in SNAP in 2018 than in 2013.
To the extent that SNAP caseload declines reflect improving economic circumstances among low-income households, they are welcome. However, an austere provision affecting some of the nation’s poorest individuals, SNAP’s three-month time limit for childless adults, also reduced caseloads to a smaller extent in recent years. Its impact was most pronounced in 2016, when 21 states reintroduced it in at least part of the state after having suspended the limit during the recession. In those states, the number of SNAP participants potentially subject to the time limit (adults age 18-49 without disability benefits or children in their household) fell by about 1 million, or nearly 40 percent, between 2015 and 2017, reflecting the large number that were cut off from SNAP because of the time limit.[6]
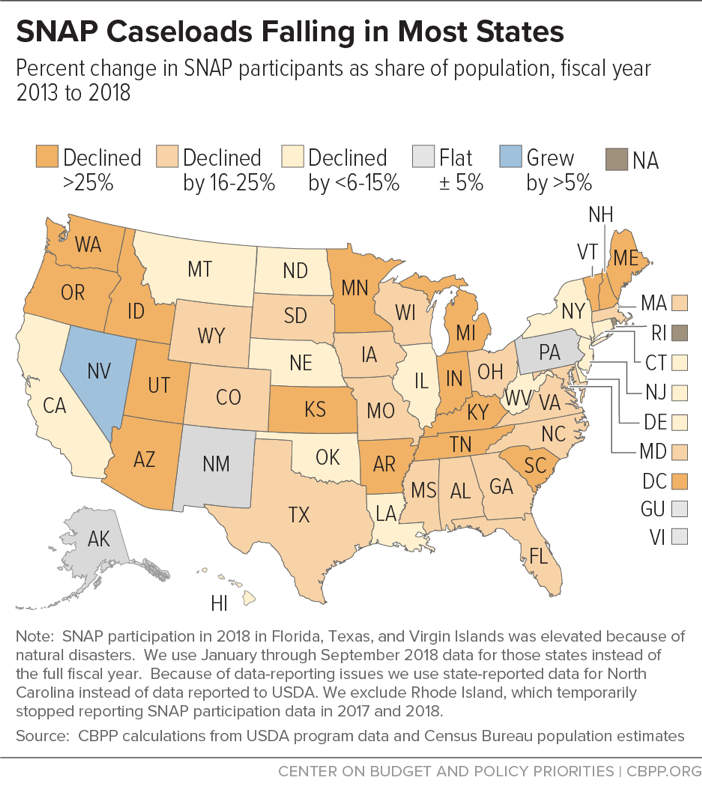
Most states have falling caseloads. Every state saw substantial SNAP caseload increases during the recession and slow recovery, when national caseloads were rising. Since national SNAP caseloads peaked in December 2012, and as the economy has improved, caseloads have declined in almost every state, though the timing and depth of the declines has varied by state. The share of the population participating in SNAP — a measure that adjusts for population growth — fell by about 19 percent between 2013 and 2018. In 32 states and the District of Columbia, the share of the population participating in SNAP declined by at least 15 percent during the same period. SNAP participation as a share of the population is near pre-recession levels in nine states and D.C.[7]
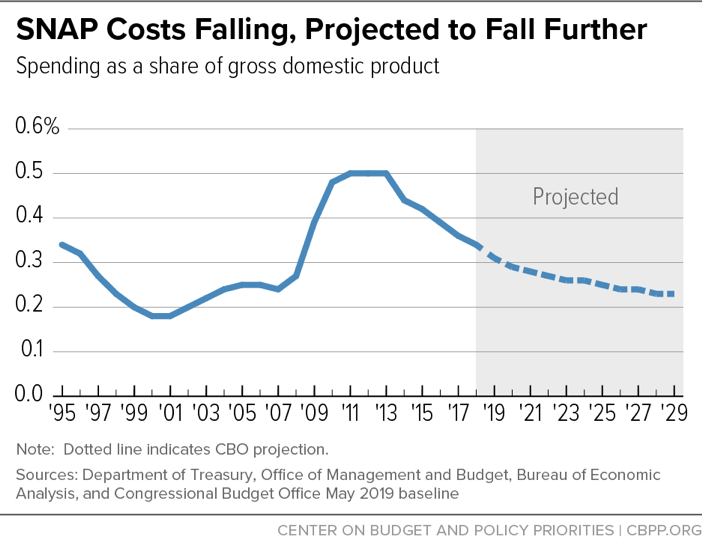
SNAP spending, which also rose significantly in the recession, is falling as well. SNAP spending fell for the fifth straight year in 2018. Spending rose during the recession due to increased participation and the 2009 Recovery Act’s temporary benefit increase. The Recovery Act temporarily boosted SNAP benefits to provide fast and effective economic stimulus and push against the rising tide of hardship for low-income Americans. Since then, spending has fallen due to the decline in participation, the expiration of the benefit increase, and low food price inflation. SNAP spending as a share of gross domestic product returned to its 1995 level in 2018, and the Congressional Budget Office (CBO) predicts that this share will continue to fall and return to its lower 2007 levels by 2026.[8]
Once the economy has fully recovered, SNAP costs are expected to rise only in response to increases in food prices and the size of the low-income population. Unlike health care programs and Social Security, SNAP doesn’t face demographic or programmatic pressures that would cause its costs to grow faster than the economy over the long term. SNAP thus doesn’t contribute to the nation’s long-term fiscal problems.
Part II: Benefits Are Modest
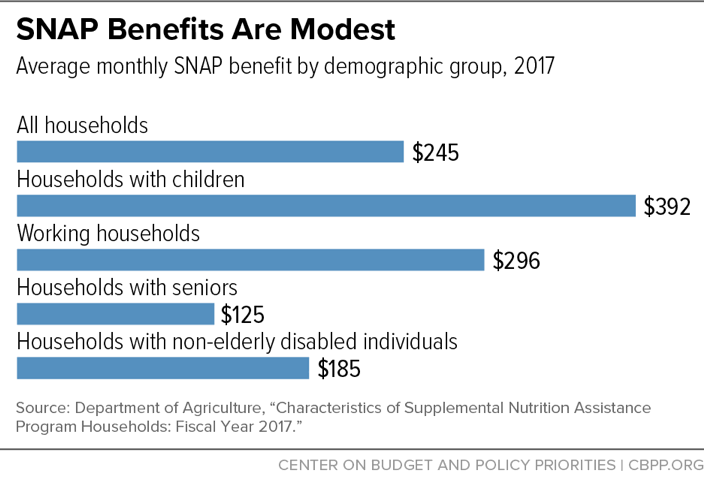
SNAP benefits average only about $1.40 per person per meal. In fiscal year 2018, the average SNAP household received about $256 a month, and the average recipient about $127 a month — about $1.40 per meal.[9]
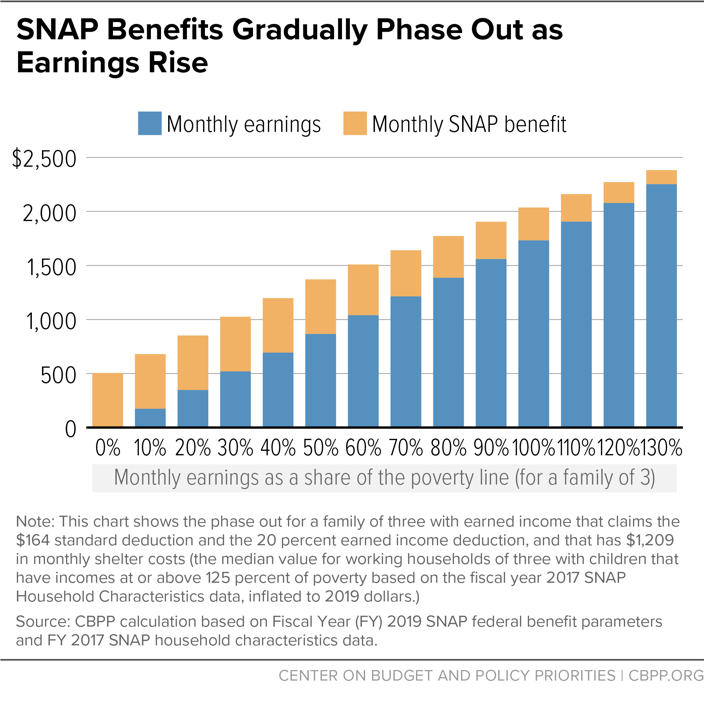
SNAP benefits are based on need: very poor households receive larger benefits than households with more income since they need more help affording an adequate diet. The benefit formula assumes that families will spend 30 percent of their net income for food; SNAP provides enough additional benefits to meet the cost of the Thrifty Food Plan, the Agriculture Department’s estimate of a bare-bones, nutritionally adequate diet.
A family with no net income has no money for food and thus receives the maximum benefit amount, which equals the cost of the Thrifty Food Plan for a household of its size.
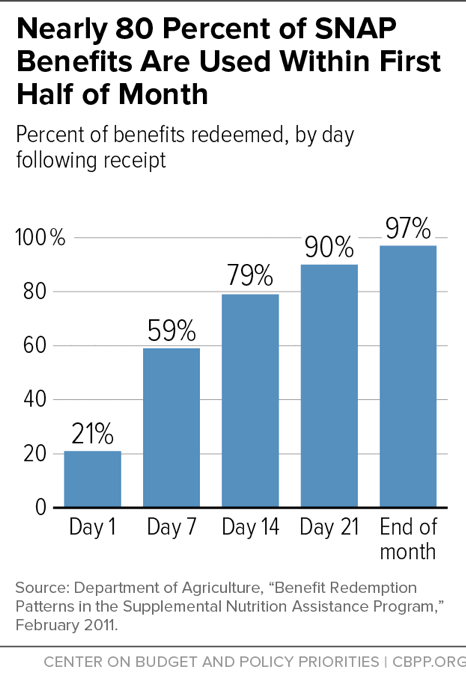
Households spend their benefits quickly and often reduce food consumption by the end of the month. On average, within a week of receiving SNAP, SNAP households redeem over half of their SNAP allotments. By the end of the second week, SNAP households have redeemed over three-quarters of their benefits.[10] More recent research also finds that household food spending declines during the month, from $63 in the first week of the benefit month to $37 on average in the last three weeks. While this spending decline may be due to household choice in food shopping, evidence suggests that many households run out of resources to buy food at the end of the month. Food intake, most often measured as the number of calories consumed, falls off at the end of the benefit month, probably by as much as 10 to 25 percent, studies have shown. The probability of eating less than usual is nearly 17 percentage points higher in the final days of the benefit month.[11]
Part III: SNAP Helps Families Afford Adequate Food, Reduces Poverty
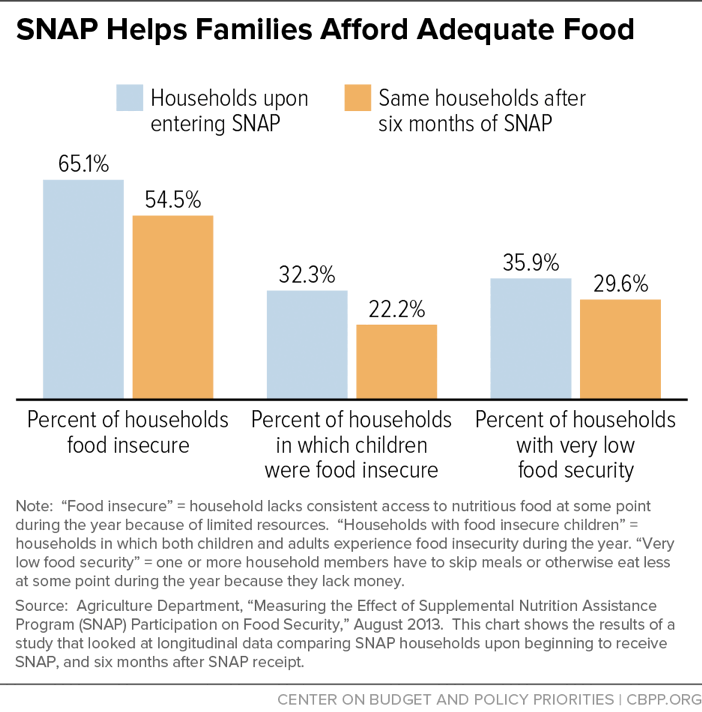
SNAP helps families put enough food on the table. Studies have found that SNAP benefits reduce “food insecurity,” which occurs when households lack consistent access to nutritious food because of limited resources. A study found that participating in SNAP reduced households’ food insecurity by about 5 to 10 percentage points and reduced “very low food security,” which occurs when one or more household members have to skip meals or otherwise eat less because they lack money, by about 5 to 6 percentage points.[12] Because SNAP enables low-income households to spend more on food than their limited budgets would otherwise allow, it helps ensure that they have enough to eat.
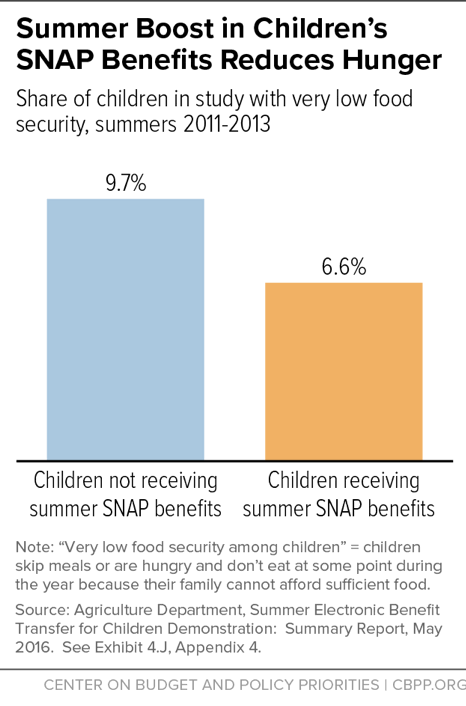
Another study found that providing SNAP benefits over the summer to households with students who had received free or reduced-price school meals during the previous school year cut very low food security among children by nearly one-third, from 9.7 percent to 6.6 percent.[13] (“Very low food security among children” describes a severe form of food insecurity, in which caregivers report that children skip meals or are hungry and don’t eat because their family cannot afford sufficient food.)
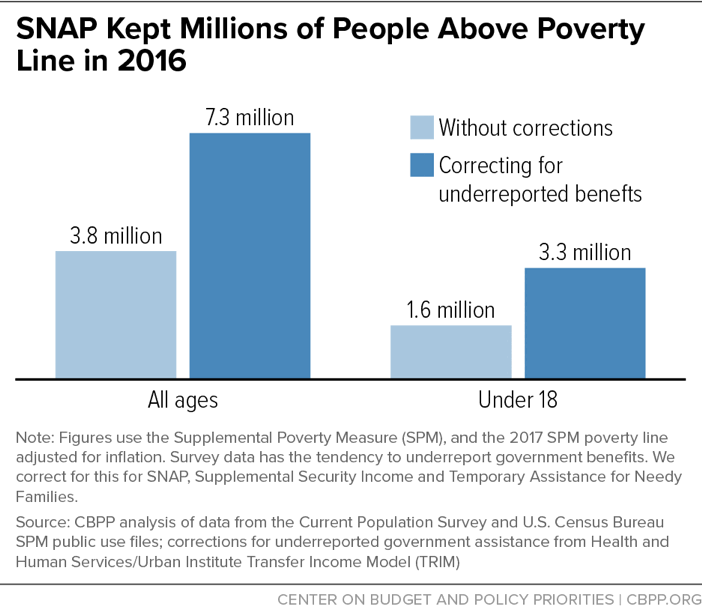
SNAP also lifts millions of households out of poverty. By providing benefits that must be used to purchase food, SNAP is an important part of a low-income household’s budget. In 2016 (the most recent year such data are available), SNAP kept about 7.3 million people out of poverty, including 3.3 million children, according to a CBPP analysis that uses the Supplemental Poverty Measure — which counts SNAP as income — and corrects for households’ underreporting of benefits. This analysis also found that SNAP lifted 1.9 million children out of deep poverty (defined as below 50 percent of the poverty line) in 2016, more than any other government assistance program.
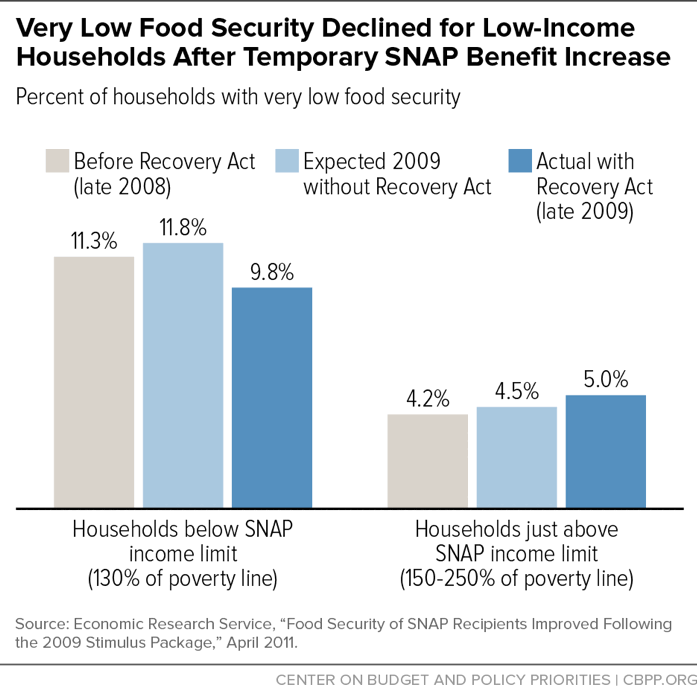
Increasing SNAP benefits can help families afford adequate food. While SNAP is effective at reducing food insecurity, increasing benefits could further reduce food insecurity, evidence suggests. The share of households with food insecurity, including very low food security, was expected to rise in 2009 due to the recession’s harsh impact on incomes and employment. Yet very low food security actually fell that year — the year the Recovery Act’s SNAP benefit increase took effect — among households with incomes low enough to likely qualify for SNAP (130 percent of poverty or less). Among households with somewhat higher incomes, in contrast, very low food security rose in 2009 as expected.[14]
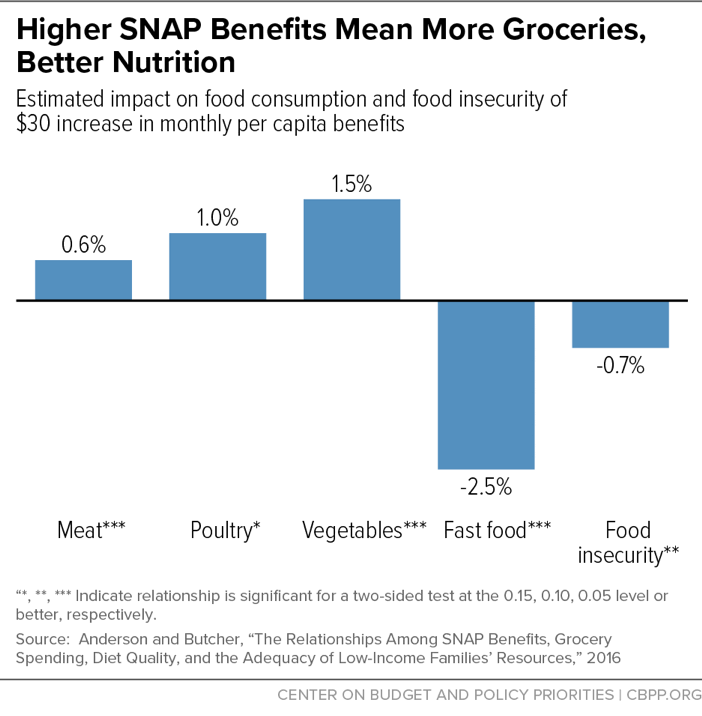
Raising SNAP benefits would increase low-income households’ spending on food and improve the nutritional quality of their diets. A growing body of research documents that SNAP benefits are inadequate to fully meet the nutritional needs of eligible households. A recent study found that if low-income households received an additional $30 per month per person in SNAP benefits (which would be about a 20 percent increase in the cost of the Thrifty Food Plan, the basis for SNAP benefits), their food spending would rise by about $19 per person, based on the food spending patterns of households with somewhat more resources.[15] (Food spending would rise by less than the SNAP benefit increase, even though SNAP can be spent only on food, because the added benefits would free up household income for other necessities such as utility bills or non-food groceries that SNAP doesn’t cover.) That increase in food spending, in turn, would raise consumption of more nutritious foods; notably vegetables and certain healthy sources of protein (such as poultry and fish), and lower consumption of fast food, for example. The increased food spending also would reduce food insecurity among SNAP recipients.[16]
Part IV: SNAP Is Linked With Improved Health Outcomes
The stress that food-insecure families face because they can’t consistently put healthy food on the table, along with the health effects of unpredictable or intermittent meals, may contribute to a higher risk of chronic conditions and other adverse health outcomes. Because SNAP reduces food insecurity and associated stress and frees up income for households to buy healthier food and spend more on health, SNAP may be a path toward better health.
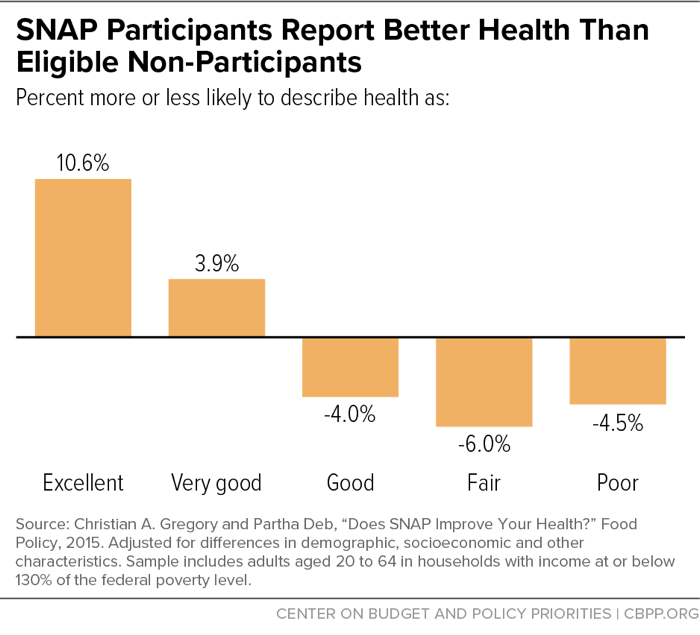
Research links SNAP with several improved health outcomes. After adjusting for differences in demographic, socioeconomic, and other characteristics, adults who participate in SNAP are more likely to assess their own health as excellent or very good, as are parents when assessing their child’s health. Adults who receive SNAP have fewer sick days, make fewer visits to a doctor, are less likely to forgo needed care because they cannot afford it, and are less likely to exhibit psychological distress. Other researchers have shown that children receiving SNAP are less likely than low-income non-participants to be in fair or poor health or underweight, and their families are less likely to make tradeoffs between paying for health care and paying for other basic needs, like food, housing, heating, and electricity. Research has also shown that elderly SNAP participants are less likely than similar non-participants to cut back on prescribed medications due to cost.
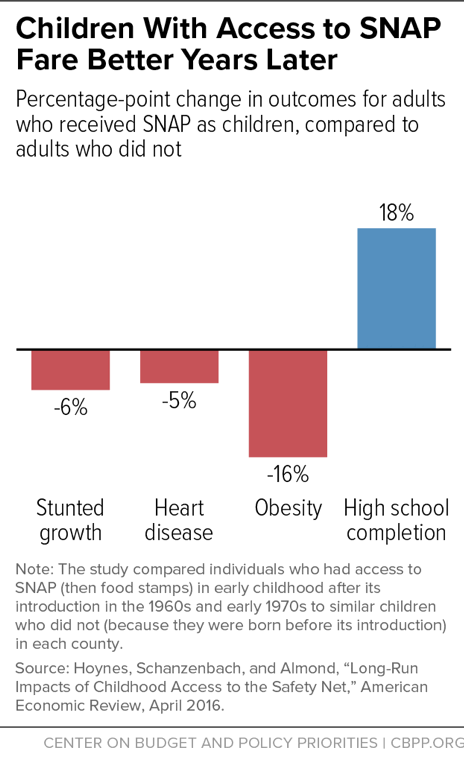
Access to SNAP can improve health and educational outcomes. Researchers comparing the long-term outcomes of individuals in different areas of the country when SNAP gradually expanded nationwide in the 1960s and early 1970s found that disadvantaged children who had access to food stamps (as they were then called) in early childhood and whose mothers had access during their pregnancy had better health and educational outcomes as adults than children who didn’t have access to food stamps.
Among other things, children with access to food stamps were less likely in adulthood to have stunted growth, be diagnosed with heart disease, or be obese. They also were more likely to graduate from high school. [17]
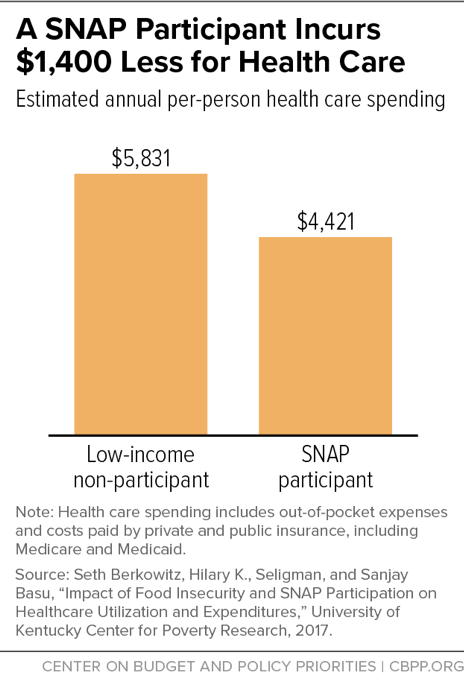
SNAP participation is also linked with lower overall health care expenditures. An analysis of national data on overall health care expenditures links SNAP participation to lower health care costs. On average, after controlling for factors expected to affect spending on medical care, low-income adults participating in SNAP incur about $1,400, or nearly 25 percent, less than non-participants in medical care costs in a year, including those paid by private or public insurance.[18]
Part V: SNAP Serves Very Vulnerable People
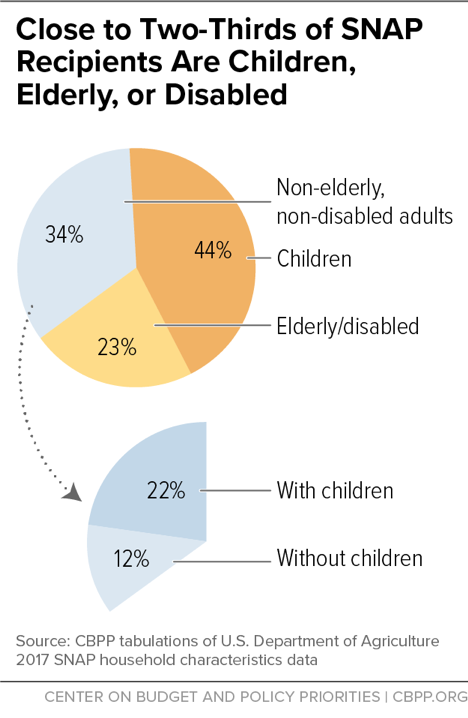
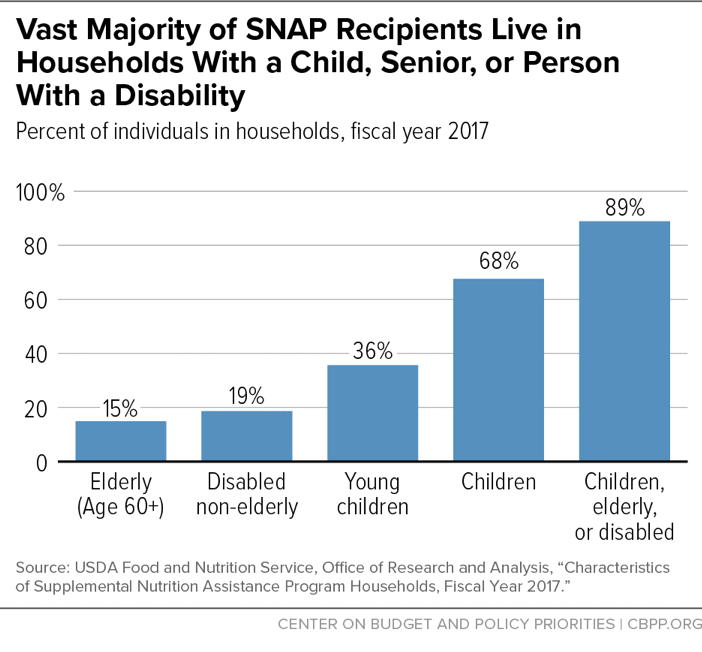
The overwhelming majority of SNAP participants are children, seniors, or people with disabilities. Close to half of all participants are children, and over half of all non-elderly, non-disabled adult participants live with children.
SNAP serves particularly vulnerable families. Nearly 90 percent of participants are in households that contain a child under age 18, an elderly person 60 years or older, or an individual with disabilities.
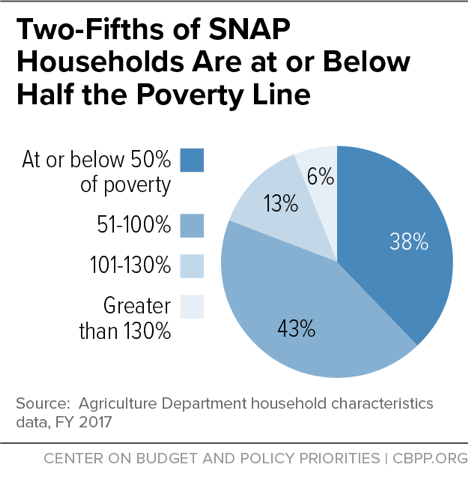
SNAP households have very low incomes. Over 80 percent of SNAP households have gross incomes at or below the poverty line, used to calculate SNAP benefits ($21,330 for a family of three in fiscal year 2020, and $12,490 for a person living alone, such as an elderly widow), while they are receiving SNAP. Most of the rest have incomes between 101 and 130 percent of poverty. Two of every five SNAP households have incomes at or below half of the poverty line (about $10,668 for a family of three in fiscal year 2020).
Some 92 percent of SNAP benefits go to households below the poverty line; 55 percent go to households with incomes at or below half of the poverty line.
Part VI: SNAP Supports Working Families and Those Unable to Work
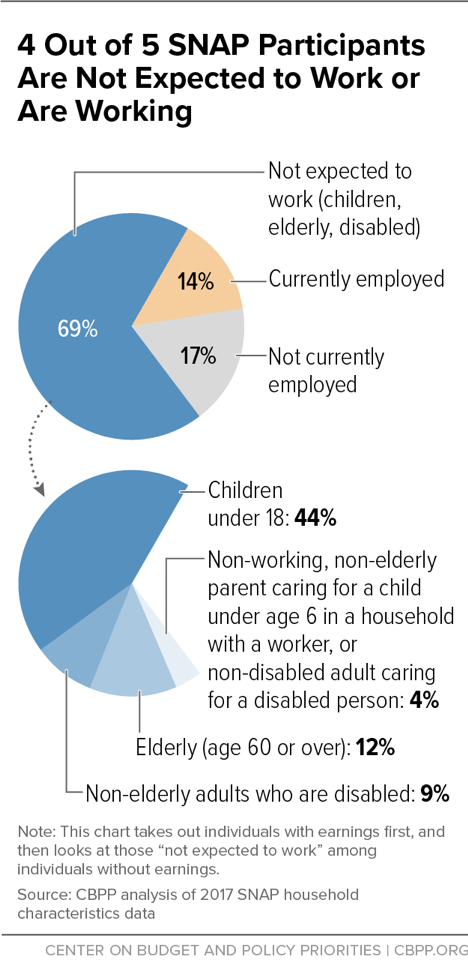
Most SNAP participants either aren’t expected to work or are working. In a typical month of 2017, 69 percent of SNAP recipients weren’t expected to work because they were children, elderly, disabled, or caring for a disabled family member in their home or for a child under age 6 where another household member was working. Children under age 18 constitute nearly half (44 percent) of all SNAP participants.
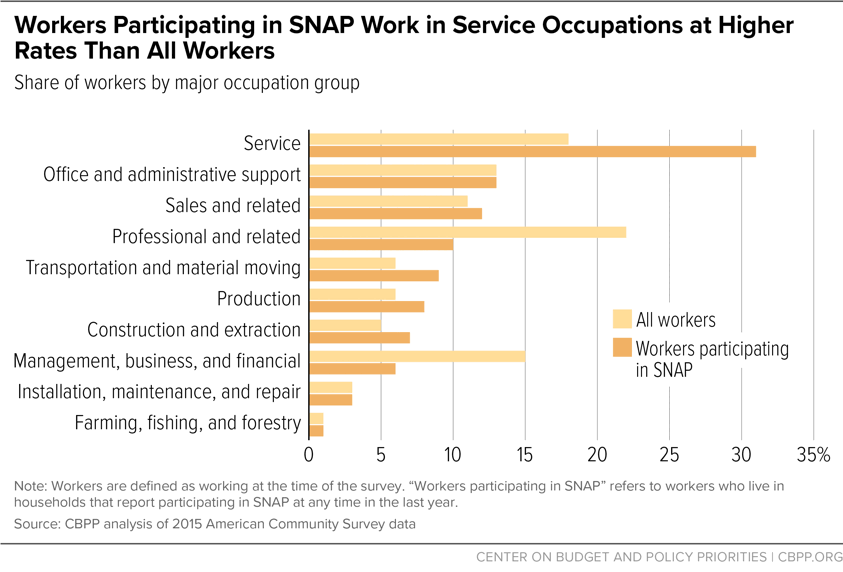
SNAP supports workers in low-paying jobs. Close to two-thirds of working SNAP participants work in service, office and administrative support, and sales occupations. Many of the jobs most common among SNAP participants, such as service or sales jobs like cashiers, cooks, or home health aides, likely have low pay and irregular work hours, and frequently lack benefits such as paid sick leave. These conditions make it difficult for workers to earn sufficient income to provide for their families and may contribute to volatility such as high job turnover. SNAP supplements these workers’ low pay, helps smooth out income fluctuations due to irregular hours, and helps workers when they are between jobs, enabling them to buy food and use their limited resources on other basic necessities.
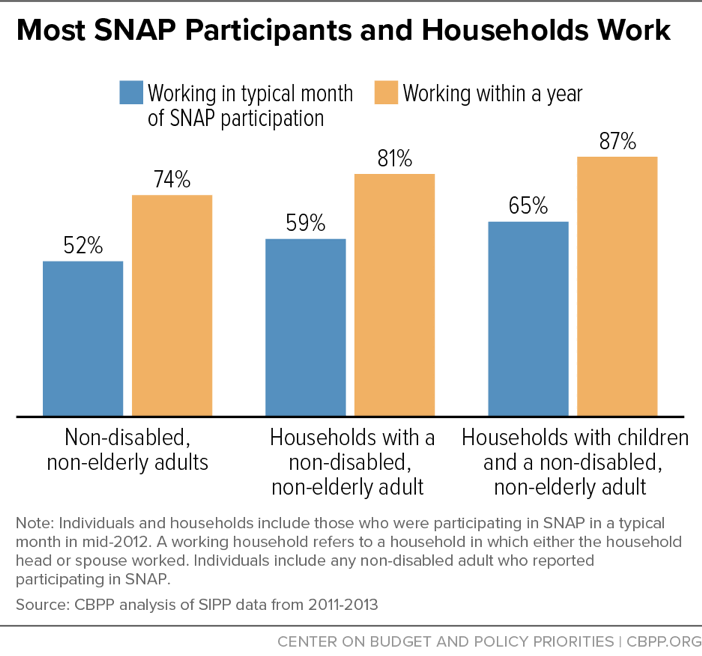
Most SNAP participants work, and many turn to SNAP when they are between jobs. The low pay and instability in many low-wage jobs can contribute to income volatility and job turnover: low-wage workers, including many who participate in SNAP, are more likely than other workers to experience periods when they are out of work or when their monthly earnings drop, at least temporarily. These dynamics lead many adults to participate in SNAP temporarily, often while between jobs or when their work hours are cut. Others, such as workers with steady but low-paying jobs or those unable to work, participate longer term. A CBPP analysis of employment and SNAP participation trends found that among non-disabled adults participating in SNAP in a typical month in mid-2012, 52 percent worked in that month, but about 74 percent worked at some point in the year before or after that month (a period of 25 months). The increased work rate over time demonstrates that joblessness is often a temporary condition for SNAP participants.[19]
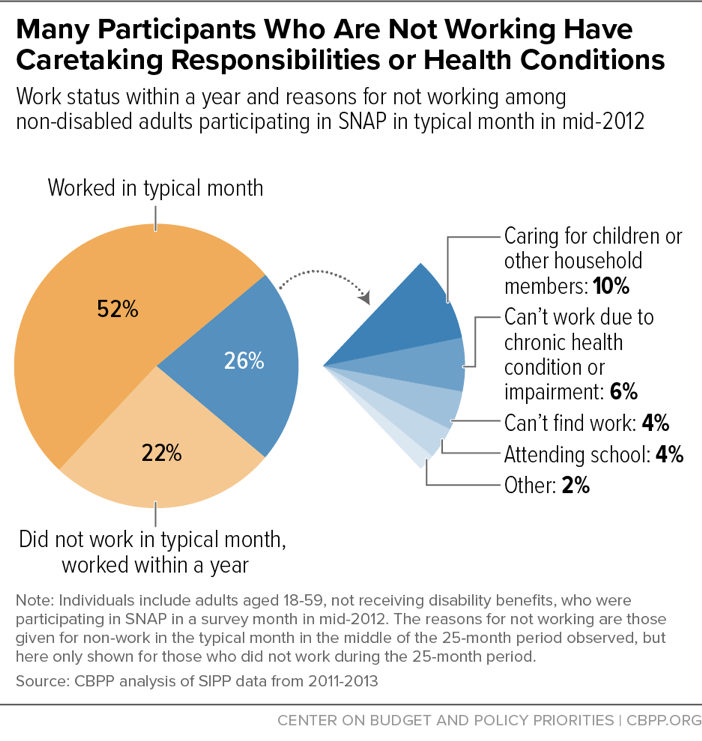
Many SNAP participants who are not working in a typical month while they are participating in SNAP have recently worked or will soon work, or have caregiving responsibilities or face barriers to work. The CBPP analysis also found that of those adults who were not working in the month studied, close to half worked in either the year before or the year after that month. Many people participate in SNAP while between jobs and continue to work in most months when receiving SNAP. Those who did not work over the 25-month period studied most frequently reported they had caregiving responsibilities, had health issues that affected their ability to work, couldn’t find work, or were attending school.
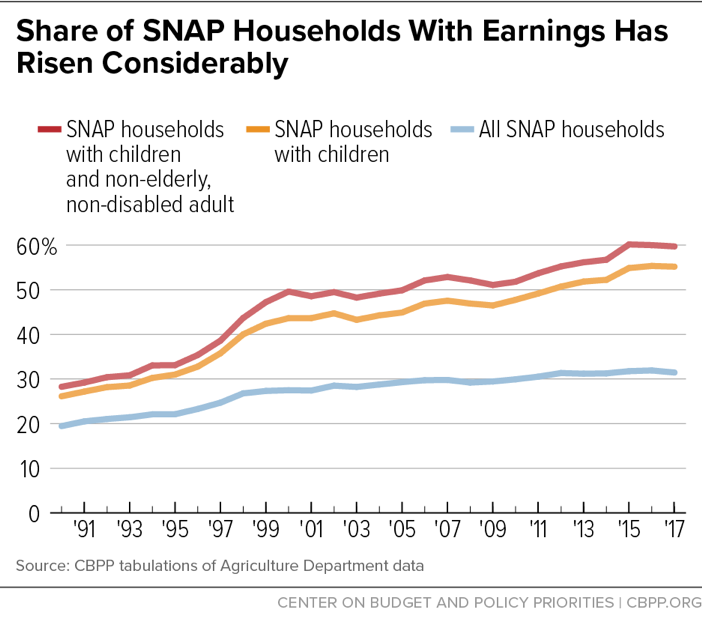
The share of SNAP households that work in an average month while receiving SNAP has grown over the past three decades. Work rates have risen among all households, but especially among households with children. This overall trend continued despite the large job losses in the Great Recession.
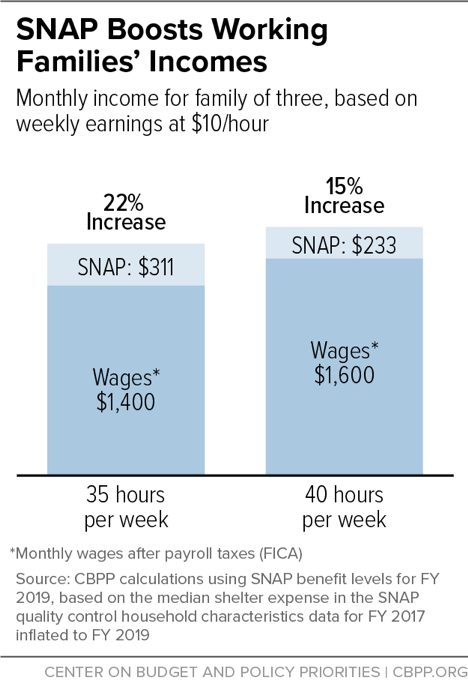
SNAP helps working families make ends meet. For a family of three with one full-time worker who earns $10 an hour, SNAP boosts the family’s take-home income by roughly 15 to 22 percent, depending on the number of hours worked. For instance, a mother with two children who works 35 hours a week increases her monthly income by 22 percent when adding her SNAP benefits.
SNAP encourages work. The SNAP benefit formula contains an important work incentive: for every additional dollar a SNAP recipient earns, her SNAP benefits decline by only 24 to 36 cents. The benefit formula favors earned income over unearned income through its income deduction. Consequently, families that receive SNAP have a strong incentive to work more hours or search for better-paying jobs.
Part VII: SNAP Reaches Most Eligible People, With Some Important Exceptions
SNAP participation rates are high and have risen in the past decade, reflecting increased need, improved enrollment policies, and outreach efforts. SNAP reached 84 percent of eligible individuals in a typical month in 2017 (the most recent year available). That represents a significant improvement from 2001, when participation bottomed out at 54 percent. Among eligible individuals in low-income working families, participation rose from 43 percent to 73 percent between 2002 and 2017. Participation rates among seniors, who are underserved in SNAP, have risen from 26 percent in 2002 to 48 percent in 2017.
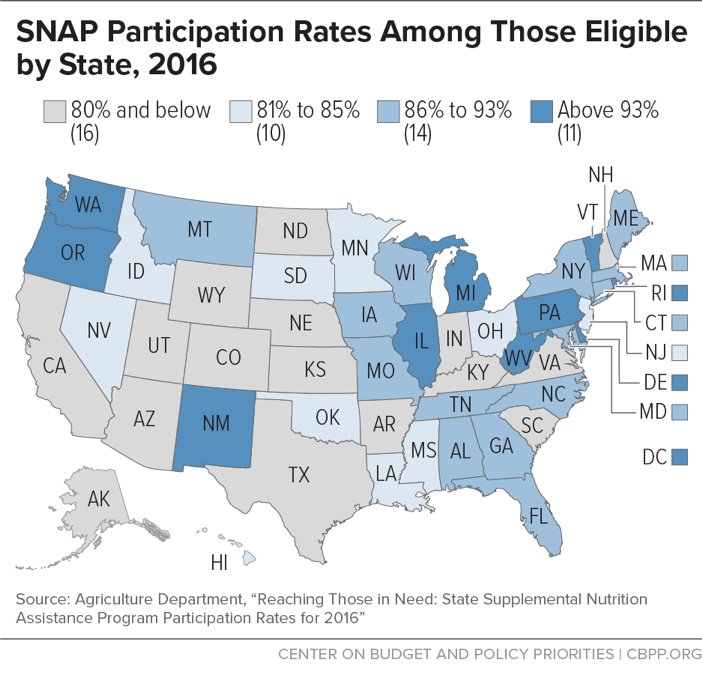
Participation rates vary widely by state. Some states serve a high percentage of eligible households, such as New Mexico, Oregon, Rhode Island, and Vermont. Others serve a relatively low percentage, such as Alaska, North Dakota, Utah, and Wyoming. In every state, however, more than 50 percent of eligible individuals participate.
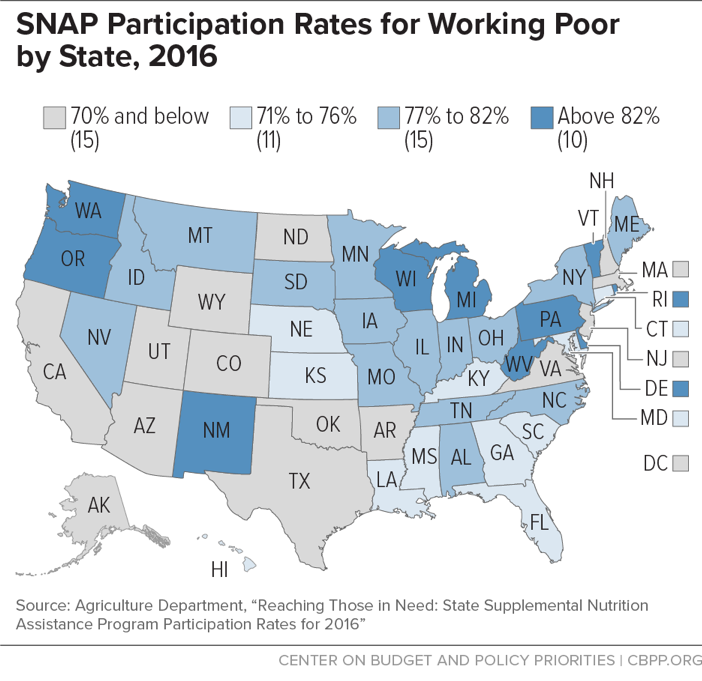
The working poor are underserved in many states. Even though SNAP provides an important support for the working poor, this population is often particularly hard to reach. In 2016, 75 percent of the eligible working poor participated. In 40 states and the District of Columbia, individuals in working-poor households participated at a lower rate than all eligible individuals nationally.
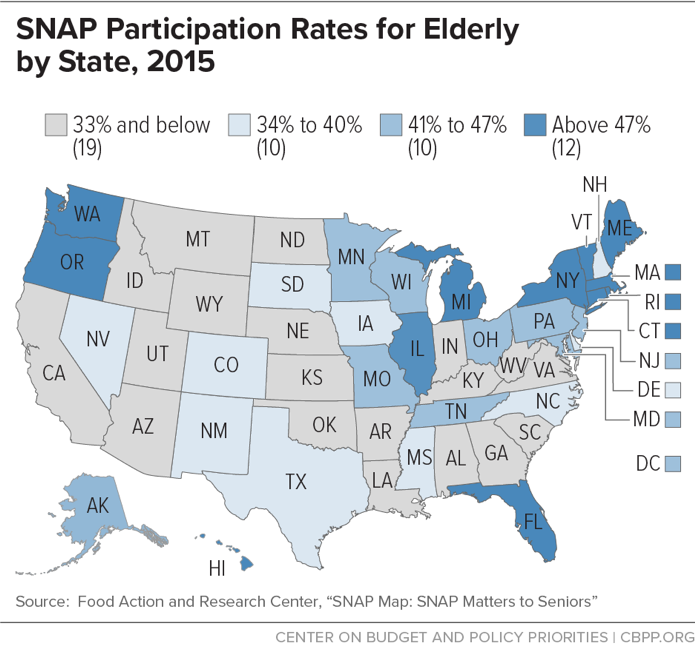
Seniors are underserved. Many low-income seniors who struggle to get by on low, fixed incomes and have critical unmet dietary needs don’t participate in SNAP. Only 48 percent of eligible individuals over age 60 participated in 2017 nationwide, though participation rates have risen modestly in recent years.
The participation rate among eligible seniors varies across states. In 2015, the most recent year for which state-level estimates are available, state-level participation rates ranged from under 20 percent to over 60 percent.[20]
Part VIII: SNAP Is Efficient
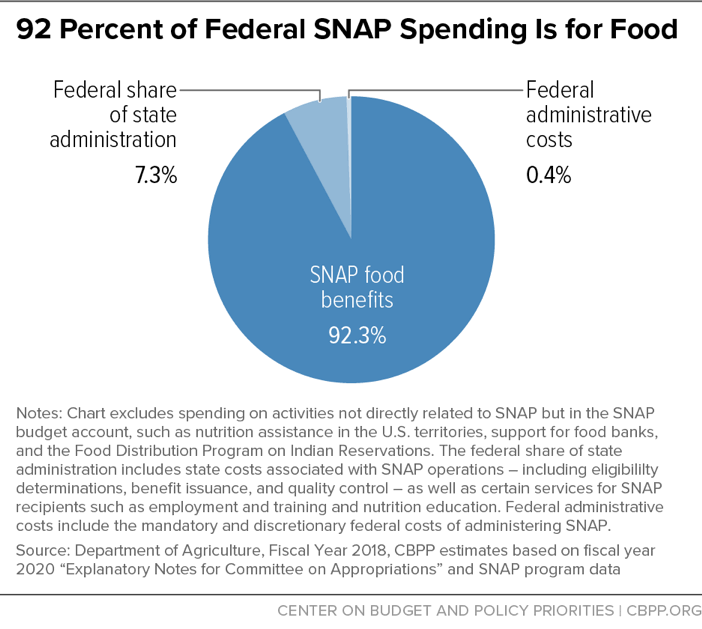
About 92 percent of federal SNAP spending goes for benefits to purchase food. The rest goes toward administrative costs, including reviews to determine that applicants are eligible, monitoring of retailers that accept SNAP, and anti-fraud activities.
The federal government spent about $68 billion on SNAP in fiscal year 2018. This also includes funding for other food assistance programs, such as the block grant for food assistance in Puerto Rico and American Samoa, commodity purchases for the Emergency Food Assistance Program (which helps food pantries and soup kitchens), and commodities for the Food Distribution Program on Indian Reservations. (In 2018 Puerto Rico received an additional $1.27 billion for disaster nutrition assistance after Hurricane Maria.)
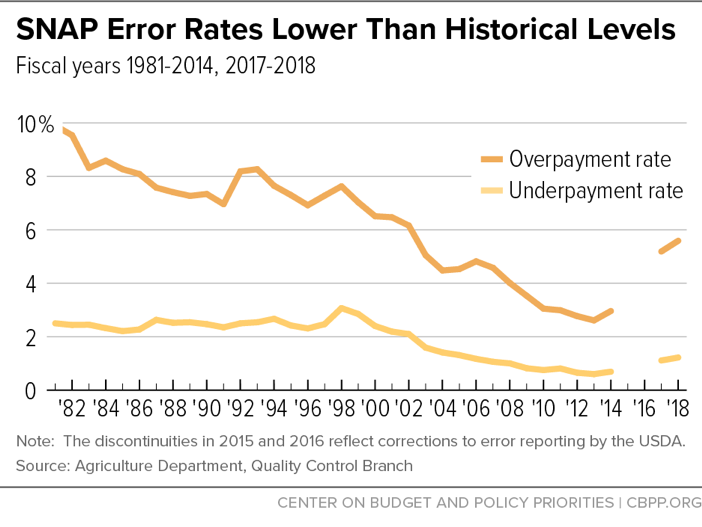
SNAP has an extensive quality control system. SNAP has one of the most rigorous payment error measurement systems of any public benefit program. Each year, states pull a representative sample (totaling about 50,000 cases nationally) and thoroughly review the accuracy of their eligibility and benefit decisions. Federal officials re-review a subsample of the cases to ensure accuracy in the error rate they assign each state. States face financial penalties if their error rates are persistently above the national average.
A USDA Office of Inspector General Report in 2015 drew attention to concerns about data quality issues with SNAP Quality Control error rates in many states. As a result, USDA did not report national or state-level error rates for all states for 2015 or 2016. During this time USDA conducted detailed reviews in all states and took action to address the quality and consistency of the measure. The corrected SNAP error rates for 2017 and 2018 are nearly double the rates published in 2014, an increase which USDA indicated was the result of the improved measurement process, but still remain below historical levels. The national “combined error rate,” which adds together the overpayment and underpayment error rate, was 6.8 percent in 2018, and USDA noted that it is working with states to continue improving their error rates.[21] Only states with combined error rates above 6 percent currently are subject to fiscal penalties, and prior to 2003, 6 percent was the standard for enhanced funding for outstanding performance, which shows how low the adjusted rates are compared to historical rates.
Part IX: SNAP Is an Important Public-Private Partnership
SNAP boosts local economies. Because most households redeem their monthly SNAP benefits quickly, SNAP is one of the most effective forms of economic stimulus during a downturn. A recent USDA study estimated that every dollar in new SNAP benefits spent during a slowing economy would increase the gross domestic product by $1.54, and previous studies have estimated this effect to be as high as $1.80 for every new dollar in SNAP benefits during a recession. In addition, the increase in SNAP benefits has the largest effects on spending for food and durable goods, and on income and jobs in industries such as manufacturing, trade, and transportation.[22] Another study on SNAP’s effect on employment confirm that it is an important stimulus to local economies during recessionary periods. The study indicates that SNAP benefit redemptions provided a greater boost to employment during recessionary periods than during economic expansions. In addition, the researchers found that the impact on rural employment is greater: during the 2008 recession, SNAP benefits boosted employment in non-metropolitan (rural) counties by 1 job per $10,000 in benefits redeemed, compared to 0.4 jobs in metropolitan (urban) counties. Furthermore, SNAP benefits had a greater impact on employment during the recession than payments from all the other federal and state government transfer programs combined.[23]
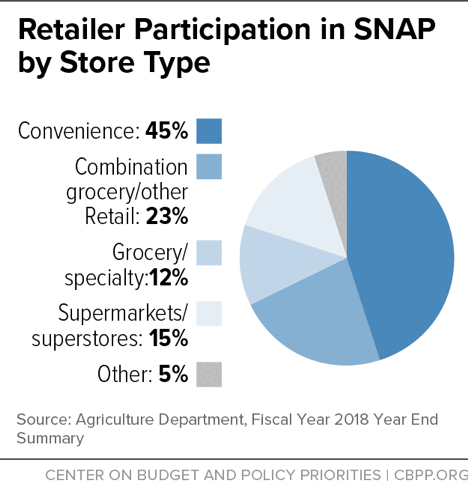
Food stores can participate in SNAP if they stock a prescribed variety of foods and provide adequate information on the nature and scope of their business. This ensures that SNAP participants can redeem benefits in many of the stores and settings available to other consumers, though some geographic areas have few or no authorized retailers. Participating retailers include superstores (like Walmart), supermarkets, grocery stores, corner stores, and farmers’ markets. Convenience stores are the largest single category, representing nearly half of all SNAP retailers. Stores that combine grocery and other retail store formats represent nearly a quarter of all SNAP retailers. Farmers’ markets, commissaries, wholesalers, food co-operatives, and meal service facilities comprise about 5 percent.
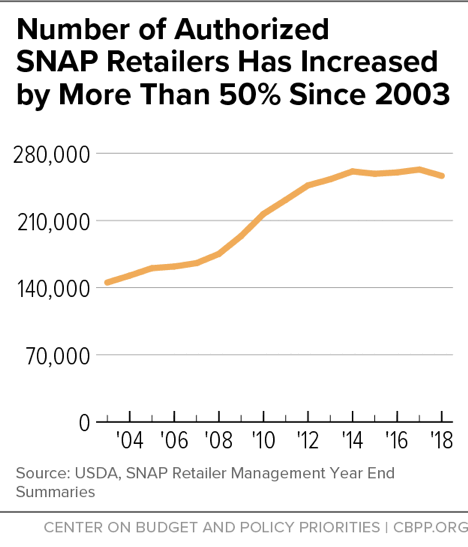
The number of SNAP retailers has risen considerably. In 2018 about 256,000 retailers were authorized to accept SNAP benefits — 77 percent more than in 2003, though this growth has flattened in recent years.
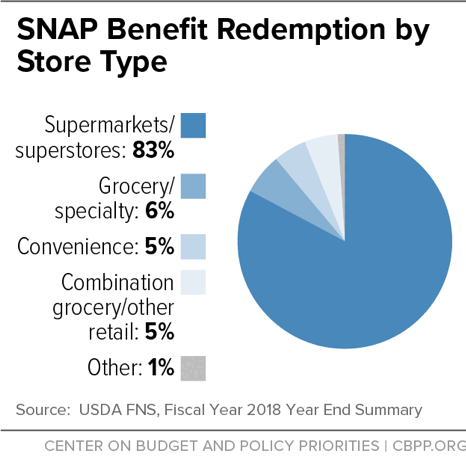
SNAP households spend most of their benefits at supermarkets and superstores. Participants redeem over 80 percent of their benefits at superstores (such as warehouse clubs and big-box retailers) and supermarkets, even though these stores make up only 15 percent of all available retailers. Superstores alone redeem over half of all benefits.
While nearly half of SNAP retailers are convenience stores, they are a minor source of food for participants, redeeming only 5 percent of SNAP benefits.
End Notes
[1] The U.S. Agriculture Department (USDA) reports that 39.7 million individuals participated in SNAP in an average month of 2018. This figure understates SNAP participation by approximately 1 million individuals, however, because it excludes data for Rhode Island in all months and for North Carolina in most months of the year. These states have temporarily stopped reporting SNAP participation data. See https://www.fns.usda.gov/pd/supplemental-nutrition-assistance-program-snap.
[2] Jessica Semega et al., “Income and Poverty in the United States: 2018,” U.S. Census Bureau, September 2019, https://www.census.gov/library/publications/2019/demo/p60-266.html.
[3] Alisha Coleman-Jensen et al., “Household Food Security in the United States in 2018,” Economic Research Service, USDA, September 2019, https://www.ers.usda.gov/publications/pub-details/?pubid=94848.
[4] U.S. Department of Agriculture, “Trends in Supplemental Nutrition Assistance Program Participation Rates: Fiscal Year 2010 to Fiscal Year 2017,” September 2019, https://fns-prod.azureedge.net/sites/default/files/resource-files/Trends2010-2017.pdf.
[5] Peter Ganong and Jeffrey B. Liebman, “The Decline, Rebound, and Further Rise in SNAP Enrollment: Disentangling Business Cycle Fluctuations and Policy Changes,” American Economic Journal: Economic Policy, Vol. 10, No. 4, November 2018, pp.153-176, https://www.aeaweb.org/articles?id=10.1257/pol.20140016&&from=f; James P. Ziliak, “Why Are So Many Americans on Food Stamps?” in J. Bartfeld et al., eds., SNAP Matters: How Food Stamps Affect Health and Well Being, Stanford University Press, 2015; Marianne Bitler and Hilary Hoynes, “The More Things Change, the More They Stay the Same? The Safety Net and Poverty in the Great Recession,” Journal of Labor Economics, Vol. 34, Issue S1, 2016; and Jacob Alex Klerman and Caroline Danielson, “Can the Economy Explain the Explosion in the Supplemental Nutrition Assistance Program? An Assessment of the Local-Level Approach,” American Journal of Agricultural Economics, 2016.
[6] Dottie Rosenbaum and Brynne Keith-Jennings, “SNAP Caseload and Spending Declines Have Accelerated in Recent Years,” Center on Budget and Policy Priorities, June 6, 2019, https://www.cbpp.org/research/food-assistance/snap-caseload-and-spending-declines-have-accelerated-in-recent-years.
[7] Ibid.
[8] Ibid.
[9] U.S. Department of Agriculture, “SNAP Data Tables,” September 2019, https://www.fns.usda.gov/pd/supplemental-nutrition-assistance-program-snap.
[10] U.S. Department of Agriculture, “Benefit Redemption Patterns in the Supplemental Nutrition Assistance Program,” February 2011, https://fns-prod.azureedge.net/sites/default/files/ARRASpendingPatterns.pdf.
[11] Laura Tiehen, Constance Newman, and John Kirlin, “The Food-Spending Patterns of Households Participating in the Supplemental Nutrition Assistance Program: Findings From USDA’s FoodAPS,” USDA Economic Research Service, August 2017, https://www.ers.usda.gov/webdocs/publications/84780/eib-176.pdf?v=42962.
[12] U.S. Department of Agriculture, “Measuring the Effect of Supplemental Nutrition Assistance Program (SNAP) Participation on Food Security,” August 2013, https://www.fns.usda.gov/measuring-effect-snap-participation-food-security-0.
[13] U.S. Department of Agriculture, “Summer Electronic Benefit Transfer for Children (SEBTC) Demonstration: Summary Report,” May 2016, https://fns-prod.azureedge.net/sites/default/files/ops/sebtcfinalreport.pdf.
[14] Mark Nord and Mark Prell, “Food Security of SNAP Recipients Improved Following the 2009 Stimulus Package,” Economic Research Service, USDA, June 2011, https://www.ers.usda.gov/amber-waves/2011/june/food-security-of-snap/.
[15] Patricia Anderson and Kristin Butcher, “The Relationships Among SNAP Benefits, Grocery Spending, Diet Quality, and the Adequacy of Low-Income Families’ Resources,” June 2016, https://www.cbpp.org/research/food-assistance/the-relationships-among-snap-benefits-grocery-spending-diet-quality-and-the.
[16] Steven Carlson, “More Adequate SNAP Benefits Would Help Millions of Participants Better Afford Food,” Center on Budget and Policy Priorities, July 30, 2019, https://www.cbpp.org/research/food-assistance/more-adequate-snap-benefits-would-help-millions-of-participants-better.
[17] Hilary Hoynes, Diane Whitmore Schanzenbach, and Douglas Almond, “Long-Run Impacts of Childhood Access to the Safety Net,” American Economic Review, Vol. 106, No. 4 (April 2016), pp. 903–934, https://gspp.berkeley.edu/assets/uploads/research/pdf/Hoynes-Schanzenbach-Almond-AER-2016.pdf.
[18] Seth Berkowitz, Hilary K. Seligman, and Sanjay Basu, “Impact of Food Insecurity and SNAP Participation on Healthcare Utilization and Expenditures,” University of Kentucky Center for Poverty Research Discussion Paper Series, DP2017-02, 2017, http://uknowledge.uky.edu/cgi/viewcontent.cgi?article=1105&context=ukcpr_papers.
[19] Brynne Keith-Jennings and Raheem Chaudhry, “Most Working-Age SNAP Participants Work, But Often in Unstable Jobs,” Center on Budget and Policy Priorities, March 15, 2018, https://www.cbpp.org/research/food-assistance/most-working-age-snap-participants-work-but-often-in-unstable-jobs.
[20] Food Research and Action Center, “SNAP Map: SNAP Matters to Seniors,” https://www.frac.org/research/resource-library/snap-map-snap-matters-to-seniors.
[21] U.S. Department of Agriculture, “Supplemental Nutrition Assistance Program: Payment Error Rates, Fiscal Year 2018,” July 2019, https://fns-prod.azureedge.net/sites/default/files/resource-files/FY18-SNAP-QC-Payment-Error-Rate-Chart.pdf.
[22] Patrick Canning and Brian Stacy, “The Supplemental Nutrition Assistance Program (SNAP) and the Economy: New Estimates of the SNAP Multiplier,” Economic Research Service, USDA, July 2019, https://www.ers.usda.gov/webdocs/publications/93529/err-265.pdf?v=8010.7.
[23] John Pender et al., “The Impacts of Supplemental Nutrition Assistance Program Redemptions on County-Level Employment,” Economic Research Service, USDA, May 2019, https://www.ers.usda.gov/webdocs/publications/93169/err-263.pdf?v=1509.3.
