The 2017 Trump Tax Law Was Skewed to the Rich, Expensive, and Failed to Deliver on Its Promises
A 2025 Course Correction Is Needed
A high-stakes tax policy debate will accelerate this year through 2025 over the pending expiration of the individual income and estate tax provisions of the 2017 Trump tax law. Policymakers should use this opportunity to work toward a tax code that raises more revenues, is more progressive and equitable, and supports investments that make the economy work for everyone.
As this debate unfolds, policymakers and the public should understand that the 2017 Trump tax law:
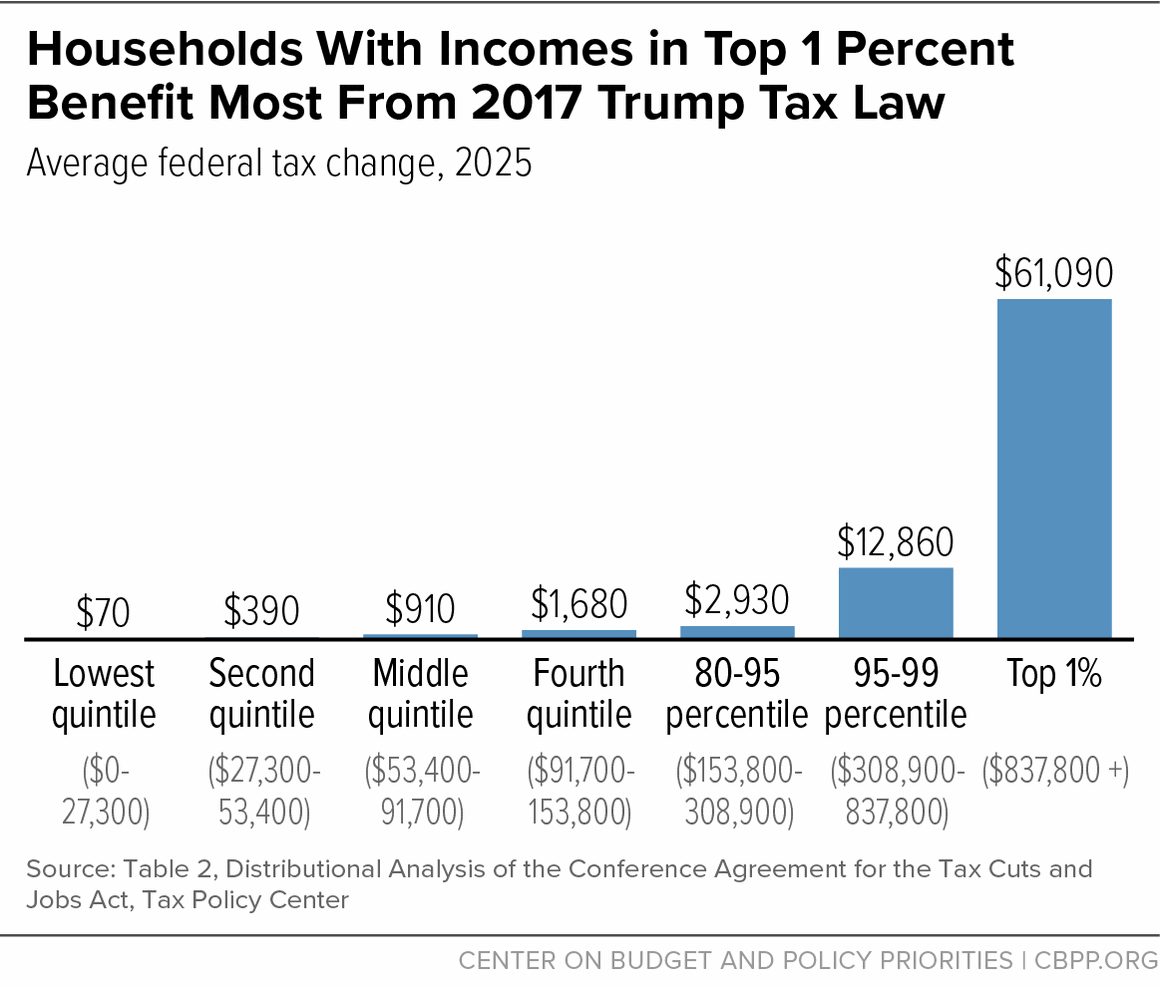
- Was skewed to the rich. Households with incomes in the top 1 percent will receive an average tax cut of more than $60,000 in 2025, compared to an average tax cut of less than $500 for households in the bottom 60 percent, according to the Tax Policy Center (TPC).[1] As a share of after-tax income, tax cuts at the top — for both households in the top 1 percent and the top 5 percent — are more than triple the total value of the tax cuts received for people with incomes in the bottom 60 percent.[2]
- Was expensive and eroded the U.S. revenue base. The Congressional Budget Office (CBO) estimated in 2018 that the 2017 law would cost $1.9 trillion over ten years,[3] and recent estimates show that making the law’s temporary individual income and estate tax cuts permanent would cost another roughly $350 billion a year beginning in 2027.[4] Together with the 2001 and 2003 tax cuts enacted under President Bush (most of which were made permanent in 2012), the law has severely eroded our country’s revenue base. Revenue as a share of GDP has fallen from about 19.5 percent in the years immediately preceding the Bush tax cuts to just 16.3 percent in the years immediately following the Trump tax cuts, with revenues expected to rise to an annual average of 16.9 percent of GDP in 2018-2026 (excluding pandemic years), according to CBO. This is simply not enough revenue given the nation’s investment needs and our commitments to Social Security and health coverage.
- Failed to deliver promised economic benefits. Trump Administration officials claimed their centerpiece corporate tax rate cut would “very conservatively” lead to a $4,000 boost in household income.[5] New research shows that workers who earned less than about $114,000 on average in 2016 saw “no change in earnings” from the corporate tax rate cut, while top executive salaries increased sharply.[6] Similarly, rigorous research concluded that the tax law’s 20 percent pass-through deduction, which was skewed in favor of wealthy business owners, has largely failed to trickle down to workers in those companies who aren’t owners.[7] Like the Bush tax cuts before it,[8] the 2017 Trump tax cut was a trickle-down failure.
Policymakers should seize the opportunity the 2025 expirations provide and make a course correction in the nation’s revenue policies. This would mean reversing the regressive tilt of the 2017 law, raising more revenue, and correcting priorities to advance the interests of low- and moderate-income families across the country instead of those of wealthy shareholders. Several key principles should guide this new course:
- Tax cuts for people making over $400,000 should end on schedule. The 2017 law’s provisions primarily benefiting high-income households are costly and do not trickle down. They should all end in 2025.
- The tax system needs to raise more revenues from wealthy people and profitable corporations to offset any tax cuts extended or expanded for those with incomes below $400,000, to finance high-value investments in people and communities, and to improve our fiscal outlook. President Biden’s prior budgets have proposed raising progressive revenue to pay for extensions of provisions affecting households with earnings below $400,000. This should include revisiting the 2017 law’s permanent and deeply unpopular corporate tax rate cut and strengthening the law’s international corporate tax provisions, which continue to allow significant foreign profit-shifting. New progressive tax policies should also reduce the tax advantages for wealthy people by, for example, curtailing their ability to permanently avoid taxes on their large unrealized capital gains and rolling back the special breaks they receive when they do pay tax. Policymakers can also generate progressive revenues by extending and making permanent the mandatory IRS funding enacted in the Inflation Reduction Act, which supports revenues by increasing tax collections primarily from high-income households.
- Top priorities for extending and expanding tax provisions in 2025 should be the Child Tax Credit, the Earned Income Tax Credit (EITC) for adults not raising children, and the enhanced premium tax credits for Affordable Care Act (ACA) marketplace coverage. These credits have a long history of success — in stark contrast to the record of failure of the corporate tax rate cut and other regressive tax cuts. This includes a marked drop in the child poverty rate in 2021 under the American Rescue Plan’s expansion of the Child Tax Credit — a policy that should be made permanent in 2025. Additionally, some 16 million people who work for low wages and who are not raising children in their homes received help through the Rescue Plan’s EITC expansion in 2021, and there were historic gains in the number of people receiving health coverage in the ACA marketplaces during the 2024 open enrollment season, with most enrollees able to find coverage for less than $10 per month. Revenues also can be used for investments outside of the tax code. For example, the costs of child care, home-based care for older adults and people with disabilities, and housing remain unacceptably high for millions of families, and federal investment in these areas falls far short of need.
2017 Trump Tax Law Was Skewed to the Top
Like the Bush tax cuts that came before it,[9] the 2017 tax law benefited high-income households far more than households with low and moderate incomes. Extending the Trump tax cuts that expire at the end of 2025 — namely, the law’s individual income and estate tax provisions — would provide further windfall benefits to high-income households. These cuts would come on top of the large benefits they would continue to receive from the 2017 tax law’s permanent provisions.
2017 Law Created New Tax Advantages for Wealthy People and Profitable Corporations
The law will boost the after-tax incomes of households in the top 1 percent by 2.9 percent in 2025, roughly three times the 0.9 percent gain for households in the bottom 60 percent, TPC estimates.[10] The tax cuts that year will average $61,090 for the top 1 percent — and $252,300 for the top one-tenth of 1 percent. (See Figure 1.) The 2017 law also widens racial disparities in after-tax income.[11]
The 2017 tax law’s tilt to the top reflects several costly provisions that primarily benefit the most well-off:
- Large, permanent corporate tax cuts. The centerpiece of the law was a deep, permanent cut in the corporate tax rate — from 35 percent to 21 percent — and a shift toward a territorial tax system, which exempts certain foreign income of multinational corporations from tax.
- 20 percent deduction for pass-through income. The law adopted a new 20 percent deduction for certain income that owners of pass-through businesses (partnerships, S corporations, and sole proprietorships) report on their individual tax returns, which previously was generally taxed at the same rates as wage and salary income.[12]
- Cutting individual income tax rates for those at the top and weakening the alternative minimum tax (AMT). The law cut the top individual income tax rate from 39.6 percent to 37 percent for married couples with over $600,000 in taxable income (and often even higher gross income). The law also dramatically weakened the AMT, which was designed to ensure that higher-income people who take large amounts of deductions and other tax breaks pay at least a minimum level of tax. The law made far fewer households subject to the AMT and typically made those still subject to the provision pay far less,[13] delivering another sizable tax cut to many affluent households.
- Doubling the estate tax exemption. The law doubled the amount that the wealthiest households can pass on tax-free to their heirs, from $11 million per married couple to $22 million (indexed for inflation).
The law’s expiring provisions included some provisions affecting families with low and moderate incomes, but often in offsetting ways. For example, the law lowered statutory tax rates at all income levels, nearly doubled the size of the standard deduction from $13,000 to $24,000 for a married couple in 2018, and doubled the size of the Child Tax Credit for many families.[14] Yet other provisions raised taxes on families, such as the elimination of personal exemptions and the new, permanent inflation adjustment for key tax parameters.[15] The end result of these offsetting changes is only modest tax cuts for most families, which pale in comparison to the law’s large net tax cuts for the wealthy.
It’s Time to End the 2017 Law’s Windfalls for the Wealthy
Failing to allow the individual income tax and estate tax provisions to end as scheduled would benefit high-income households far more than other income groups. Extending them would boost after-tax incomes for the top 1 percent — those with incomes over $1 million — more than twice as much as for the bottom 60 percent as a percentage of their incomes in 2026.[16] In dollar terms, extending the expiring provisions only (that is, excluding the effect of the large corporate tax cuts the law made permanent) would result in a $48,000 tax cut for households in the top 1 percent in 2026, but only about $500 for those in the bottom 60 percent of households, on average.[17]
As the 2017 law’s individual income and estate tax cuts approach expiration, policymakers and the public should keep two important dynamics in mind.
First, in addition to the top 1 percent receiving very large tax cuts, the 2017 law delivered the largest average tax cut — measured as a percentage of pre-tax income — to households in the 95-99th percentiles. Their tax cut from the 2017 law amounts to 3.2 percent of their pre-tax income, on average (or nearly $13,000, on average).[18] This is more than triple the roughly 1 percent average percentage income gain of the bottom 60 percent.[19] (See Figure 2.)

This is important because the Biden Administration’s pledge not to raise taxes on those with incomes below $400,000 is likely to feature prominently in the debate. The 95-99th percentile group is a rough proxy for people with incomes in the $400,000 to $1 million range, according to TPC. This group is often inaccurately referred to as the “upper middle” class. This is a misleading characterization. These people are in the top 5 percent by income in one of the richest countries in the world. They tend to have high levels of resources; their median net worth was over $3.9 million in 2022, according to an analysis of the Survey of Consumer Finances, compared to just $169,000 for those with incomes below $400,000 and just $52,000 for those with incomes in the bottom 50 percent of the distribution.[20] The $400,000 threshold is quite high, and policymakers should resist any efforts to increase it. These households are rich, they should be paying higher taxes, and their 2017 tax cuts should not be extended.[21]
Second, these large, disproportionate income and estate tax cuts for high-income and high-wealth households come on top of the large benefits those households are currently receiving from the 2017 law’s permanent corporate tax cuts, which are tilted even more heavily toward wealthy people than the expiring individual tax cuts.[22] In 2018, the first year the law was in effect, the top 5 percent of households received 40 percent of the individual tax cuts, and more than half of the law’s other tax cuts, which were primarily corporate tax cuts.[23] (See Figure 3.)
These corporate tax cuts are even more concentrated at the very top, with the top 1 percent receiving 36.2 percent of the corporate provisions compared to 16.8 percent of the expiring individual provisions.

To comply with congressional budget rules, Republicans could not make all of the 2017 law’s tax cuts permanent, so they prioritized making the less-popular corporate tax changes permanent to avoid having to debate those cuts when the other provisions expired. As former House Speaker Paul Ryan recently said, “We made temporary what we thought could get extended; we made permanent what we thought might not get extended that we wanted to stay permanent.”[24]
This cynical political calculation should not prevent policymakers from revisiting the corporate tax cuts as part of the 2025 tax debate alongside ending the expiring individual and estate tax provisions for high-income households and paying for any that are extended. The nation needs to raise more revenue, and the profligate corporate tax rate cut and the ways in which our tax code encourages companies to use offshore tax havens should be reined in.
2017 Trump Tax Law Was Expensive and Further Eroded Our Revenue Base
Tax cuts enacted in the last 25 years — namely, those enacted in 2001 and 2003 under President Bush (most of which were made permanent in 2012) and those enacted in the 2017 tax law — gave windfall tax cuts to the wealthy, costing substantial revenue, limiting the investments made to address national priorities, and adding trillions to the national debt.[25]
The 2001 and 2003 Bush tax cuts, which reduced individual income tax rates, taxes on capital gains and dividends, and the tax on estates, cost roughly 2 percent of GDP in 2010.[26] The 2017 law took revenues even lower: CBO estimated in 2018 that the 2017 Trump tax cut will cost $1.9 trillion over ten years, on top of the cost of the Bush tax cuts also in place.[27]

In the three years immediately preceding the first Bush tax cuts, revenues averaged 19.5 percent of GDP, compared to 16.3 percent in the years immediately following the Trump tax cuts, with revenues expected to rise to an annual average of 16.9 percent of GDP from 2018 through 2026 (excluding pandemic years), according to CBO. (See Figure 4.) The revenue difference is stark: revenues in 2023, for example, would have been roughly $830 billion higher if they had totaled 19.5 percent of GDP as in the years before the Bush tax cuts.
Some may point to federal revenue levels as a share of GDP in the decades since World War II and conclude that the Bush and Trump tax cuts have brought revenues back to levels approaching the post-war historical average,[28] but this misses important context.
Namely, the U.S. needs higher revenues today than in recent decades for several reasons:[29]
- Demographics. The nation’s demographics have changed dramatically. With the retirement of the large baby boomer generation, the cost of promised — and extremely important and popular — Social Security, Medicare, and Medicaid benefits (including long-term care) are much higher as a share of the economy today than in decades past. When the 2001 Bush tax cuts were enacted, the baby boomers were in their prime working years. By contrast, in 2025, the youngest baby boomer will be 61 and the oldest 79, so the shares of the population above 65 have risen sharply and will continue to do so in the coming years. In 2001, 12.3 percent of the population was 65 or older. This figure is expected to rise to 18.4 percent in 2025 and 20.6 percent in 2034. This will significantly increase the budgets of Medicare, Medicaid, and Social Security, requiring much more revenue.
- Rising health care costs from expanded coverage and improved quality of care. Health care spending — in both the public and private sectors — has long grown faster than the economy[30] and is projected to continue doing so. This is the result of the demographic shifts described above, but it is also due to expanded coverage in recent decades and to new procedures, drugs, and treatments that improve health and save lives but also add to costs.[31] The nation now ensures access to affordable health coverage to vastly more people than four decades ago, when Medicaid primarily served a small group of families who received cash assistance, the Children’s Health Insurance Program had not yet been established, and the ACA and the Medicare prescription drug benefit (Medicare Part D) had not yet been enacted.
- Existing and emerging investment needs. The U.S. invests far less than other wealthy countries in children and in supports for workers — such as paid leave and unemployment benefits — and continues to have far more people without health coverage. Inadequate revenues have constrained policymakers’ willingness to address these and other problems requiring greater investment, such as climate change, housing, and child care. The U.S. is one of the richest countries in the world, yet we have higher child poverty than most other developed countries[32] even though we know how to drive down poverty, as was demonstrated by the Rescue Plan’s temporary Child Tax Credit expansion. Investing in children in families with low incomes improves children’s health and educational outcomes, giving them a brighter future and benefiting the nation as a whole.
The Bush and Trump tax cuts were irresponsible, given our substantial underinvestment in high-value areas, the retirement of baby boomers, rising health care costs, and potential national security threats. Moreover, by increasing deficits, these tax cuts have driven up the funds the country must devote to servicing the debt.
Revenues need to rise. Yet making the 2017 law’s individual and estate tax cuts permanent would cost another roughly $3.4 trillion from 2026 to 2035, or roughly $350 billion a year beginning in 2027.[33] (See Figure 5.) Lawmakers should reject this costly policy mistake.

Trump 2017 Tax Law Failed to Deliver on Its Promises
During the 2017 debate, Trump Administration officials and prominent proponents of the corporate tax cut proposal claimed it would yield broadly shared benefits by boosting economic growth. President Trump’s Council of Economic Advisers claimed the rate cut would “very conservatively” lead to a $4,000 boost in household income.[34] But research to date has failed to find evidence that the gains from the rate cut trickled down to most workers. For example, a 2019 Congressional Research Service report on the law’s economic impact concluded, “There is no indication of a surge in wages in 2018 either compared to history or to GDP growth.”[35]Similarly, a 2021 Brookings Institution report noted that “The Trump administration claimed that the [2017 law] would provide significant benefits to workers,” but Brookings found “no evidence that any wage response close to these claims occurred in 2018 and 2019.”[36]

A recent rigorous study by economists from the Joint Committee on Taxation (JCT) and the Federal Reserve Board found that workers below the 90th percentile of their firm’s income scale — a group whose incomes were below roughly $114,000 in 2016 — saw “no change in earnings” from the rate cut.[37] Earnings did, however, increase for workers in the top 10 percent and “increase[d] particularly sharply for firm managers and executives.”[38] (See Figure 6.) Some workers own stock and thus receive a share of the benefits going to firm owners, but even taking that into account, only 20 percent of the overall gains from the rate cut flow to the bottom 90 percent of workers. Workers with low or moderate incomes and wealth see very little of those already modest gains, because stock ownership is heavily concentrated at the top. The bottom 50 percent of households by net worth held just 1 percent of overall equities as of 2019.[39]
Another new study by a team of economists from Harvard, Princeton, the University of Chicago, and the Treasury Department estimates that the corporate tax cuts — including the cut in the corporate tax rate, full expensing for capital investments, and international tax changes — led to nearly dollar-for-dollar revenue losses, even after accounting for increases in economic activity due to those cuts, contrary to proponents’ promises that the cuts would pay for themselves.[40] The study does not examine how the corporate rate cut impacted earnings for workers with low and moderate incomes. It forecasts that in the long run, the corporate tax cuts could on average increase wages by about $750 per worker, an “order of magnitude below” proponents’ predictions;[41] the separate paper by JCT and Federal Reserve economists finds that wage and salary gains accrued only for workers in the top 10 percent of their firm’s earnings distribution.
The special 20 percent deduction for pass-through business income is also heavily skewed in favor of high-income people because they receive most pass-through income,[42] they get a much larger share of their income from pass-throughs compared to other income groups,[43] and they receive the largest tax break per dollar of income deducted (because they are in the top income tax brackets). As a result, in 2019, the latest non-pandemic year for which data are available, the average pass-through deduction across all taxpayers who claimed the deduction was roughly $7,000, but it was nearly $1 million for the 15,000 taxpayers with incomes above $10 million who claimed the deduction.[44]
Proponents argued the pass-through deduction would boost investment and create jobs.[45] Then-Treasury Secretary Steven Mnuchin, for example, argued the deduction would “be good for the economy; good for growth.”[46] But researchers have found no evidence that it provided any significant boost in economic activity and little evidence that it increased investment or broadly benefited non-owner workers.[47] Instead, it has encouraged more tax gaming, encouraging owners to reclassify their income as pass-through income that qualifies for the deduction.[48]
The failure of the regressive Trump tax provisions to trickle down to the vast swath of workers should not be surprising given the track record of past trickle-down tax cuts. For example, studies of an even deeper tax cut for pass-through businesses in Kansas — a full exemption from state taxation for pass-through income — found that “the reform failed to generate real economic responses.”[49]
More broadly, beyond the 2017 law, a 2023 review of the trickle-down literature by Carnegie Mellon University economist Max Risch found that “across different income tax policies that statutorily affect the rich, the evidence suggests the burden is predominantly born by the rich.” In other words, research indicates that tax cuts at the top don’t generally benefit workers with low and moderate incomes. By contrast, Risch concludes that “substantial evidence suggests large direct, but also potential ‘trickle-up’ effects from providing benefits to low-income or vulnerable households.”[50]
A Tax Policy Course Correction Is Needed in 2025
Given the 2017 law’s deep flaws — it’s skewed to the top, costly, and has failed to deliver on its economic promises — policymakers should seize the opportunity the 2025 expirations provide and make a course correction. Regressive tax policies should be replaced with progressive ones, our tax system needs to raise more revenues, and our fiscal priorities need a fundamental reset.
Several key principles should guide this new course:
- Tax cuts for people making over $400,000 should end on schedule;
- The tax system needs to raise more revenues from wealthy people and profitable corporations to offset any tax cuts extended or expanded for those with incomes below $400,000, to finance high-value investments in people and communities, and to improve our fiscal outlook; and
- Top priorities for extending and expanding tax provisions in 2025 should be the Child Tax Credit, the EITC for adults not raising children, and the enhanced premium tax credits for ACA marketplace coverage; increased revenues can also be used for other critical investments outside of the tax code.
End Notes
[1] Tax Policy Center (TPC), “T17-0314 - Conference Agreement: The Tax Cuts and Jobs Act; Baseline: Current Law; Distribution of Federal Tax Changes by Expanded Cash Income Percentile, 2025,” December 18, 2017, https://www.taxpolicycenter.org/model-estimates/conference-agreement-tax-cuts-and-jobs-act-dec-2017/t17-0314-conference-agreement.
[2] Ibid. This includes the effects of all the law’s provisions in 2025, including its permanent provisions and those that expire after 2025.
[3] Congressional Budget Office (CBO), “The Budget and Economic Outlook: 2018 to 2028,” April 9, 2018, https://www.cbo.gov/publication/53651.
[4] CBO, “Budgetary Outcomes Under Alternative Assumptions About Spending and Revenues,” May 2023, https://www.cbo.gov/system/files/2023-05/59154-Budgetary-Outcomes.pdf.
[5] Council of Economic Advisers, “Corporate Tax Reform and Wages: Theory and Evidence,” October 2017, https://trumpwhitehouse.archives.gov/sites/whitehouse.gov/files/documents/Tax%20Reform%20and%20Wages.pdf.
[6] Patrick J. Kennedy et al., “The Efficiency-Equity Tradeoff of the Corporate Income Tax: Evidence from the Tax Cuts and Jobs Act,” November 14, 2023, https://patrick-kennedy.github.io/files/TCJA_KDLM_2023.pdf. The $114,000 threshold for the 90th percentile of the within-firm earnings distribution appears in an earlier version of the paper, dated December 9, 2022 (Table 5, Panel A).
[7] Lucas Goodman et al., “How Do Business Owners Respond to a Tax Cut? Examining the 199A Deduction for Pass-through Firms,” NBER Working Paper 28680, January 2024, https://www.nber.org/system/files/working_papers/w28680/w28680.pdf. See also Chuck Marr and Samantha Jacoby, “The Pass-Through Deduction Is Tilted Heavily to the Wealthy, Is Costly, and Should Expire as Scheduled,” CBPP, June 8, 2023, https://www.cbpp.org/research/federal-tax/the-pass-through-deduction-is-tilted-heavily-to-the-wealthy-is-costly-and.
[8] An analysis of the Bush tax cuts by Brookings Institution economist William Gale and Dartmouth professor Andrew Samwick, former chief economist on George W. Bush’s Council of Economic Advisers, found that “there is, in short, no first-order evidence in the aggregate data that these tax cuts generated growth.” William Gale and Andrew Samwick, “Effects of Income Tax Changes on Economic Growth,” Brookings Institution, February 2016, https://www.brookings.edu/wp-content/uploads/2016/07/09_Effects_Income_Tax_Changes_Economic_Growth_Gale_Samwick_.pdf.
[9] TPC estimated that in 2010, the year the Bush tax cuts were fully phased in, they raised the after-tax incomes of the top 1 percent of households by 6.6 percent, compared to 2.6 percent for the middle 20 percent of households. The bottom 20 percent of households received the smallest cuts, with their after-tax incomes increasing by just 0.5 percent.TPC, “T10-0232 – Current Law; Baseline: Pre-EGTRRA Law; Distribution by Cash Income Percentile, 2010,” September 14, 2010, https://www.taxpolicycenter.org/model-estimates/distributional-impact-bush-tax-cuts-2004-2010/current-law-baseline-pre-egtrra-law-12.
[10] 2025 is when the law is fully phased in and is before many provisions in the law are scheduled to expire. TPC, “T17-0314 - Conference Agreement: The Tax Cuts and Jobs Act; Baseline: Current Law; Distribution of Federal Tax Changes by Expanded Cash Income Percentile, 2025,” December 18, 2017, https://www.taxpolicycenter.org/model-estimates/conference-agreement-tax-cuts-and-jobs-act-dec-2017/t17-0314-conference-agreement.
[11] Due to racial barriers to economic opportunity, households of color are overrepresented among households with incomes in the bottom of the distribution, while non-Hispanic white households are heavily overrepresented among households with incomes at the top of the distribution. The 2017 law’s core provisions tilt heavily to households with incomes at the top of the distribution: white households in the highest-earning 1 percent receive 23.7 percent of the law’s total cuts, far more than the 13.8 percentage share that the bottom 60 percent of households of all races receive. Chye-Ching Huang and Roderick Taylor, “How the Federal Tax Code Can Better Advance Racial Equity,” CBPP, July 25, 2019, https://www.cbpp.org/research/federal-tax/how-the-federal-tax-code-can-better-advance-racial-equity.
[12] Chuck Marr and Samantha Jacoby, “The Pass-Through Deduction Is Tilted Heavily to the Wealthy, Is Costly, and Should Expire as Scheduled,” CBPP, June 8, 2023, https://www.cbpp.org/research/federal-tax/the-pass-through-deduction-is-tilted-heavily-to-the-wealthy-is-costly-and.
[13] The law also added a $10,000 cap on the deduction for state and local taxes (SALT). This has an offsetting effect for some taxpayers when combined with the law’s changes to the alternative minimum tax (AMT). See Kimberly A. Clausing and Natasha Sarin, “The Coming Fiscal Cliff: A Blueprint for Tax Reform in 2025,” The Hamilton Project, September 2023, https://www.hamiltonproject.org/wp-content/uploads/2023/09/20230927_THP_SarinClausing_FullPaper_Tax.pdf.
[14] The law doubled the Child Tax Credit’s maximum value from $1,000 to $2,000 per child but denied millions of children in families with low and moderate incomes the full increase. As of tax year 2022, roughly 19 million children get less than the full $2,000 Child Tax Credit or no credit at all because their families’ incomes are too low. TPC, “T22-0123 – Distribution of Tax Units and Qualifying Children by Amount of Child Tax Credit (CTC), 2022,” October 18, 2022, https://www.taxpolicycenter.org/model-estimates/children-and-other-dependents-receipt-child-tax-credit-and-other-dependent-tax. Further, the law was estimated in 2017 to have ended the Child Tax Credit for about 1 million children who weren’t eligible for a Social Security number because of their immigration status but might have been claimed as tax dependents using an Individual Tax Identification Number. CBPP, “2017 Tax Law’s Child Credit: A Token or Less-Than-Full Increase for 26 Million Kids in Working Families,” August 27, 2018, https://www.cbpp.org/research/2017-tax-laws-child-credit-a-token-or-less-than-full-increase-for-26-million-kids-in.
[15] The 2017 law permanently switched from the Consumer Price Index for all urban consumers (CPI-U) to the “chained” CPI to adjust tax brackets and certain provisions for inflation each year. The chained CPI generally rises more slowly over time than traditional the CPI-U. This slower growth erodes the value of certain provisions, such as the EITC, and is expected to push more taxpayers into higher tax brackets over time.
[16] TPC, “T22-0144 – Make the Individual Income Tax and Estate Tax Provisions in the 2017 Tax Act Permanent, by ECI Percentiles, 2026,” November 30, 2022, https://www.taxpolicycenter.org/model-estimates/make-individual-income-tax-and-estate-tax-provisions-2017-tax-act-permanent-1.
[17] Ibid.
[18] TPC, “Distributional Analysis of the Conference Agreement for the Tax Cuts and Jobs Act,” December 18, 2017, https://www.taxpolicycenter.org/sites/default/files/publication/150816/2001641_distributional_analysis_of_the_conference_agreement_for_the_tax_cuts_and_jobs_act_0.pdf.
[19] Ibid.
[20] CBPP analysis of the 2022 Survey of Consumer Finances (SCF). In our SCF analysis, household income is market income (income from all sources except for Supplemental Security Income, Temporary Assistance to Needy Families, and the Supplemental Nutrition Assistance Program).
[21] We will soon release a paper detailing the tax cuts this group received from the 2017 law.
[22] CBO, “The Distribution of Household Income, 2018,” August 4, 2021, https://www.cbo.gov/publication/57061.
[23] TPC, “Table T18-0025 – The Tax Cuts and Jobs Act (TCJA): All Provisions and Individual Income Tax Provisions, Distribution of Federal Tax Change by Expanded Cash Income Percentile, 2018,” February 16, 2018, https://www.taxpolicycenter.org/model-estimates/individual-income-tax-provisions-tax-cuts-and-jobs-act-tcja-february-2018/t18-0025. TPC’s analysis of the law’s individual income tax provisions includes the effect of certain pass-through business tax provisions, which business owners claim on their individual income tax returns.
[24] The Hamilton Project, “Taking on Tax: The past, present, and future,” September 27, 2023, https://www.hamiltonproject.org/event/taking-on-tax-policy/?_ga=2.26669821.1398658866.1707148521-1235817300.1707148521.
[25] Bobby Kogan, “Tax Cuts Are Primarily Responsible for the Increasing Debt Ratio,” Center for American Progress, March 27, 2023, https://www.americanprogress.org/article/tax-cuts-are-primarily-responsible-for-the-increasing-debt-ratio/.
[26] This figure is based on a compilation of CBO cost estimates that includes both the revenue and outlay effects of all major tax legislation enacted during the George W. Bush Administration. Based on analysis in Kathy Ruffing and Joel Friedman, “Economic Downturn and Legacy of Bush Policies Continue to Drive Large Deficits,” CBPP, February 28, 2013, https://www.cbpp.org/research/economic-downturn-and-legacy-of-bush-policies-continue-to-drive-large-deficits. For a detailed description of methodology used in this analysis, see box, “What Did Bush-Era Tax Cuts Cost through 2011?” in Kathy Ruffing and James R. Horney, “Downturn and Legacy of Bush Policies Drive Large Current Deficits,” CBPP, updated October 10, 2012, https://www.cbpp.org/research/downturn-and-legacy-of-bush-policies-drive-large-current-deficits.
[27] CBO, “The Budget and Economic Outlook: 2018 to 2028.”
[28] Annual revenues averaged 16.8 percent as a share of GDP since 1946. Federal Reserve Bank of St. Louis, “Federal Receipts as Percent of Gross Domestic Product,” February 28, 2024, https://fred.stlouisfed.org/series/FYFRGDA188S.
[29] Paul N. Van de Water, “Federal Spending and Revenues Will Need to Grow in Coming Years, Not Shrink,” CBPP, September 6, 2017, https://www.cbpp.org/research/federal-budget/federal-spending-and-revenues-will-need-to-grow-in-coming-years-not-shrink.
[30] CBO estimates that the cost of “major health care programs,” including Medicare, Medicaid, CHIP, and the ACA, will rise to 6.7 percent of GDP in 2034, up from 4 percent in 2008.
[31] Van de Water, op. cit.
[32] OECD, “Poverty Rate (indicator),” 2024, https://data.oecd.org/inequality/poverty-rate.htm.
[33] CBPP calculations based on CBO, “Budgetary Outcomes Under Alternative Assumptions About Spending and Revenues.”
[34] Council of Economic Advisers, op. cit.
[35] Jane G. Gravelle and Donald J. Marples, “The Economic Effects of the 2017 Tax Revision: Preliminary Observations,” Congressional Research Service, updated June 7, 2019, https://crsreports.congress.gov/product/pdf/R/R45736.
[36] William Gale and Claire Haldeman, “The Tax Cuts and Jobs Act: Searching for supply-side effects,” Brookings Institution, July 2021, https://www.brookings.edu/wp-content/uploads/2021/07/20210628_TPC_GaleHaldeman_TCJASupplySideEffectsReport_FINAL.pdf.
[37] Kennedy et al., op. cit. The $114,000 threshold for the 90th percentile appears in an earlier version of the paper, dated December 9, 2022 (Table 5, Panel A). The sample period is 2013-2019, and gains from the tax cut are reported in nominal dollars.
[38] Ibid.
[39] Robert Gebeloff, “Who Owns Stocks? Explaining the Rise in Inequality During the Pandemic,” New York Times, January 26, 2021, https://www.nytimes.com/2021/01/26/upshot/stocks-pandemic-inequality.html.
[40] Gabriel Chodorow-Reich et al., “Tax Policy and Investment in a Global Economy,” NBER Working Paper, March 2024, https://www.nber.org/papers/w32180. The authors show that even when corporate tax cuts increase economic activity, there are countervailing, dynamic revenue impacts. On the one hand, more economic activity could expand the tax base and therefore increase tax collections; on the other, increased investment leads firms to take more depreciation deductions, which decreases tax collections. This study concludes that these two forces nearly offset in the near term, such that “the total revenue effect closely mirrors the mechanical corporate effect.” In the long run, the paper projects that dynamic effects could “close roughly 20 percent of the mechanical revenue decline.” Regarding claims that the 2017 tax law would pay for itself, see e.g., Kate Davidson, “Treasury Secretary Steven Mnuchin: GOP Tax Plan Would More Than Offset Its Cost,” Wall Street Journal, September 28, 2017, https://www.wsj.com/articles/treasury-secretary-steven-mnuchin-gop-tax-plan-would-more-than-offset-its-cost-1506626980.
[41] Jim Tankersley, “Trump’s Tax Cut Fueled Investment but Did Not Pay for Itself, Study Finds,” New York Times, March 4, 2024, https://www.nytimes.com/2024/03/04/us/politics/trump-corporate-tax-cut.html.
[42] For example, around 70 percent of the income of partnerships, a common pass-through structure, flows to the top 1 percent of households. Michael Cooper et al., “Business in the United States: Who Owns It, and How Much Tax Do They Pay?” Tax Policy and the Economy, Vol. 30, No. 1, 2016, https://www.journals.uchicago.edu/doi/full/10.1086/685594#.
[43] CBO, “The Distribution of Household Income, 2019,” November 15, 2022, https://www.cbo.gov/publication/58353.
[44] IRS Statistics of Income, 2019, https://www.irs.gov/pub/irs-prior/p1304--2021.pdf.
[45] Steven Mufson, “Sen. Johnson Is a ‘No’ on the Tax Bill. He Says it Hurts Businesses (Like His Own),” Washington Post, November 16, 2017, https://www.washingtonpost.com/business/economy/sen-johnson-is-a-no-on-the-tax-bill-he-says-it-hurts-businesses-like-his-own/2017/11/16/c47b2a56-ca54-11e7-b0cf-7689a9f2d84e_story.html.
[46] Matthew J. Belvedere, “Mnuchin: GOP Tax Reform Would Give Small Business Owners the Lowest Rates ‘Since the 1930s,’” CNBC, November 17, 2017, https://www.cnbc.com/2017/11/17/mnuchin-gop-tax-plan-gives-small-business-lowest-rates-since-1930s.html.
[47] Goodman et al., op. cit.
[48] Marr and Jacoby, op. cit.
[49] Jason DeBacker et al., “The Impact of State Taxes on Pass-Through Businesses: Evidence from the 2012 Kansas Income Tax Reform,” September 29, 2017, https://papers.ssrn.com/sol3/papers.cfm?abstract_id=2958353. See also Michael Mazerov, “Kansas Provides Compelling Evidence of Failure of ‘Supply-Side’ Tax Cuts,” CBPP, January 22, 2018, https://www.cbpp.org/research/kansas-provides-compelling-evidence-of-failure-of-supply-side-tax-cuts.
[50] Max Risch, “Trickle-Down Revisited,” Oxford Review of Economic Policy, 2023, https://www.law.columbia.edu/sites/default/files/2023-02/Trickle_Down_Feb14%20%281%29.pdf.
Más de los autores

Areas of Expertise

Areas of Expertise