

SNAP Provides Needed Food Assistance to Millions of People With Disabilities
There are over 70 million people in the United States with one or more disabilities.[2], [3] Many people with disabilities have greater expenses than people without disabilities,[4] making it harder for people with disabilities and their caregivers to afford food, health care, and other essential needs.
While programs like Supplemental Security Income (SSI), Social Security Disability Insurance (SSDI), Medicaid, and Medicare provide critical support to many people with disabilities, the importance of the Supplemental Nutrition Assistance Program’s (SNAP) benefits for the economic well-being and food security of low-income people with disabilities is less recognized. SNAP provides millions of people with disabilities with billions of dollars in food assistance annually. Our examination of the intersection of SNAP and disability in the United States shows that:
- People with disabilities are more likely to experience food insecurity than people without disabilities. Households with people with disabilities are two to three times more likely to be food insecure, meaning they experience limited or uncertain access to adequate food due to economic constraints, than households without people with disabilities, in part due to additional daily living costs and lack of access to appropriate or adequate food.
- SNAP is the largest federally funded food assistance program in the United States, providing assistance to 42 million people in 2025, including an estimated 19.5 million people with disabilities. An extensive body of evidence demonstrates that SNAP lifts millions of people out of poverty, improves food security, and can improve long-term health and economic outcomes.
- Historically deep cuts to SNAP and work requirement expansions must be reversed to protect disabled people’s equitable and consistent access to food. Research shows SNAP improves food security among disabled people; however, an estimated 4.2 million households with low incomes that include someone with a disability are food insecure.[5] The Fiscal Responsibility Act of 2023 raised the age limit for the work requirement from 49 to 54. The harmful Republican reconciliation law enacted in July 2025 expanded the work requirement to older adults ages 55 to 64 and to parents and caregivers whose youngest child is at least 14 years old. The law also cuts federal funding for states’ SNAP programs, creating the possibility that states will cut or end their programs altogether. These recent changes risk taking away food assistance from millions of individuals, including older adults and people with disabilities, and the people they live with.
Defining Disability in the United States
Estimating the number people with disabilities in the United States and describing their characteristics is complicated because disability is defined differently across social, medical, economic, and programmatic contexts.[6] A consistent definition across different sources and settings, such as in population-level surveys, health settings, and social policy contexts, is critical to facilitating comparisons and collecting information to better understand and improve outcomes for people with disabilities.
The Americans with Disabilities Act (ADA) — a federal law that prohibits discrimination based on disability — defines an individual with a disability as a person who has a physical or mental impairment that substantially limits one or more major life activities, even if this impairment is episodic or can be ameliorated through adaptive equipment; a person who has a history or record of such an impairment; or a person who is perceived by others as having such an impairment.[7]
Most federal assistance programs that provide disability benefits — such as the SSI program and SSDI — define disability even more narrowly than the ADA, generally providing benefits only for impairments classified as severe, long-lasting, and preventing substantial work. In addition to being very narrow, this policy definition of disability also fails to recognize that some disabled people may be prevented from working due to workplace discrimination and lack of efforts to include people with disabilities in the workforce.
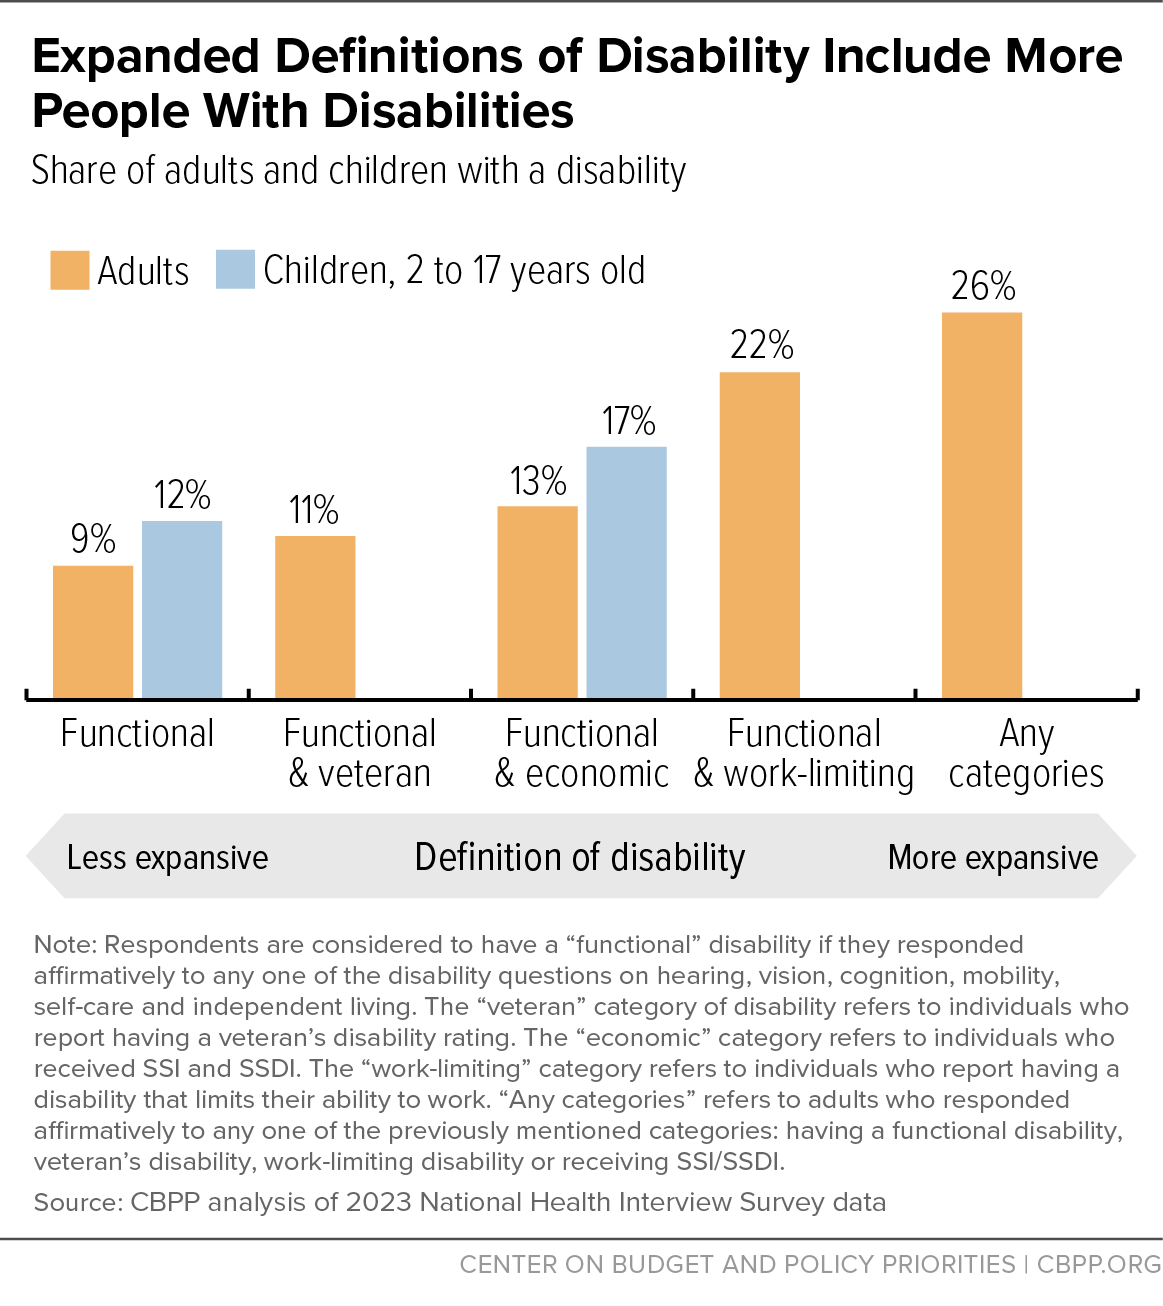
Because of varying definitions of disability, different data sources produce varying estimates of the number of people with disabilities. (See Figure 1.) The Department of Health and Human Services (HHS) uses a six-item set of survey questions (the ACS-6 standard) that capture a broad range of difficulties with hearing, vision, cognition, mobility, self-care, and independence.[8] The American Community Survey (ACS) and Behavioral Risk Factor Surveillance System (BRFSS) also use the ACS-6 standard to estimate the prevalence of disabilities.[9] The National Health Interview Survey (NHIS) uses a related, but slightly different set of questions (the Washington Group Short Set on Functioning, or WG-SS) that capture difficulties with hearing, vision, cognition, mobility, self-care, and communication.[10] However, both the ACS-6 and WG-SS have been shown to underestimate disability prevalence.[11] This report uses the 2023 NHIS data and expands on the original definition of individuals as having disabilities, which indicates if they report difficulties in any of these six areas (based on the WG-SS). This definition of disability is expanded in this report to include individuals who report difficulties in the six areas, have a work-limiting disability, receive SSI or SSDI and are under 60 years old, or have a veteran service-connected disability rating.[12], [13]

Figure 1 shows how expanding the definition of disability increases the number of people who are counted as having a disability in 2023, with the share ranging from 1 in 9 adults using the standard six-question set to 1 in 4 adults if additional items, such as reporting SSI receipt and having a work limiting disability or veteran’s disability rating, are included. Similarly, the share of children who are disabled ranges from about 1 in 8, to 1 in 6, if SSI receipt is included.
In this report, we use the NHIS to estimate the total number of individuals with disabilities and those receiving SNAP, as it identifies individuals based on reported impairments as a broader measure of disability. In all subsequent figures and numbers based on the NHIS in this report, we adopt an expanded definition of disability. We determine individuals to have a disability if they answer affirmatively to any of the six disability questions and report that their household received SSI/SSDI (both adults and children), they have a work limiting disability (for adults only), or they have a veteran’s disability rating (for adults only).
We also use SNAP Quality Control (QC) administrative data to analyze the demographic characteristics and benefit information of people with disabilities receiving SNAP, and to estimate by state the number of people with disabilities receiving SNAP and its benefits. The QC data have more detailed and reliable information on SNAP participation and benefits, despite their shortcomings in measuring disability. To estimate state totals, we use the American Community Survey Public Use Microdata (PUMS), which measures disability more comprehensively than the SNAP QC data. Unlike the NHIS, the ACS contains state-level information. These state-level estimates can be found in Appendix Tables 1 through 4.
Recent changes to how major national surveys collect and categorize demographic information may have affected how race, ethnicity, and gender are defined and coded.[14] As a result, observed differences — or the absence of differences — in disability prevalence, for example, across these demographic groups may partly reflect methodological revisions rather than true population-level variation. These ongoing changes to survey design, question wording, and data processing underscore the importance of interpreting recent estimates with caution. Additionally, recent and proposed terminations of national data collection and data releases, such as the Food Security Supplement of the Current Population Survey (CPS), would limit the ability to understand, track, and act on the food needs of different communities, including disabled people.[15]
Disability Prevalence Differs by Age, Race, and Ethnicity
National survey data from the 2023 BRFSS shows that over 1 in 4 (29.2 percent) adults in the U.S. has a functional limitation, meaning that they have difficulties with hearing, vision, mobility, cognition, self-care, or independent living.[16] This share is equivalent to over 70 million people with disabilities.[17]
The prevalence of disability varies across demographic groups, differing by age, gender, race, and ethnicity:
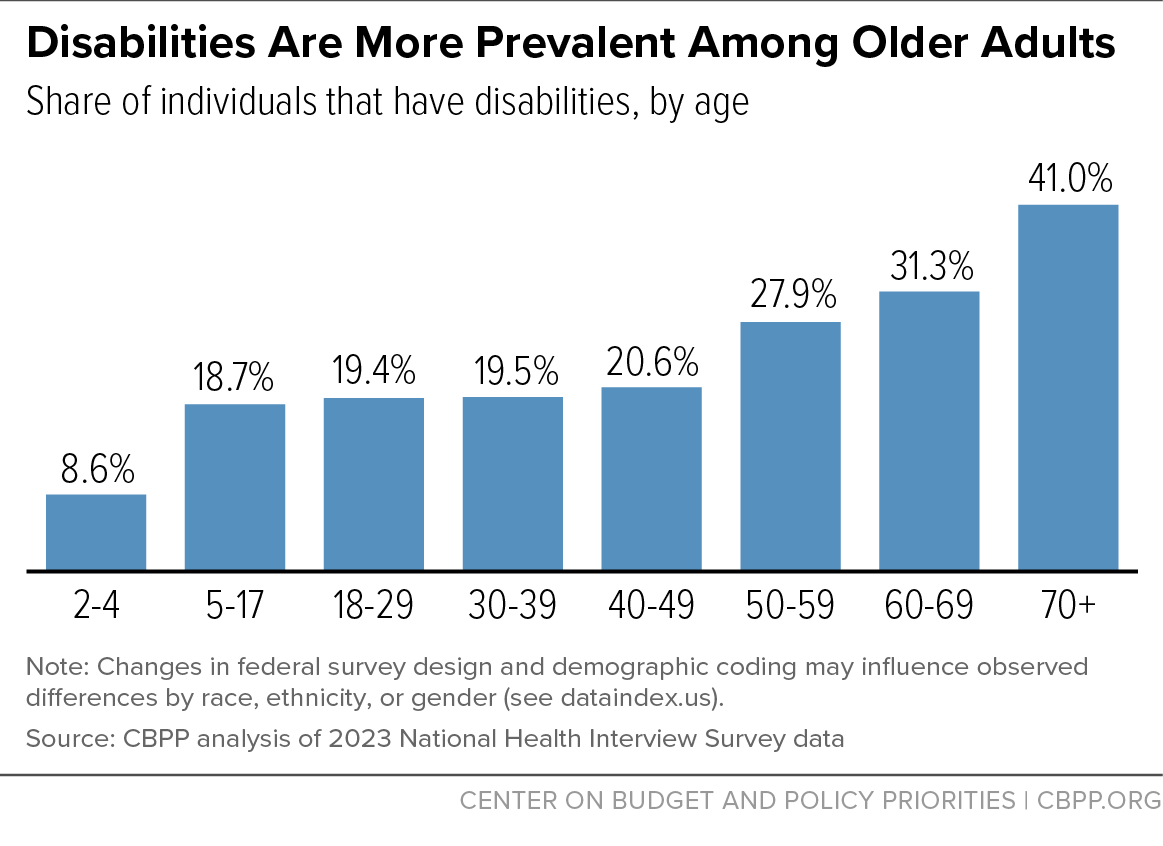
- As people age, the prevalence of disability rises substantially — from 9 percent among children ages 2 to 4 to 41 percent among adults age 70 and older. (See Figure 2.)
- The prevalence of disability among women (25 percent) and men (24 percent) is very similar.
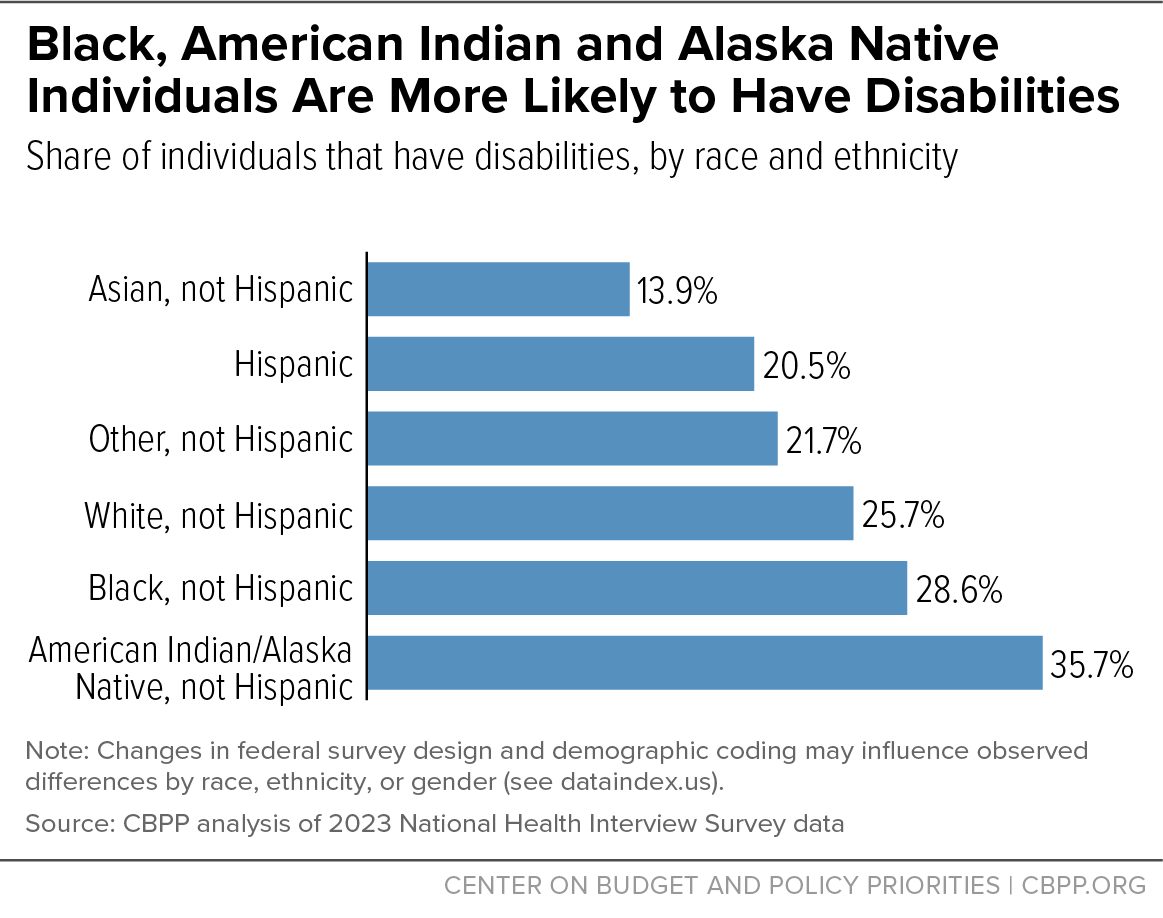
- By race and ethnicity, the prevalence of disability is highest among people who identify as American Indian/Alaska Native (36 percent) and Black (29 percent), followed by white (26 percent) and Hispanic (20 percent) adults. (See Figure 3.)


Many People With Disabilities Face Economic Hardship
People With Disabilities Experience Financial Challenges
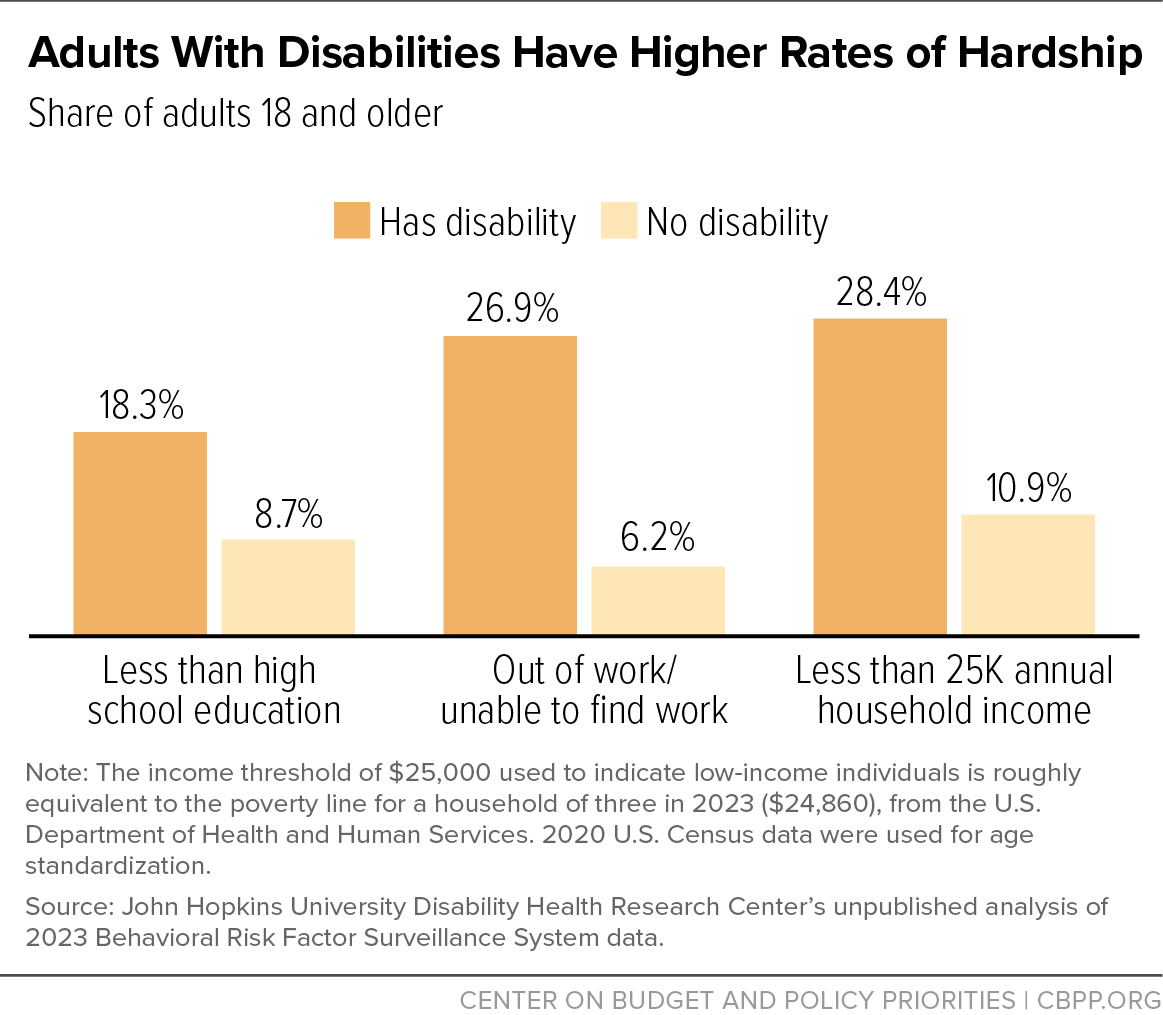
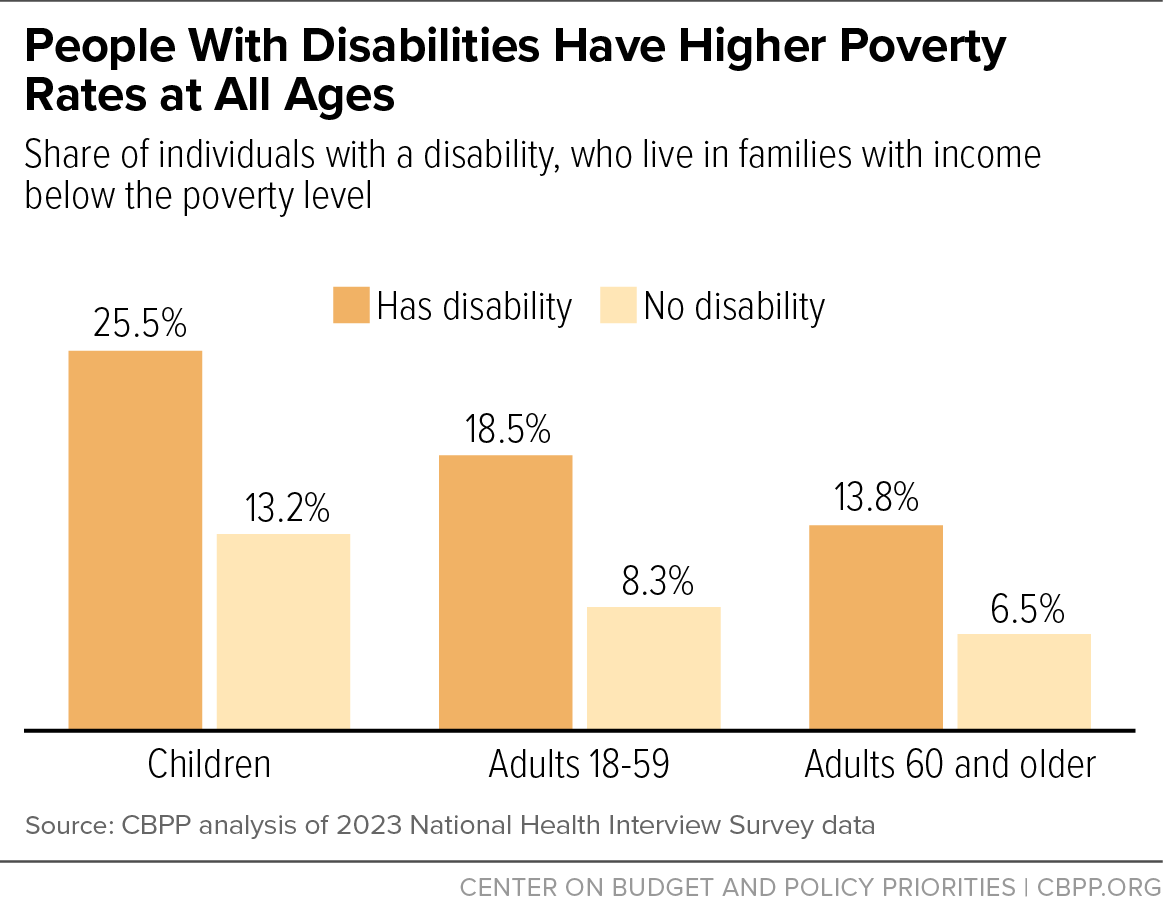
Adults with disabilities experience higher poverty rates, have lower savings, and are less able to cover emergency expenses than those without disabilities. Combined higher disability-related costs and lower incomes heighten financial vulnerability for people with disabilities.[18] Adults with disabilities are more likely than those without disabilities to have less than a high school education and to experience unemployment, and are twice as likely to live below the poverty line (Figure 4).[19] Notably, people with disabilities have disproportionately high rates of poverty across all age groups, suggesting that inequities persist across their lifetimes (Figure 5).


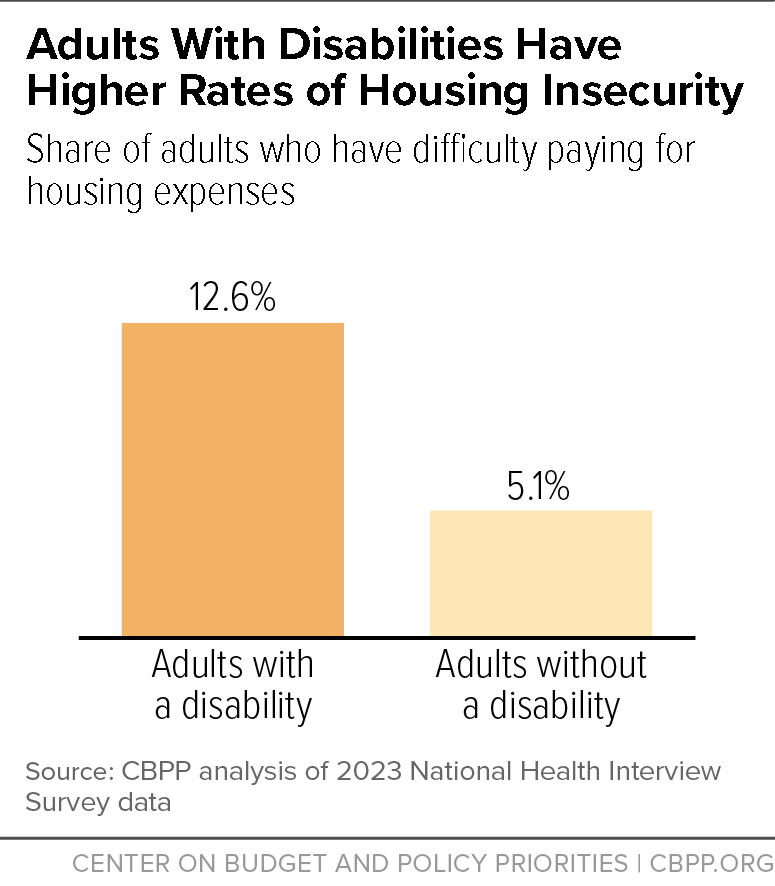
However, traditional socioeconomic measures like income and poverty may not reflect other barriers and challenges that people with disabilities also face. For example, households that include someone with disabilities are estimated to need 28 percent higher income levels to maintain the same standard of living as households that do not include anyone with disabilities.[20] This is partly due to challenges finding accessible and affordable housing, as well as higher annual health care expenditures and out-of-pocket health care spending.[21] Due to these combined financial challenges, people with disabilities are more than twice as likely to experience housing insecurity (Figure 6) and also experience more cost-related delays in health care.[22]

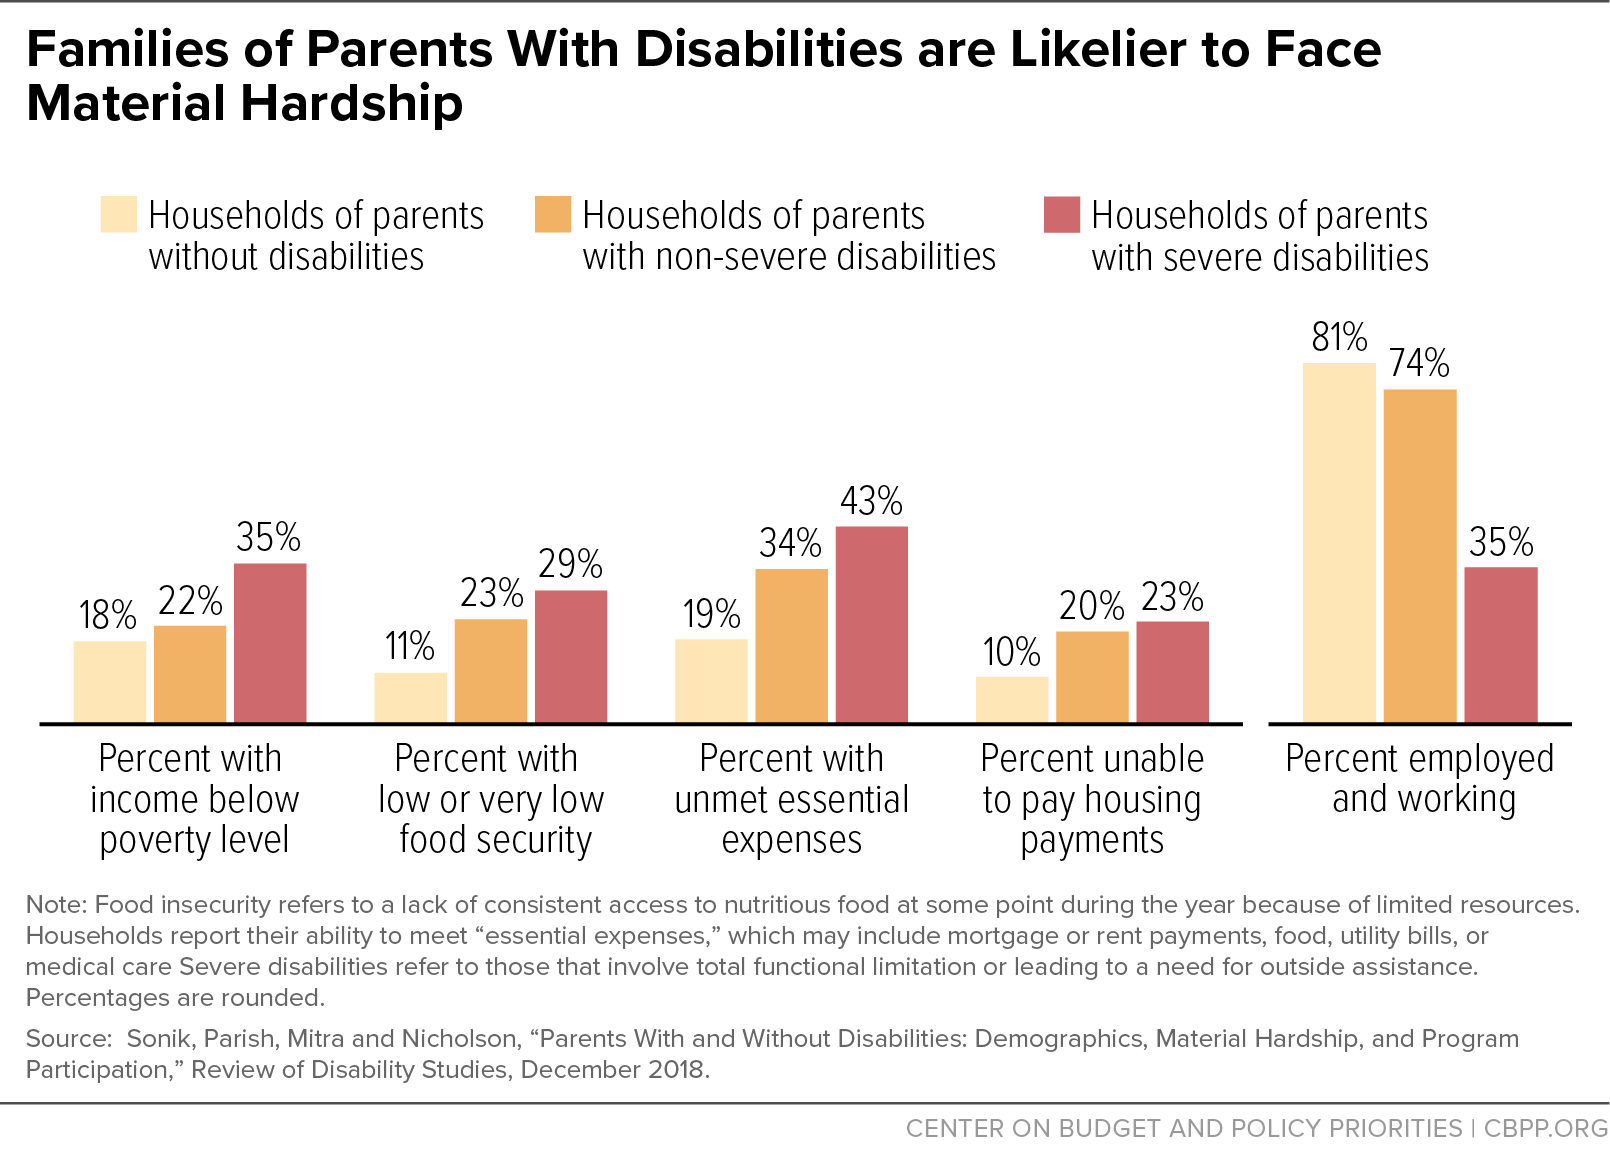
Families with disabled children are at least 50 percent more likely to postpone needed medical or dental care, miss rent payments, or lose telephone service than families without disabled children.[23] Parents with disabilities are more likely than those without disabilities to have unmet basic needs, even though they are more likely to receive government assistance (Figure 7).[24]
Disabled people of color face compounded inequities as systemic racism and ableism intersect to drive inequities in housing, health care, education, and employment. Ableism refers to the devaluing of and discrimination towards disabled people, which includes biased assumptions that people with disabilities are inherently less capable than people without disabilities.[25] 61 percent of Hispanic individuals with disabilities and 59 percent non-Hispanic Black individuals with disabilities have annual household earnings of less than $25,000, compared to 37 percent of white individuals.[26]
American Indians and Alaska Natives with disabilities are an especially disadvantaged group. More than one-quarter of American Indians and Alaska Natives live below the poverty line, a rate that is more than double that of the general population, and they are also 50 percent more likely to have a disability when compared to the national prevalence.[27] Notably, many national surveys lack sufficient data for American Indians and Alaska Natives with disabilities.

People With Disabilities Disproportionately Experience Food Insecurity
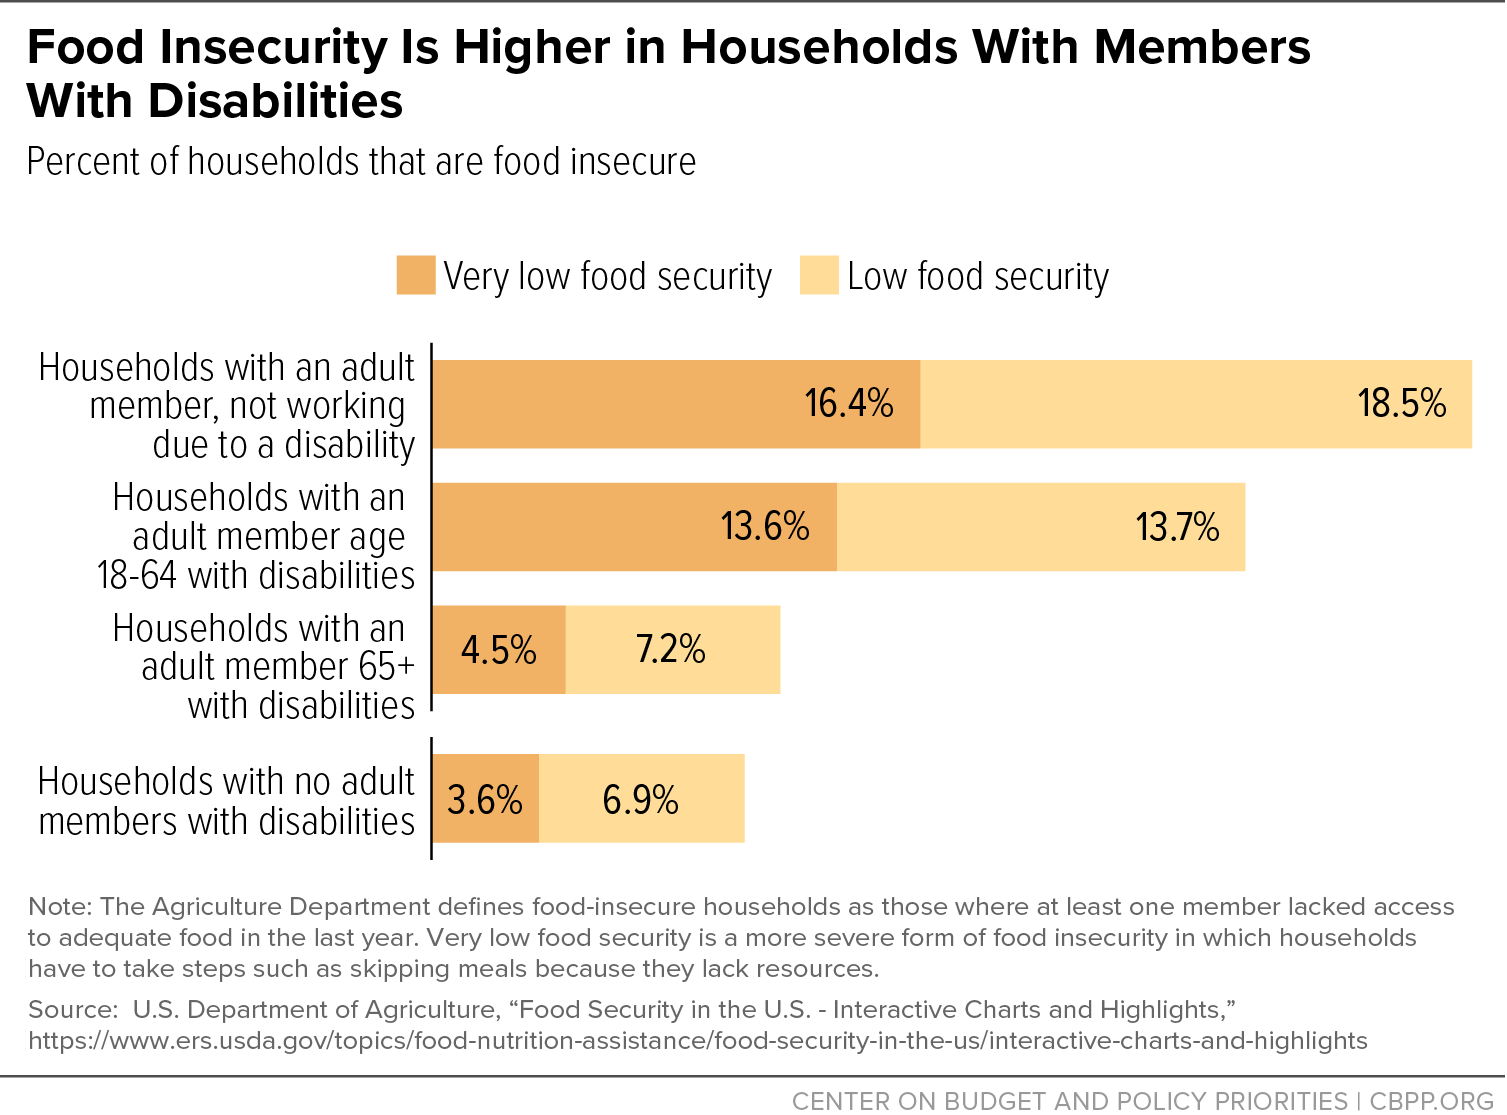
One in three households that include someone with disabilities are food insecure.[28] Households that include someone with disabilities are two to three times more likely to experience food insecurity than households that do not include someone with disabilities (Figure 8).[29]
Despite multiple food assistance programs for children, households with disabled children are about twice as likely as households with children without disabilities to experience food insufficiency (a different measure of food hardship, in which adults report that their household sometimes or often did not have enough to eat in the last week) or food insecurity.[30]
Food insecurity is a public health problem associated with numerous adverse health outcomes across all stages of life.[31] Children and adolescents experiencing food insecurity have poorer overall health and mental health outcomes, including higher risks of asthma, emergency department use, developmental delays, and behavioral problems.[32] Among adults, food insecurity is associated with higher health care costs and a higher risk of high blood pressure, cholesterol, diabetes, dementia, and mortality.[33]

SNAP Provides Important Support to People With Disabilities
SNAP is the nation’s largest federal food assistance program, providing assistance to 42 million people in an average month in 2025.[34] Typically, households with incomes at or below 130 percent of the federal poverty line and with few financial assets are eligible for SNAP. SNAP benefit amounts are calculated for each household based on its size and income level and on food costs estimated by the United States Department of Agriculture’s (USDA’s) Thrifty Food Plan.
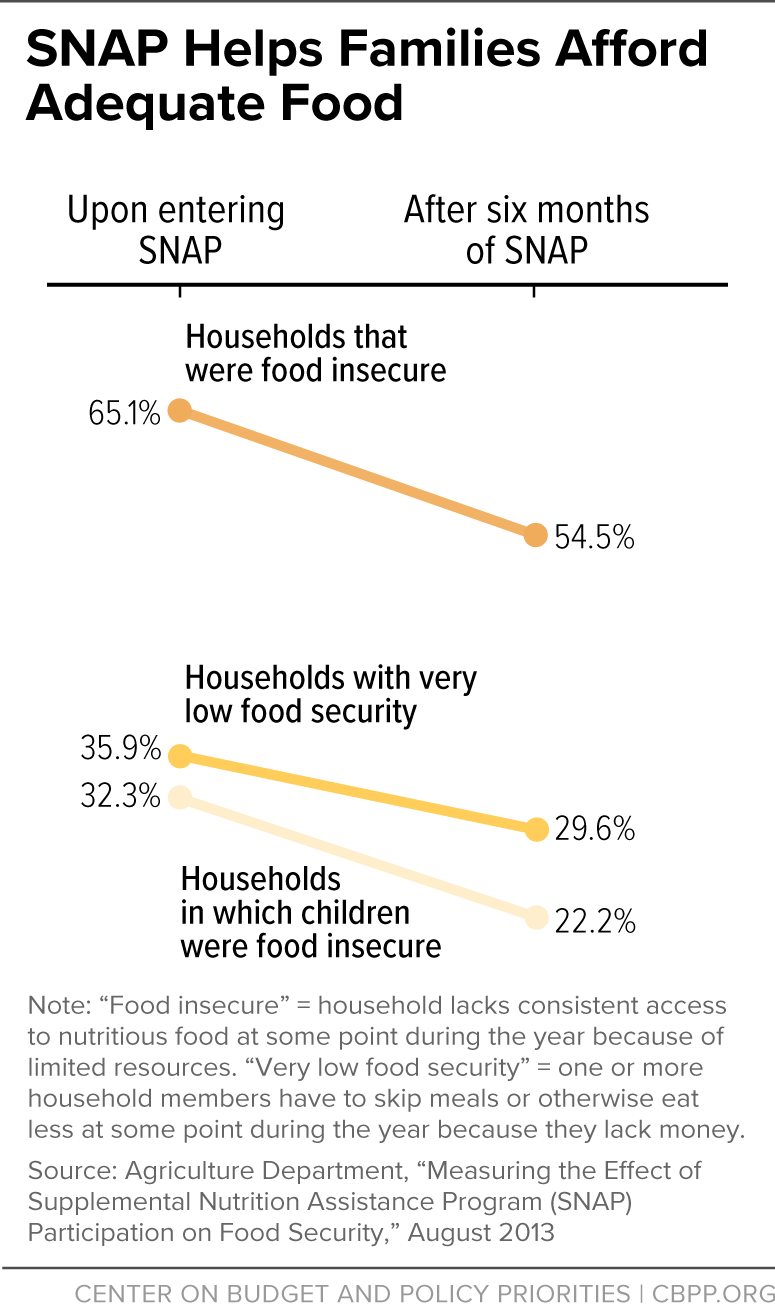
Participating in SNAP improves food security for both children and adults (Figure 9) and is associated with better health outcomes and lower health care costs. [35], [36] SNAP participants are more likely to see a doctor for periodic check-ups, have reduced medical care costs, and are less likely to forgo their full prescribed dosage of medicine due to cost, compared to low-income non-participants.[37]
There is also strong evidence that strengthening SNAP benefits can be an effective public health strategy to address food hardships.[38] During the COVID-19 pandemic, the temporary increase to SNAP benefits reduced food insufficiency, but when emergency allotments ended, the decrease in benefits worsened food insufficiency.

SNAP provides important support to a diverse population of people with disabilities and their families that are disproportionately impacted by financial and food inequities.[39] In 2023, 16.5 percent of SNAP participants lived in a household with one or more non-elderly members with a disability.[40] Nearly 10 percent of SNAP recipients are non-elderly (under 60 years old) individuals with a disability.[41], [42]
Older adults age 58 and over receiving SSI reported that receiving SNAP improved their access to nutritious foods, helped their budgets, eased poverty-related stress, and reduced the labor needed to access food.[43] However, in the same study, they also reported challenges with fully utilizing their SNAP benefits due to barriers, such as a lack of healthy and affordable food options at nearby stores as well as the bodily demands and equipment required to purchase and prepare food.
People With Disabilities Face Challenges Accessing SNAP
Many people with disabilities have their food assistance taken away if they are not able meet strict work requirements. Although SNAP benefits are broadly available to all households meeting the income and asset requirements, two key aspects of the program limit access for people with disabilities.
Work Requirements Take Food Assistance Away From People With Disabilities
Specifically, one key accessibility issue is that the SNAP program has general work requirements which require many adults ages 16-59 to register for work, take a suitable job if offered, or participate in a SNAP Employment and Training program or workfare program if assigned by their state agency. In addition to these general work requirements, adults ages 18 to 64 not living with children under the age of 14 and not receiving disability benefits are limited to three months of SNAP benefits every three years. They can only receive benefits for longer if they are able to document that they are working or participating in a job training program for 20 hours a week, qualify for an exception, or live in an area where this requirement is waived. Research shows that work requirements decrease SNAP participation and disproportionately affect individuals with disabilities, and those who are Black, who experience ableist and racist structural barriers to educational and workplace opportunities.[44]
Work requirements in SNAP reflect policy assumptions that people should work to receive food assistance.[45] These requirements can make public benefit programs less accessible and more burdensome for people with disabilities who already face barriers in both accessing SNAP and working.[46] In one study, people who reported having a disability — who likely should have been exempt from the three-month time limit — lost SNAP at the same rate as people without a disability.[47] For many people with disabilities, structural barriers make securing and maintaining work particularly challenging, including inaccessible workplaces and transportation, limited access to reasonable accommodations, and discrimination in hiring practices. As a result, employment gaps often reflect external constraints rather than a lack of motivation to work. When SNAP policies presume work capacity unless individuals formally prove otherwise, these requirements can become barriers to assistance for people whose ability to work is limited by systemic inaccessibility.
This pattern reflects broader inequities: disabled people are more likely to experience economic insecurity and higher living and food costs due to inaccessible transportation, housing, and community environments.[48] Accessibility barriers in application systems, online portals, and verification processes — such as web pages lacking sufficient contrast, images lacking alternative text, and unlabeled buttons — mean food assistance program websites like SNAP are not consistently accessible and can further limit SNAP participation. This mirrors how inaccessible information and program design perpetuate exclusion in other social services.[49]
While SNAP includes some accommodations and exemptions intended to support participation by people with disabilities, including disability-related work requirement exemptions, special income and expense deductions, and broader eligibility pathways for households with disabled members (see Appendix D), their availability and accessibility vary widely across states.
States have substantial discretion in implementing exemptions, verification procedures, and accommodations. While some proactively identify and exempt individuals likely to qualify for disability-related protections, others place the burden on applicants to self-disclose disabilities and navigate complex medical documentation requirements. As a result, individuals may be unaware of available exemptions, face difficulties obtaining required medical verification, or encounter inaccessible application systems.[50] These challenges can cause eligible individuals to be incorrectly subject to work requirements, lose benefits, or abandon the application process. It is clear that policy protections do not always translate into meaningful accessibility and can add to the structural barriers people with disabilities face when seeking food assistance.
The Fiscal Responsibility Act of 2023 raised the age limit for work requirements from 49 to 54. The Republican reconciliation law enacted in July 2025 expanded the work requirement to older adults ages 55 to 64 and to parents and caregivers whose youngest child is at least 14 years old. This puts millions of individuals and the people they live with at risk of losing some or all of their food assistance.[51] Given that disabilities are more common as people age, the increased age limit will take food assistance away from more disabled people due to increased bureaucratic burdens.[52]
This policy change will disproportionately affect low-income populations, as evidence shows they experience an earlier aging process and greater likelihood of disability compared to groups with higher incomes.[53] Older adults are more likely to face age-related discrimination in the labor market; to no longer be able to perform the types of jobs they did when they were younger; or to have health conditions that may limit their ability to work, the types of jobs they can do, or their ability to consistently work enough hours. The prevalence of health conditions rapidly increases for adults with low incomes starting in their 40s, with nearly half of low-income adults ages 50 to 54 and half of low-income adults ages 55 to 64 reporting a health barrier to work. Older adults with incomes below twice the poverty line are three times more likely to have health conditions than those with incomes above this level.[54]
The 2025 harmful Republican reconciliation law included a major structural change to SNAP that requires most states to pay a share of SNAP food benefit costs — for many states, potentially hundreds of millions of dollars a year — for the first time in the program’s history, based on their payment error rate. States face a combined billions of dollars of new costs as a result of the shift of SNAP benefit costs to states.
States that can’t make up for these massive federal cuts by raising taxes or cutting other vital services will have to further cut SNAP, and they have limited options for doing so other than erecting access barriers, which will exclude more people with disabilities from SNAP. They may even withdraw from the program altogether, terminating food assistance for all low-income people in the state, including people with disabilities, as well as children, seniors, veterans, and other adults.
Narrow Definitions of Disability and Eligibility Rules Restrict Access to SNAP
A second key accessibility issue is that SNAP has a strict definition of disability that is narrower than the ADA’s, only considering individuals disabled if they receive state or federal disability benefits, such as SSI or SSDI (see Appendix B).[55] To further complicate matters, SNAP uses a different definition of disability to determine who is subject to time limits and work requirements. A person can be exempt from these requirements if they are medically certified as physically or mentally unfit for employment or if they are pregnant.
While this broader functional exemption standard can reduce the burden of work requirements for some individuals with disabilities, it also introduces additional documentation and administrative hurdles that can be difficult to navigate. Although adults with disabilities are less likely to be employed than those without disabilities, many do work and likely don’t apply for disability benefits.[56] Adults who do apply for disability benefits face a laborious determination process and can wait a year or more for a final decision.[57]
Currently, over 40 states use broad-based categorical eligibility rules for SNAP, which ease the income or asset requirements for households that include an adult receiving disability benefits.[58] In addition, these households can calculate income net of housing and medical costs rather than requiring their gross income to be below the limit. These policies reflect the recognition that disability-related costs and income instability warrant more flexible eligibility rules, particularly because households including an adult with a disability often face substantially higher costs of living than households without a disabled adult due to increased health care, transportation, and assistive service costs.[59] However, these flexible eligibility pathways are largely limited to individuals who formally receive disability benefits. Extending similar practices to people with disabilities who do not receive SSI or SSDI could address gaps in current eligibility systems and expand access to food assistance for people whose disability-related needs are not recognized by existing benefit definitions. Doing so would make SNAP more accessible and improve the food security of the millions of people with disabilities.
| TABLE 1 | ||||
|---|---|---|---|---|
SNAP’s Definition of Disability Is the Most Restrictive Disability among SNAP participants using SNAP Administrative Data, National Health Interview Survey Data, and the American Community Survey PUMS data | ||||
| Demographic Characteristics | SNAP Quality Control Data, 2023 (000s) | National Health Interview Survey Data, 2023 (000s) | American Community Survey PUMS microdata, 2023 (000s) | |
| Total Individuals Receiving SNAP (000s) | 40,065 | 47,371 | 48,531 | |
| Total Individuals Receiving SNAP With Disabilities (000s) | 3,973 | 19,488 | 11,914 | |
| Share of Individuals Receiving SNAP Who Have Disabilities | 10% | 41% | 25% | |
| Total Individuals Ages 0-59 Receiving SNAP (000s) | 32,258 | 23,888 | 40,071 | |
| Total Individuals Ages 0-59 Receiving SNAP With Disabilities (000s) | 3,973 | 10,924 | 7,234 | |
| Share of Individuals Ages 0-59 Receiving SNAP Who Have Disabilities | 12% | 46% | 18% | |
| Children Under 18 Receiving SNAP (000s) | 15,575 | 15,960 | 16,019 | |
| Children Under 18 Receiving SNAP With Disabilities (000s) | 585 | 4,128 | 1,287 | |
| Share of Children Receiving SNAP Who Have Disabilities | 4% | 26% | 8% | |
| Adults Ages 18-59 Receiving SNAP (000s) | 16,684 | 23,888 | 40,071 | |
| Adults Ages 18-59 Receiving SNAP With Disabilities (000s) | 3,388 | 10,924 | 7,234 | |
| Share of Adults Ages 18-59 Receiving SNAP Who Have Disabilities | 20% | 46% | 18% | |
| Adults Ages 60 and up Receiving SNAP (000s) | 7,807 | 7,523 | 8,460 | |
| Adults Ages 60 and up Receiving SNAP With Disabilities (000s) | n/a | 4,435 | 4,680 | |
| Share of Adults Ages 60 and up Receiving SNAP Who Have Disabilities | n/a | 59% | 55% | |
| Total Male Individuals Receiving SNAP, Including Children (000s) | 17,113 | 20,856 | 22,303 | |
| Total Male Individuals with Disabilities Receiving SNAP, Including Children (000s) | 1,958 | 8,726 | 5,273 | |
| Share of Male Individuals Receiving SNAP Who Have Disabilities | 11% | 42% | 24% | |
| Total Female Individuals Receiving SNAP, Including Children (000s) | 22,952 | 26,514 | 26,228 | |
| Total Female Individuals with Disabilities Receiving SNAP, Including Children (000s) | 2,015 | 10,762 | 6,641 | |
| Share of Female Individuals Receiving SNAP Who Have Disabilities | 9% | 41% | 25% | |
Notes: The differences in estimates of SNAP participants with disabilities between the SNAP QC, NHIS and ACS data shown above may be partly due to differences in how SNAP benefit receipt and disability are measured in each survey. In the ACS and NHIS, SNAP recipients are identified as anyone in a household who received SNAP benefits at any time in the past 12 months. In the SNAP QC data, SNAP participation is measured as the monthly average number of recipients in the year. Individuals are identified as disabled in the SNAP QC based on their receipt of certain disability-related benefits, whereas they are identified as disabled in the ACS and NHIS based on self-reported difficulty in performing certain functional activities (see Appendix E for details.) Changes in federal survey design and demographic coding may influence observed differences by gender. Source: CBPP Analysis of 2023 USDA Quality Control SNAP data, 2023 National Health Interview Survey data, and American Community Survey 2023 1-year Public Use Microdata Sample files. | ||||
| TABLE 2 | ||||||
|---|---|---|---|---|---|---|
Comparing of Disability Among SNAP Participants by Race/Ethnicity in the American Community Survey PUMS Data and National Health Interview Survey | ||||||
| American Community Survey PUMS Data, 2023 | National Health Interview Survey Data, 2023 | |||||
| Race/Ethnicity | Total Individuals Receiving SNAP (000s) | Total Individuals Receiving SNAP Who Have Disabilities (000s) | Share | Total Individuals Receiving SNAP (000s) | Total Individuals Receiving SNAP Who Have Disabilities (000s) | Share |
| Hispanic | 17,534 | 5,504 | 31% | 14,259 | 4,131 | 29% |
| White, Non-Hispanic | 11,003 | 2,639 | 24% | 18,976 | 9,815 | 52% |
| Black, Non-Hispanic | 2,321 | 486 | 21% | 10,281 | 4,320 | 42% |
| Asian, Non-Hispanic | 14,132 | 2,462 | 17% | 1,745 | 475 | 27% |
| American Indian and Alaska Native | 2,872 | 663 | 23% | 516 | 183 | 35% |
| Other | 670 | 160 | 24% | 1,594 | 564 | 35% |
| Total | 48,531 | 11,914 | 25% | 47,371 | 19,488 | 41% |
Notes: Estimates of SNAP participation by race and ethnicity from SNAP administrative data are not shown here because of a significant share of missing data on race/ethnicity in the survey dataset. 17 percent of survey respondents who reported participating in SNAP in the 2023 SNAP QC dataset did not report their race and ethnicity. Furthermore, the distribution of that missing data varies by state. Changes in federal survey design and demographic coding may influence observed differences by race and ethnicity. Source: CBPP Analysis of 2023 National Health Interview Survey data, and American Community Survey 2023 1-year Public Use Microdata Sample files. | ||||||
Opportunities to Strengthen SNAP’s Support of People With Disabilities
Although SNAP has been proven to improve food security, there are several barriers that limit SNAP’s potential to reduce food insecurity among people with disabilities. Importantly, people with disabilities still report experiencing food insecurity while receiving SNAP, suggesting changes to current SNAP policies are needed to better support disabled people. [60]
The harmful Republican reconciliation law, enacted in July 2025, made historic cuts to SNAP and takes food assistance away from an estimated 4 million people, including people with disabilities.[61] It includes provisions that will add administrative hurdles that make it harder for people to enroll and receive the assistance they need to put food on the table. There are several ways policymakers can improve SNAP’s support of people with disabilities:
- Repeal, or at a minimum, delay the SNAP cost shift. The new law will require most states to pay a share of SNAP food benefit costs — for many states, potentially hundreds of millions of dollars a year — for the first time in the program’s history. In the face of these massive new costs, states have a strong incentive to erect additional barriers to the program, taking away food assistance from people with disabilities and other people with low incomes, or even to end their SNAP programs entirely. At minimum, Congress should delay the cost-share requirement for food benefits for all states. While this would mitigate the immediate risk that low-income families lose food assistance due to the cost shift, this policy is fundamentally untenable and must be repealed.
- Roll back or eliminate work requirements that take food assistance away from people. There is growing evidence that SNAP work requirements create more barriers and decrease SNAP participation, including among adults with disabilities, without improving employment outcomes.[62] Households with disabled members still face a higher risk of food insecurity even if disabled members can work.[63] The expansion of work requirements to millions more people will likely have disproportionate negative impacts on the disability community, particularly among disabled individuals who face barriers to work but who do not qualify for an exception because they do not receive disability benefits. States should develop robust processes for identifying individuals who qualify for an exemption from the work requirement, such as having work-limiting health conditions. Ultimately, permanently eliminating work requirements is critical to protecting food security among disabled people.
- Update the existing definition of disability used to determine SNAP eligibility and benefits to be more inclusive. The existing definition excludes many people with severe and long-lasting disabilities. Those excluded range from veterans with service-related injuries that are rated at just under 100 percent to individuals who have not yet received an SSI/SSDI determination to children who are severely disabled but do not qualify for SSI due to their parents’ income or assets. These individuals would benefit significantly from the medical expense deduction and other provisions, as some have trouble affording food and may also have increased expenses due to their impairments. Unfortunately, if an individual is not considered disabled as defined in SNAP regulations, the state agency cannot provide them with those accommodations.
- Protect and improve accessibility of SNAP enrollment and recertification processes. State agencies are responsible for ensuring that all individuals with disabilities receive assistance in applying for the program and for providing reasonable accommodations to ensure administrative procedures are accessible. The 2025 Republican reconciliation law, which cuts federal funding for SNAP and shifts costs to states, puts pressure on states to add administrative hurdles and create barriers to SNAP in order to keep their costs down and reduce their error rates. But states can implement options and procedures that simplify the application process and help keep their costs down without creating additional complexities and barriers for people participating in the program. This includes making sure that websites, portals, and forms are accessible to people with disabilities.
Use SNAP’s existing rules to their full potential to maximize benefits for eligible people. While the medical expense deduction can help households with high medical costs obtain adequate benefits, it appears to be underutilized. Eligible households may not claim the deduction due to confusion or lack of awareness or state procedures and policies that can make the process unnecessarily cumbersome.[64] Some state SNAP applications do not appear to seek sufficient information from applicants to ensure that eligible households receive the full deduction. As a result, only 5.5 percent of the 3.8 million households with non-elderly disabled members claimed the medical deduction in 2023, though the share of these households with eligible expenses is likely much higher.[65] Often overlooked expenses typically not covered by health insurance include public and private transportation to obtain medical treatment and services, over-the-counter drugs recommended by health care providers, medical supplies (such as bandages, batteries for hearing aids, and walkers), and home modifications (such as shower seats, grab bars, hospital beds, wheelchair ramps, or chair lifts).
The medical expense deduction can have a significant impact on SNAP benefits. For those households with members with disabilities claiming the deduction, this deduction increases their benefits on average by 26 percent.[66] To simplify the process of documenting expenses, states can implement standard medical deduction demonstration projects, under which they deduct a standard amount (representing the average medical expenses for senior or disabled SNAP households) from all eligible households that demonstrate medical expenses of over $35 a month.
Improve cross-program coordination and look for opportunities to shift from opt-in to opt-out enrollment practices to increase SNAP participation. People participating in SNAP and disabled people often report experiencing stigma, which reduces their willingness to claim public benefits.[67] Pairing SNAP with other public benefits may help to reduce stigma and improve efficiency. Many households that include someone with disabilities are already known to have low incomes because household members receive Medicaid or other income-based benefits. According to an analysis of the 2018 Survey of Income and Program Participation, 44 percent of households with someone who has a work-limiting disability and 62 percent of households with someone who has a non-work-limiting disability are income-eligible but not participating in SNAP.[68]
Improving the efficiency in the application processes of other programs can enable more eligible disabled people to apply for and receive SNAP benefits.[69] For example, the Combined Application Project, implemented by 17 states, waives certain enrollment and documentation requirements for SSI recipients who have already provided documentation to the Social Security Administration.[70] The Combined Application Project represents an important SNAP enrollment pathway for disabled people. Improved coordination across government departments and agencies could reduce the SNAP enrollment burden for people with disabilities.
It is important to note, however, that the strict medical criteria to qualify for SSI and SSDI exclude many people with disabilities, including those with temporary or episodic disabilities. Additionally, there is likely a compounding effect of the gaps in SNAP and other government programs. Not everyone who qualifies for benefits like SSI or SSDI receives them, and there are opportunities to improve supports for disabled people across all government programs.[71] SNAP’s reliance on the receipt of other disability payments eliminates the need for applicants to again prove they have a disability, but there is still room for improvement to enable many more households with disabled members to afford food and meet their basic needs.
- Protect SNAP eligibility and benefits for caregivers of people with disabilities. SNAP does not include eligibility accommodations for people who have caregiving responsibilities for people with disabilities. For example, family members may have to reduce their hours or quit their jobs to provide needed assistance and care for those with disabilities. Caregivers of children with medical complexity report facing financial challenges, which are exacerbated by the cost of care for their children’s medical conditions.[72] Ultimately, supporting caregivers of disabled people improves the health outcomes of disabled people under their care. However, the 2025 Republican reconciliation law expanded SNAP work requirements to older adults ages 55 to 64 and, for the first time, parents and caregivers of older children ages 14 to 17. This will take food assistance away from caregivers of people with disabilities unless they can document that they are working 80 hours a month. It is also important to note that one-third of caregivers have disabilities themselves, but they are an understudied population.[73] Similarly, parents with disabilities likely have unmet needs which are also under-researched. Future research must focus on disabled caregivers and parents to understand their specific experiences and issues related to food and nutritional security.
- Allow SNAP benefits to be used to purchase hot and/or prepared foods. Disabled people who experience challenges with food access and may have limitations with daily activities may benefit from being allowed to purchase prepared foods.[74] For example, people with disabilities may have difficulties with preparing their own foods or may want to stretch prepared foods across multiple meals. However, the arbitrary restriction on allowable foods prevents disabled people from accessing options that would help them feed themselves.
- Expand the SNAP Online Purchasing Pilot. The SNAP Online Purchasing Pilot (OPP) program, which has been implemented in all 50 U.S. states and the District of Columbia, demonstrates the potential to improve food access for SNAP households, including those with disabled members.[75] There is evidence that online purchasing reduced food insufficiency,[76] however, to maximize its impact on people with disabilities, the program should be expanded to cover the cost of delivery and other transaction fees. These changes will allow disabled people who experience transportation barriers to obtain food from stores in their communities. Most SNAP households that purchased food online only shopped online intermittently, suggesting that online purchasing can help with short-term illness or disability.[77] Support for the SNAP OPP must continue, and efforts should be made to strengthen the program to meet the needs of disabled people.
- Work closely with the disability community to include a diversity of disabled people’s perspectives. A key principle of disability justice is that those most impacted should lead the development and revision of federal nutrition guidelines, programs, and policies to better serve the needs of this population.[78] Given the disability community has been historically marginalized and excluded from equitable engagement and access to federal supports, ongoing efforts to improve SNAP must center disabled voices to ensure that changes to SNAP are effective and reflective of the disability community’s needs.
Appendix A: Defining Disability for Government Assistance
Federal disability assistance programs use a variety of criteria to determine eligibility for benefits on the basis of disability. (Some programs also have additional eligibility criteria, such as income and/or asset eligibility criteria, in addition to the requirements discussed here.)
SSI provides income to people with disabilities and elderly people who have low incomes and few assets, while SSDI replaces lost income for people with substantial work history. Both programs provide benefits to individuals whose disability limits their ability to work. (See Appendix C for details.)
The stringent criteria set forth in the Social Security Act for SSI and SSDI require a severe physical or mental impairment that’s expected to last at least 12 months or result in death. The impairment must prevent individuals from performing any significant work and make them unable to do not just their past work, but any other kind of work (considering their age, education, and work experience), regardless of whether that work exists in the immediate area or whether they would be hired. For children under age 18, individuals must have “a medically determinable physical or mental impairment, which results in marked and severe functional limitation,” also expected to last at least 12 months or result in death.
Moreover, to be eligible for SSDI, applicants must have worked for at least one-fourth of their adult lives and in at least five of the last ten years and must have had a disability for at least five months.
- Veterans with disabilities resulting from a disease or injury during active military service, or with post-service disabilities related to their time in service, can qualify for disability compensation. The benefit depends on the degree of the disability, rated on a scale from 10 to 100 percent (in increments of 10 percent) based on medical evidence. Individuals whose rating is less than 100 percent, but whom the agency judges to be unable to work, can also receive compensation at the 100 percent rate based on what is known as “individual unemployability.” Only veterans with a 100 percent disability rating or who are paid at the 100 percent rate — that is, those whose impairment is severe enough to make it impossible to earn a livelihood with earnings comparable to others in the same occupation in the community — qualify as disabled for SNAP purposes.
- Individuals under age 65 may be eligible for Medicaid if they are disabled according to the Social Security definition of disability. In addition, individuals who receive Social Security or SSI because they are disabled are considered to meet the disability requirement for Medicaid. In most states, SSI recipients are automatically eligible for Medicaid and do not need to fill out a separate application.
- The Food and Nutrition Act considers a person as disabled for the purpose of determining SNAP eligibility and benefits if the person receives any of several disability benefits, including SSI, SSDI, veterans’ disability compensation (but only for those with 100 percent disability ratings), and disability-related Medicaid (see Appendix B for a complete listing).
- SNAP’s reliance on the receipt of other disability payments means applicants do not have to prove once again that they have a disability. Another government office has already made that determination, reducing the burden on both applicants and caseworkers. The SNAP policy, however, excludes many people with disabilities that limit work but do not meet other programs’ strict medical criteria, including those with temporary or episodic impairments. Under SNAP’s recently expanded work requirement, many individuals can only receive SNAP for three months in a three-year period unless they can document they are working for 80 hours a month or qualify for an exemption, such as being “unable to work due to a physical or mental limitation.” However, evidence suggests that individuals are not adequately screened in a way to reliably identify those who are “unable to work.”[79] SNAP policy also excludes individuals who qualify for assistance but have yet to complete the application process for disability benefits and those awaiting a decision on their application.
Appendix B: Defining Disability for SNAP
SNAP considers a person as “disabled” if they receive one of the following forms of disability benefits:
- Supplement Security Income (SSI);
- Social Security disability or blindness benefits;
- state disability or blindness payments based on SSI rules;
- disability retirement benefits from a government agency because of a permanent disability under section 221(i) of the Social Security Act;
- Railroad Retirement disability payments;
- disability-related Medicaid;
- veterans’ disability benefits for service-connected disabilities or non-service-connected disabilities rated or paid as total;
- veterans’ benefits for surviving spouse or children of veterans whom the VA considers permanently disabled;
- disability-related state-funded General Assistance, if eligibility is based on criteria as stringent as SSI;
- interim assistance pending receipt of SSI (cash assistance provided by state and local welfare agencies for individuals awaiting SSI eligibility determination);
- a state SSI supplement (regardless of whether the individual receives federal SSI);
- public disability retirement pensions (if the individual has the kind of disability that Social Security considers long-lasting);
- veterans’ disability benefits or disability benefits for the spouse of a veteran, if the Department of Veterans Affairs (VA) has determined that the veteran or spouse is permanently housebound or needs regular care; and/or
veterans’ pensions for surviving spouses and children of veterans, if the spouse or child has a disability that Social Security considers long-lasting.
SNAP’s definition of disability, for purposes of receiving special consideration within the program, does not cover all individuals who may have disabilities. It excludes:
- individuals with temporary disabilities who are unable to work but are not receiving disability-related benefits;
- individuals with disabilities who have not yet received an SSI/SSDI determination and are not receiving interim assistance;
- individuals with disabilities that are serious but not severe enough to be considered long-lasting or do not qualify for a disability determination, such as veterans receiving less than total disability compensation; and
- children who do not qualify for SSI due to the income or assets of their parents yet are otherwise severely disabled in accordance with the SSI severity standard.
Appendix C: Major Basic Needs Programs Available to People With Disabilities
Millions of individuals with disabilities and their families benefit from a wide variety of basic needs programs for income, health care, and food and housing assistance. Some of these benefits target people with disabilities; others are available more broadly to some or all households with low incomes but may be especially important to people with disabilities.
Income Support
- Supplemental Security Income (SSI) provides income to meet the basic needs of blind, disabled, and elderly people with low incomes and few resources. To qualify for SSI, individuals under age 65 must have a physical or mental impairment classified as severe and that’s expected to last at least one year or result in death. The impairment must be determined to prevent them from performing any substantial gainful activity and make them unable to do not just their past work, but any other kind of work (considering their age, education, and work experience), regardless of whether that work exists in the immediate area or whether they would be hired. Over 6.1 million people with disabilities received benefits through SSI in 2024.[80]
- Social Security Disability Insurance (SSDI) replaces part of the earnings of workers who can no longer support themselves because of a severe and long-lasting disability. Workers are eligible for SSDI if they have a medical condition expected to last at least one year or result in death, if they have worked a set number of years before the onset of their disability (dependent on the age of onset), and if they have paid Social Security taxes. While some low-income people with disabilities may receive benefits from both SSDI and SSI, their SSI benefits are reduced to account for the SSDI benefits. Additionally, benefits cannot begin until at least five months after the onset of disability and disabled people can wait a year or more for final decisions on their claims.90
- Veterans Disability Compensation is available to veterans — and their surviving spouses, children, or parents — with injuries that occurred during, or were made worse by, their military service. Veterans’ compensation payments increase with the severity of the service-related disability.
Other disability payments include workers’ compensation, private disability insurance, payments made by employers, and federal or state disability available to government employees.
Health Care
- Medicare provides access to health care services for disabled people in the U.S. who have received SSDI for at least 24 months. As of 2022, about 8 million people under age 65 with disabilities rely on Medicare for their health coverage, representing roughly 12 percent of all Medicare beneficiaries.[81]
Medicaid provides health coverage for individuals and families with low incomes and few resources who receive SSI. In addition, most states use at least one option to provide health care for some people with disabilities whose income and resources exceed SSI limits, including long-term care in some cases. For example, over 20 states provide Medicaid to people with disabilities with income below the poverty line but above the SSI limits. Almost every state provides coverage for children with severe disabilities living at home to receive care, without requiring their parents’ income to meet Medicaid income standards. And over 40 states allow individuals with severe disabilities who require long-term care with income above SSI limits to qualify for Medicaid.[82] More than 9 million children and adults with disabilities rely on Medicaid for their health coverage.[83]
Housing
- The Section 811 Supportive Housing for People with Disabilities program provides affordable, accessible housing for non-elderly, very low-income people with significant disabilities. Section 811 housing is typically integrated into larger affordable housing apartment buildings and is linked with voluntary supports and services. Tenants pay 30 percent of their adjusted income for rent, which ensures affordability for people who receive SSI.
- The Section 8 Housing Choice Voucher program helps very low-income families, the elderly, and people with disabilities afford rental housing in the private market. About 1 in 3 households using Section 8 vouchers are headed by a non-elderly (under age 62) person with a disability. Availability is limited and applicants may be on waiting lists for years.
Public housing provides housing to low-income families in which the head or spouse has at least one of six functional impairments. About 1 in 5 households living in public housing are headed by a non- elderly (under age 62) person with a disability. Tenants must be low income and typically pay 30 percent of their income for rent. Availability is limited and applicants may be on waiting lists for years.
Vocational Rehabilitation and Employment Services
- State vocational rehabilitation services provide counseling, job training, and job search assistance related to the employment of people with disabilities.
- Vocational Rehabilitation and Employment for Veterans is an entitlement program that provides job training and other employment-related services to veterans with service-connected disabilities. Its comprehensive services enable veterans with service-connected disabilities and employment handicaps to become employable and maintain suitable employment.
Appendix D: SNAP Features That Help People With Disabilities
SNAP’s structure and rules allow it to respond to the economic challenges faced by many people with disabilities. SNAP is an entitlement program, meaning that all applicants who meet the eligibility requirements can receive the benefits for which they qualify. SNAP also has several provisions for households with members with disabilities (where disability is defined by the receipt of other government disability benefits, see Appendix B):
- While most households must meet both a gross income test (of 130 percent of the federal poverty level) and a net income test (100 percent of the federal poverty level), a household with a person with disabilities need not meet the gross income test. This benefits households with high disability-related expenses.
- In states whose SNAP eligibility rules include an asset limit, households that include a person with disabilities can have up to $4,500 in countable resources, $1,500 more than households without an elderly or disabled member. Because SSI imposes a lower asset test, the assets of SSI recipients are not counted. In addition, the value of vehicles used to transport physically disabled household members is not counted. Every state has made use of its flexibility to apply less restrictive vehicle asset rules than those in federal law.
- Achieving a Better Life Experience (ABLE) accounts are not counted as income or resources. These tax-favored savings accounts provide secure funding for disability-related expenses on behalf of designated beneficiaries disabled before age 26.
- Households in which all members receive SSI are categorically eligible for SNAP, meaning they are considered to have met both income and asset tests. These households may also apply for SNAP at their local Social Security office. Combined Application Projects in 17 states enables the automatic SNAP enrollment of elderly or disabled SSI recipients who live alone. These projects allow seniors and people with disabilities to use a simplified application for a standard SNAP benefit without going to a SNAP office.[84]
- Individuals who are elderly and disabled and unable to purchase and prepare food on their own because of a substantial disability may apply as a separate household if the gross monthly income of other household members is less than 165 percent of the federal poverty level.
- People with disabilities can deduct out-of-pocket medical expenses (including the cost of caregivers) that exceed $35 per month from the income used to calculate eligibility and benefits. The Standard Medical Deduction demonstration in 25 states streamlines the calculation of this deduction by establishing a standard amount in lieu of actual medical expenses; households retain the option to claim actual medical expenses if those are higher than the standard. In addition, households with disabled individuals can deduct all shelter costs exceeding half their income after other deductions.
- Applicants with disabilities can designate an authorized representative to apply on their behalf. In most cases, applicants may apply online, request a phone interview, or request a home visit.
- People with disabilities who live in certain small, nonprofit group homes may be eligible for SNAP benefits even if the group home prepares their meals for them.
- Households in which all members are elderly or disabled can be certified for up to 24 months, rather than 12 months, with some contact with the household required after 12 months.
- Lawfully present non-citizens receiving disability-related assistance are eligible for SNAP, regardless of whether they have resided in the U.S. for at least five years.
- An unemployed SNAP recipient with a disability is exempt from SNAP’s work requirement and is not required to register for work.
Federal, state, and local agencies are also required to ensure that services are accessible to people with disabilities. The Food and Nutrition Act, which authorizes SNAP, requires state agencies to comply with relevant civil rights law in administering the program, including the Americans with Disabilities Act and Section 504 of the Rehabilitation Act of 1973. For example, state agencies must ensure that SNAP applications are accessible to individuals with disabilities.
Appendix E: Measuring Disability in National Surveys
Measures of disability vary across surveys due to differences in definitions and methods. Many ongoing national surveys, including the American Community Survey (ACS), Current Population Survey (CPS), Survey of Income and Program Participation (SIPP), and Behavioral Risk Factor Surveillance System (BRFSS), have adopted the ACS-6 standard, a six-question set used by the U.S. Department of Health and Human Services to identify functional and physical limitations associated with disability. The National Health Interview Survey (NHIS) incorporated the ACS-6 standard until 2018, after which it switched to the Washington Group Short Set (WG-SS) questions.[85]
The analyses in this report use data from three sources: the NHIS, SNAP household characteristics data from the Quality Control (QC) system, and the ACS Public Use Microdata Sample (ACS PUMS), described below.
ACS-6
The ACS-6 is a set of six questions on disability that was developed by the U.S. Department of Health and Human Services (HHS). These questions are used in national surveys, such as the BRFSS and ACS. HHS considers these questions to be the minimum standard for survey questions assessing disability:[86]
- Are you deaf, or do you have serious difficulty hearing?
- Are you blind, or do you have serious difficulty seeing, even when wearing glasses?
- Because of a physical, mental, or emotional condition, do you have serious difficulty concentrating, remembering, or making decisions?
- Do you have serious difficulty walking or climbing stairs?
- Do you have difficulty dressing or bathing?
- Because of a physical, mental, or emotional condition, do you have difficulty doing errands alone such as visiting a doctor's office or shopping?
Respondents to these questions answer “yes” or “no.” Questions 3 through 5 are asked of survey participants 5 years and older, while question 6 is asked of survey participants 15 years and older. These questions are aligned with the conceptual framework for disability development by the World Health Organization.[87]
WG-SS
The Washington Group Short Set on Functioning (WG-SS) is a set of six questions on disability that was developed and tested by the Washington Group on Disability Statistics, an organization focused on the development of suitable disability statistics.[88] These questions are used in the NHIS.[89] WG recommends six core questions to identify disabilities in individuals:
- Vision: Do you have difficulty seeing, even when wearing glasses?
- Hearing: Do you have difficulty hearing, even when using hearing aids?
- Mobility: Do you have difficulty walking or climbing steps?
- Cognition: Do you have difficulty remembering or concentrating?
- Self-care: Do you have difficulty with self-care, such as washing all over or dressing?
- Communication: Using your usual language, do you have difficulty communicating, for example understanding or being understood?
Respondents to these questions rank their level of difficulty in performing these tasks, whether they have “no difficulty,” “some difficulty,” “a lot of difficulty” completing those, or they “cannot do [them] at all.”[90] These questions are designed to identify disability among individuals 5 years and older. As seen below, national surveys vary how they adopt the WG-SS questions or customize to measure disability.
However, these six questions do not adequately capture all people with disabilities or the diversity of the disability community. For example, these questions do not capture people with psychiatric disabilities or chronic conditions, or neurodivergent/diverse people.
NHIS
The NHIS collects annual data on the health of the civilian non-institutionalized population in the United States.[91] It uses slightly modified versions of the WG-SS questions, with separate set of questions for adults, children 2 to 4 years of age, and children 5 to 17 years old. These questions feature the same difficulty ratings as featured in the WG-SS. In the NHIS, people are determined to be disabled if they indicate that they “cannot do at all” or have “a lot of difficulty [with]” the disability-related tasks described in their respective set of questions.[92] People who report that they have “some” or “no” difficulty are not considered to have a disability. In our analysis, we expanded the definition of disability for adults by including any who report: 1) having a work-limiting disability; 2) receiving SSI or SSDI (for adults younger than 60 years of age); or 3) receiving a veteran service-connected disability rating.
In the NHIS dataset, disability is indicated in adults by the person-level variable named DISAB3_A. This variable captures survey responses to the six WG-SS core questions about disability. In our analysis, we also included as part of the disability indicator the person-level variables INCSSISSDI_A, SOCWRKLIM_A, and VADISB_A, which capture survey responses to SSI/SSDI receipt, work-limiting disability, and veteran disability rating, respectively.
Disability is determined in children in the NHIS based on a positive response to identical questions about hearing, vision, and learning ability in all children; to positive responses to questions about mobility, motor skills, communication, and behavior in children 2 to 4 years old; and to positive responses to questions about mobility, motor skills, communication, cognition, behavior, and emotional health in children 5 to 17 years old. We also expanded the definition of disability by including children whose families received SSI or SSDI. Disability is not measured in the NHIS for children under the age of 2, so they are excluded from the NHIS dataset for this analysis.
In the NHIS, SNAP recipients are identified as individuals in families that received SNAP at some point in the last 12 months, unlike the SNAP QC data, which measures SNAP participation in an average month.
In the dataset, disability is indicated in children 2-4 years old by the person-level variable named DISAB2_C, which captures survey responses to ten questions about disability in children of that age range. In children 5-17 years old, disability is indicated by the variable DISAB5_C, which captures survey responses to 17 questions about disability in children in that age range. We also included as part of the disability indicator for both groups the variable INCSSISSDI_C, which captures whether the child is in a family that receives SSDI or SSI.
ACS PUMS
In the ACS, people with disabilities are identified based on affirmative responses to any of the six core questions about physical, mental, or sensory limitations. In the dataset, survey respondents who report having difficulty hearing, seeing, performing cognitive tasks, walking or climbing stairs, dressing or bathing, or doing errands on their own are considered to be disabled. Disability status is determined based on any of the six areas for individuals 15 years and older; for children between 5 and 14 years old, disability is determined based only on hearing, vision, cognitive, ambulatory, and self-care difficulty. For children under 5, only hearing and vision difficulty are used to determine disability. Unlike the NHIS, the ACS does not ask about disabilities that prevent or limit work. Additionally, the ACS is known to undercount the number of children with disabilities.[93]
We also expanded the definition of disability by including individuals receiving SSI and who have a veteran service-connected disability rating. The survey does not ask about SSI receipt of children under 15 years of age.
SNAP participants are individuals in households who reported participating in SNAP at any point in the last year. These figures are likely conservative as the ACS survey data undercount the number of people who participate in anti-poverty programs.
Like the NHIS, the ACS measures SNAP participants as individuals in households that have received SNAP at any point in the last year. This differs from how the SNAP QC measures SNAP participation. As a result, the ACS tends to undercount SNAP participation. In addition, unlike the SNAP administrative data, individuals 60 and older are included in the ACS disability estimates.
In the ACS dataset, disability is indicated in adults by the person-level variable named DIS. This variable captures the survey responses to the six ACS-6 core questions about disability. In our analysis, we also included as part of the disability indicator the person-level variable SSIP and DRATX, which capture survey responses to SSI receipt and veteran disability rating, respectively.
SNAP QC
The SNAP Quality Control (QC) system measures the accuracy of state eligibility and benefit determinations based on a sample of cases in every state. This sample is the basis of the SNAP QC data and is used to estimate SNAP participant characteristics in an average month.
SNAP QC data likely underestimate the number of people with disabilities who participate in SNAP. The data collected in the QC review do not directly identify people with disabilities, so USDA uses a set of proxy indicators to approximate the number of households and people with disabilities participating in SNAP. Generally speaking, disability is indicated in the dataset by receipt of disability-related benefits. The proxy indicators in the data have changed slightly over time in methodology, but beginning in 2015, they flag as disabled individuals under age 60 (1) with SSI income, (2) who worked less than 30 hours a week, were exempted from work registration due to disability, and received Social Security, veterans’ benefits, or workers’ compensation, (3) in a household with a medical expense deduction, no member 60 years old or older, and some indication of disability (such as work registration status, hours worked, or type of income received), or (4) in single-person households consisting of a non-elderly adult receiving Social Security. While similar indicators have been used to identify households with members with disabilities continuously, they are only used to identify individuals with disabilities (in addition to households) in some years (1998 through 2002, and 2007 through 2023). Individuals who may have disabilities but do not meet these conditions are not identified as such in the data. SNAP QC data also do not measure disability for individuals 60 years and older, unlike the NHIS and ACS.
As a result of the QC limitations, the USDA estimates on SNAP participation likely undercount individuals with a disability. They exclude elderly individuals who are more likely to have disabilities. Elderly individuals also receive the benefit of provisions for people with disabilities, which generally apply to both groups. For instance, individuals may receive SSDI until age 66, but they would not be counted as disabled in the SNAP administrative data.
In the SNAP QC dataset, the indexed person-level variable named DIS captures all the above-mentioned proxy indicators and is used in our analysis to count individuals with disabilities. The variable named FNSDIS indicates which households include individuals with disabilities.
Appendix F: State Tables
The following tables provide state estimates for the number of people with disabilities from two different sources based on different methods.
The first tables (Appendix Tables 1 and 2) present SNAP Quality Control (QC) data. As described in Appendix E, this survey uses a set of proxy indicators to identify individuals with disabilities, mostly based on receipt of government benefits (such as SSI) or a combination of receipt of certain government benefits (such as Social Security or workers’ compensation) with other, indirect indicators of disability (such as claiming an exemption from work requirements due to disability). These estimates do not identify elderly individuals with disabilities (60 years and older) and they miss individuals with disabilities who do not receive disability benefits, such as those with less severe or more episodic disabilities or those who are not applying for benefits.
The second set of tables (Appendix Tables 3 and 4) are based on CBPP analysis of the 2021, 2022, and 2023 American Community Survey (ACS) public use microdata sample (PUMS). This is a different data source than any of the national statistics given in this paper, which use National Health Interview Survey data or USDA’s SNAP QC data. While the NHIS provides the best source of disability data, it does not allow us to construct state-level estimates. These tables are intended to provide estimates of a broader group of individuals with disabilities in each state, similar to the group identified using the NHIS. Unlike Appendix Tables 1 and 2, these estimates identify elderly individuals with disabilities. We produced the ACS estimates by combining three years of data from 2021 through 2023, due to small sample sizes at the state level.
| APPENDIX TABLE 1 | ||||
|---|---|---|---|---|
Households With Non-Elderly Members with Disabilities Participating in SNAP in an Average Month and Average Monthly Benefits, SNAP 2023 Administrative Data | ||||
| State | SNAP households | SNAP households with a non-elderly member with a disability | Share of SNAP households that include a non-elderly member with a disability | Average monthly SNAP benefit per household with a non-elderly member with disabilities |
| Alabama | 388,000 | 86,000 | 22% | $285 |
| Alaska | 13,000 | 2,200 | 17% | $501 |
| Arizona | 425,000 | 47,000 | 11% | $258 |
| Arkansas | 121,000 | 36,000 | 30% | $264 |
| California | 2,861,000 | 282,000 | 10% | $247 |
| Colorado | 293,000 | 29,000 | 10% | $248 |
| Connecticut | 223,000 | 43,000 | 19% | $291 |
| Delaware | 58,000 | 9,000 | 16% | $273 |
| District of Columbia | 82,000 | 12,000 | 15% | $209 |
| Florida | 1,624,000 | 268,000 | 17% | $282 |
| Georgia | 755,000 | 130,000 | 17% | $258 |
| Guam | 12,000 | * | n/a | $438 |
| Hawai'i | 72,000 | 10,000 | 14% | $556 |
| Idaho | 61,000 | 15,000 | 25% | $205 |
| Illinois | 1,074,000 | 168,000 | 16% | $262 |
| Indiana | 277,000 | 66,000 | 24% | $274 |
| Iowa | 130,000 | 32,000 | 25% | $227 |
| Kansas | 87,000 | 22,000 | 25% | $247 |
| Kentucky | 245,000 | 52,000 | 21% | $305 |
| Louisiana | 435,000 | 82,000 | 19% | $281 |
| Maine | 93,000 | 25,000 | 27% | $246 |
| Maryland | 325,000 | 56,000 | 17% | $260 |
| Massachusetts | 642,000 | 128,000 | 20% | $284 |
| Michigan | 748,000 | 175,000 | 23% | $241 |
| Minnesota | 231,000 | 48,000 | 21% | $183 |
| Mississippi | 193,000 | 47,000 | 24% | $269 |
| Missouri | 306,000 | 76,000 | 25% | $307 |
| Montana | 42,000 | 10,000 | 24% | $236 |
| Nebraska | 75,000 | 14,000 | 19% | $247 |
| Nevada | 255,000 | 29,000 | 11% | $257 |
| New Hampshire | 38,000 | 12,000 | 32% | $297 |
| New Jersey | 307,000 | 53,000 | 17% | $315 |
| New Mexico | 243,000 | 32,000 | 13% | $264 |
| New York | 1,581,000 | 260,000 | 16% | $265 |
| North Carolina | 792,000 | 141,000 | 18% | $247 |
| North Dakota | 22,000 | 5,000 | 23% | $261 |
| Ohio | 711,000 | 187,000 | 26% | $266 |
| Oklahoma | 328,000 | 66,000 | 20% | $243 |
| Oregon | 400,000 | 53,000 | 13% | $201 |
| Pennsylvania | 940,000 | 212,000 | 23% | $313 |
| Rhode Island | 85,000 | 21,000 | 25% | $279 |
| South Carolina | 268,000 | 52,000 | 19% | $259 |
| South Dakota | 34,000 | 9,000 | 26% | $295 |
| Tennessee | 366,000 | 79,000 | 22% | $293 |
| Texas | 1,514,000 | 249,000 | 16% | $301 |
| Utah | 77,000 | 14,000 | 18% | $243 |
| Vermont | 41,000 | 11,000 | 27% | $307 |
| Virgin Islands | 10,000 | * | n/a | $183 |
| Virginia | 425,000 | 82,000 | 19% | $198 |
| Washington | 506,000 | 102,000 | 20% | $209 |
| West Virginia | 156,000 | 35,000 | 22% | $233 |
| Wisconsin | 367,000 | 73,000 | 20% | $218 |
| Wyoming | 14,000 | 4,000 | 29% | $242 |
| United States | 21,375,000 | 3,753,000 | 18% | $266 |
Note: Due to rounding, individual state totals may not add up to the U.S. total. Non-elderly individuals are under 60 years of age. Guam and the Virgin Islands’ estimates of SNAP households with a disabled member have been excluded due to small sample sizes but are included in the totals. Source: CBPP analysis of U.S. Agriculture Department 2023 SNAP Quality Control data | ||||
| APPENDIX TABLE 2 | |||||
|---|---|---|---|---|---|
Non-Elderly Individuals With Disabilities Participating in SNAP by State in an Average Month, SNAP 2023 Administrative Data | |||||
| State | Non-elderly SNAP participants with a disability | Non-elderly SNAP participants | Share of non-elderly SNAP participants with a disability | SNAP participants | Share of SNAP participants with a disability |
| Alabama | 91,000 | 653,000 | 14% | 768,000 | 12% |
| Alaska | 2,300 | 24,000 | 10% | 29,000 | 8% |
| Arizona | 49,000 | 733,000 | 7% | 870,000 | 6% |
| Arkansas | 38,000 | 201,000 | 19% | 233,000 | 16% |
| California | 293,000 | 3,587,000 | 8% | 4,918,000 | 6% |
| Colorado | 31,000 | 460,000 | 7% | 551,000 | 6% |
| Connecticut | 45,000 | 289,000 | 16% | 381,000 | 12% |
| Delaware | 10,000 | 95,000 | 10% | 115,000 | 9% |
| District of Columbia | 12,000 | 108,000 | 11% | 133,000 | 9% |
| Florida | 296,000 | 2,193,000 | 14% | 2,900,000 | 10% |
| Georgia | 134,000 | 1,284,000 | 10% | 1,514,000 | 9% |
| Guam | * | 29,000 | n/a | 34,000 | n/a |
| Hawai'i | 10,000 | 97,000 | 10% | 129,000 | 8% |
| Idaho | 16,000 | 105,000 | 15% | 122,000 | 13% |
| Illinois | 171,000 | 1,602,000 | 11% | 1,970,000 | 9% |
| Indiana | 71,000 | 515,000 | 14% | 572,000 | 12% |
| Iowa | 34,000 | 224,000 | 15% | 260,000 | 13% |
| Kansas | 23,000 | 150,000 | 16% | 174,000 | 13% |
| Kentucky | 56,000 | 455,000 | 12% | 530,000 | 11% |
| Louisiana | 87,000 | 753,000 | 12% | 874,000 | 10% |
| Maine | 27,000 | 117,000 | 23% | 156,000 | 17% |
| Maryland | 61,000 | 495,000 | 12% | 611,000 | 10% |
| Massachusetts | 137,000 | 822,000 | 17% | 1,042,000 | 13% |
| Michigan | 183,000 | 1,138,000 | 16% | 1,388,000 | 13% |
| Minnesota | 50,000 | 374,000 | 13% | 447,000 | 11% |
| Mississippi | 49,000 | 333,000 | 15% | 384,000 | 13% |
| Missouri | 82,000 | 529,000 | 15% | 621,000 | 13% |
| Montana | 11,000 | 67,000 | 16% | 82,000 | 13% |
| Nebraska | 14,000 | 130,000 | 11% | 150,000 | 10% |
| Nevada | 32,000 | 408,000 | 8% | 482,000 | 7% |
| New Hampshire | 13,000 | 57,000 | 23% | 69,000 | 19% |
| New Jersey | 58,000 | 476,000 | 12% | 605,000 | 10% |
| New Mexico | 33,000 | 385,000 | 9% | 449,000 | 7% |
| New York | 280,000 | 1,921,000 | 15% | 2,713,000 | 10% |
| North Carolina | 152,000 | 1,299,000 | 12% | 1,546,000 | 10% |
| North Dakota | 5,000 | 36,000 | 14% | 42,000 | 12% |
| Ohio | 200,000 | 1,125,000 | 18% | 1,358,000 | 15% |
| Oklahoma | 69,000 | 581,000 | 12% | 655,000 | 10% |
| Oregon | 54,000 | 531,000 | 10% | 673,000 | 8% |
| Pennsylvania | 227,000 | 1,381,000 | 16% | 1,744,000 | 13% |
| Rhode Island | 21,000 | 104,000 | 20% | 138,000 | 15% |
| South Carolina | 54,000 | 433,000 | 13% | 530,000 | 10% |
| South Dakota | 9,000 | 61,000 | 15% | 70,000 | 13% |
| Tennessee | 83,000 | 615,000 | 14% | 713,000 | 12% |
| Texas | 264,000 | 2,862,000 | 9% | 3,377,000 | 8% |
| Utah | 15,000 | 133,000 | 11% | 151,000 | 10% |
| Vermont | 11,000 | 52,000 | 21% | 70,000 | 16% |
| Virgin Islands | * | 17,000 | n/a | 21,000 | n/a |
| Virginia | 86,000 | 678,000 | 13% | 817,000 | 11% |
| Washington | 106,000 | 697,000 | 15% | 871,000 | 12% |
| West Virginia | 38,000 | 233,000 | 16% | 285,000 | 13% |
| Wisconsin | 77,000 | 586,000 | 13% | 700,000 | 11% |
| Wyoming | 4,000 | 26,000 | 15% | 29,000 | 14% |
| United States | 3,973,000 | 32,258,000 | 12% | 40,065,000 | 10% |
Note: Due to rounding, individual state totals may not add up to the U.S. total. Non-elderly individuals are under 60 years of age. Guam and the Virgin Islands’ estimates of SNAP households with a disabled member have been excluded due to small sample sizes but are included in the totals. Source: CBPP analysis of U.S. Agriculture Department 2023 Quality Control data | |||||
| APPENDIX TABLE 3 | |||
|---|---|---|---|
SNAP Participants With Disabilities by State, 2021-2023 three-year average, American Community Survey Public Use Microdata Sample | |||
| State | Individuals in households receiving SNAP over past year | Individuals with a disability in households receiving SNAP over past year | Share with disabilities |
| Alabama | 844,000 | 221,000 | 26% |
| Alaska | 96,000 | 23,000 | 24% |
| Arizona | 1,020,000 | 211,000 | 21% |
| Arkansas | 359,000 | 105,000 | 29% |
| California | 6,082,000 | 1,223,000 | 20% |
| Colorado | 600,000 | 141,000 | 24% |
| Connecticut | 468,000 | 121,000 | 26% |
| Delaware | 140,000 | 30,000 | 21% |
| District of Columbia | 123,000 | 30,000 | 24% |
| Florida | 3,558,000 | 781,000 | 22% |
| Georgia | 1,707,000 | 386,000 | 23% |
| Guam | n/a | n/a | n/a |
| Hawai'i | 226,000 | 48,000 | 21% |
| Idaho | 183,000 | 48,000 | 26% |
| Illinois | 2,106,000 | 466,000 | 22% |
| Indiana | 733,000 | 193,000 | 26% |
| Iowa | 326,000 | 84,000 | 26% |
| Kansas | 240,000 | 67,000 | 28% |
| Kentucky | 712,000 | 208,000 | 29% |
| Louisiana | 995,000 | 245,000 | 25% |
| Maine | 174,000 | 63,000 | 36% |
| Maryland | 863,000 | 188,000 | 22% |
| Massachusetts | 1,144,000 | 307,000 | 27% |
| Michigan | 1,595,000 | 425,000 | 27% |
| Minnesota | 498,000 | 121,000 | 24% |
| Mississippi | 480,000 | 130,000 | 27% |
| Missouri | 713,000 | 199,000 | 28% |
| Montana | 103,000 | 30,000 | 29% |
| Nebraska | 183,000 | 46,000 | 25% |
| Nevada | 540,000 | 114,000 | 21% |
| New Hampshire | 104,000 | 29,000 | 28% |
| New Jersey | 1,023,000 | 211,000 | 21% |
| New Mexico | 542,000 | 125,000 | 23% |
| New York | 3,494,000 | 898,000 | 26% |
| North Carolina | 1,724,000 | 388,000 | 23% |
| North Dakota | 53,000 | 16,000 | 30% |
| Ohio | 1,703,000 | 476,000 | 28% |
| Oklahoma | 711,000 | 190,000 | 27% |
| Oregon | 810,000 | 215,000 | 27% |
| Pennsylvania | 2,083,000 | 589,000 | 28% |
| Rhode Island | 153,000 | 46,000 | 30% |
| South Carolina | 709,000 | 172,000 | 24% |
| South Dakota | 88,000 | 22,000 | 25% |
| Tennessee | 956,000 | 252,000 | 26% |
| Texas | 4,635,000 | 893,000 | 19% |
| Utah | 219,000 | 54,000 | 25% |
| Vermont | 66,000 | 24,000 | 36% |
| Virgin Islands | n/a | n/a | n/a |
| Virginia | 976,000 | 241,000 | 25% |
| Washington | 1,147,000 | 291,000 | 25% |
| West Virginia | 370,000 | 115,000 | 31% |
| Wisconsin | 768,000 | 190,000 | 25% |
| Wyoming | 37,000 | 10,000 | 27% |
| United States | 49,180,000 | 11,698,000 | 24% |
Note: These estimates are three-year annual averages for 2021, 2022, and 2023. State numbers may not add up to national total due to rounding. Estimates for Guam and the Virgin Islands are not available in the American Community Survey (ACS) Public Use Microdata Sample data. Source: CBPP analysis of U.S. Census Bureau's American Community Survey 2021, 2022, and 2023 1-year Public Use Microdata Samples | |||
| APPENDIX TABLE 4 | |||
|---|---|---|---|
Individuals With Disabilities Participating in SNAP, 2021-2023 three-year average, American Community Survey Public Use Microdata Sample | |||
| State | Individuals with a disability | Individuals with a disability in households receiving SNAP over past year | Share with disabilities |
| Alabama | 983,000 | 221,000 | 22% |
| Alaska | 120,000 | 23,000 | 19% |
| Arizona | 1,145,000 | 211,000 | 18% |
| Arkansas | 611,000 | 105,000 | 17% |
| California | 5,192,000 | 1,223,000 | 24% |
| Colorado | 798,000 | 141,000 | 18% |
| Connecticut | 508,000 | 121,000 | 24% |
| Delaware | 157,000 | 30,000 | 19% |
| District of Columbia | 89,000 | 30,000 | 34% |
| Florida | 3,553,000 | 781,000 | 22% |
| Georgia | 1,692,000 | 386,000 | 23% |
| Guam | n/a | n/a | n/a |
| Hawai'i | 225,000 | 48,000 | 21% |
| Idaho | 310,000 | 48,000 | 15% |
| Illinois | 1,767,000 | 466,000 | 26% |
| Indiana | 1,101,000 | 193,000 | 18% |
| Iowa | 480,000 | 84,000 | 18% |
| Kansas | 462,000 | 67,000 | 15% |
| Kentucky | 911,000 | 208,000 | 23% |
| Louisiana | 877,000 | 245,000 | 28% |
| Maine | 259,000 | 63,000 | 24% |
| Maryland | 849,000 | 188,000 | 22% |
| Massachusetts | 990,000 | 307,000 | 31% |
| Michigan | 1,635,000 | 425,000 | 26% |
| Minnesota | 782,000 | 121,000 | 15% |
| Mississippi | 607,000 | 130,000 | 21% |
| Missouri | 1,059,000 | 199,000 | 19% |
| Montana | 194,000 | 30,000 | 15% |
| Nebraska | 294,000 | 46,000 | 16% |
| Nevada | 506,000 | 114,000 | 23% |
| New Hampshire | 212,000 | 29,000 | 14% |
| New Jersey | 1,147,000 | 211,000 | 18% |
| New Mexico | 408,000 | 125,000 | 31% |
| New York | 2,859,000 | 898,000 | 31% |
| North Carolina | 1,707,000 | 388,000 | 23% |
| North Dakota | 115,000 | 16,000 | 14% |
| Ohio | 1,958,000 | 476,000 | 24% |
| Oklahoma | 801,000 | 190,000 | 24% |
| Oregon | 734,000 | 215,000 | 29% |
| Pennsylvania | 2,136,000 | 589,000 | 28% |
| Rhode Island | 177,000 | 46,000 | 26% |
| South Carolina | 907,000 | 172,000 | 19% |
| South Dakota | 140,000 | 22,000 | 16% |
| Tennessee | 1,204,000 | 252,000 | 21% |
| Texas | 4,342,000 | 893,000 | 21% |
| Utah | 408,000 | 54,000 | 13% |
| Vermont | 106,000 | 24,000 | 23% |
| Virgin Islands | n/a | n/a | n/a |
| Virginia | 1,332,000 | 241,000 | 18% |
| Washington | 1,198,000 | 291,000 | 24% |
| West Virginia | 388,000 | 115,000 | 30% |
| Wisconsin | 836,000 | 190,000 | 23% |
| Wyoming | 97,000 | 10,000 | 10% |
| United States | 51,365,000 | 11,698,000 | 23% |
Note: These estimates are three-year annual averages for 2021, 2022 and 2023. State numbers may not add up to national total due to rounding. Estimates for Guam and the Virgin Islands are not available in the American Community Survey (ACS) PUMS microdata. Source: CBPP analysis of U.S. Census Bureau's American Community Survey 2021, 2022 and 2023 1-year Public Use Microdata Sample data. | |||
Other versions of this report
End Notes
[1] Varshini Varadaraj is the Director of Research at the Johns Hopkins University (JHU) Disability Health Research Center (DHRC). Stacy Lu is an Assistant Professor at the University of Memphis who was a graduate research assistant at DHRC. Laura Samuel is an Associate Professor at JHU School of Nursing. Bonnielin Swenor is the Director and Founder of the JHU DHRC. Steven Carlson, who was a co-author of the 2017 report and provided feedback on this report, is a research analyst who previously directed the Office of Policy Support at the Agriculture Department's Food and Nutrition Service.
[2] Language used to refer to people with disabilities in this report includes person-first (i.e., person with a disability) and identity-first (i.e., disabled person) language to reflect the variation of perspectives in the disability community.
[3] CBPP analysis of 2023 Behavioral Risk Factor Surveillance System (BRFSS) data; see also “CDC Data Shows Over 70 Million U.S. Adults Reported Having a Disability,” Centers for Disease Control and Prevention, July 16, 2024, https://www.cdc.gov/media/releases/2024/s0716-Adult-disability.html.
[4] Nanette Goodman, Zachary Morris, Michael Morris, and Stephen McGarity, “The Extra Costs of Living with a Disability in the U.S. — Resetting the Policy Table,” National Disability Institute, October 2020, https://www.nationaldisabilityinstitute.org/wp-content/uploads/2020/10/extra-costs-living-with-disability-brief.pdf.
[5] Laura Samuel, Jiafeng Zhu, et al., “Food Insecurity Gaps in the Supplemental Nutrition Assistance Program Based on Disability Status,” Disability and Health Journal, Vol. 16, No. 4, October 2023, https://www.sciencedirect.com/science/article/abs/pii/S1936657423000535?via%3Dihub.
[6] Carmelo Masala and Donatella Petretto, “From Disablement to Enablement: Conceptual Models of Disability in the 20th Century,” Disability and Rehabilitation, Vol. 30, No. 17, 2008, https://pubmed.ncbi.nlm.nih.gov/18821191/.
[7] U.S. Department of Justice Civil Rights Division: ADA.gov, “Guide to Disability Rights Laws,” updated February 28, 2020, https://www.ada.gov/resources/disability-rights-guide/.
[8] U.S. Census Bureau, “How Disability Data are Collected from The American Community Survey,” updated November 21, 2021, https://www.census.gov/topics/health/disability/guidance/data-collection-acs.html.
[9] Centers for Disease Control and Prevention, “Disability Datasets,” updated April 3, 2025, https://www.cdc.gov/dhds/datasets/index.html.
[10] Centers for Disease Control and Prevention, “NHIS Questionnaires, Datasets, and Documentation,” accessed November 10, 2025, https://www.cdc.gov/nchs/nhis/documentation/index.html; Washington Group on Disability Statistics, “The Washington Group Short Set on Functioning (WG-SS),” October 11, 2022, https://www.washingtongroup-disability.com/question-sets/wg-short-set-on-functioning-wg-ss/.
[11] For further discussion on the measurement of disabilities, see Scott Landes et al., “Comparative performance of disability measures,” PLoS ONE, Vol. 20, No. 1, January 31, 2025, https://doi.org/10.1371/journal.pone.0318745; Scott Landes, Bonnielin Swenor, and Nastassia Vaitsiakhovich, “Counting disability in the National Health Interview Survey and its consequence: Comparing the American Community Survey to the Washington Group disability measures,” Disability and Health Journal, Vol. 17, No. 2, April 2024, https://www.sciencedirect.com/science/article/pii/S1936657423001358; Jean Hall et al., “Comparing Measures Of Functional Difficulty With Self-Identified Disability: Implications For Health Policy,” Health Affairs, Vol. 41, No. 10, October 2022, https://www.healthaffairs.org/doi/10.1377/hlthaff.2022.00395.
[12] NHIS does not measure disability for children under 2 years old, so they are excluded from the analyses in this report.
[13] The disability-related figures in this report deviate from federal standards of measuring disability. Typical standards of measuring disability capture individuals who report having difficulty with one of six functional limitations, as described in the WG-SS questions. The WG-SS questions are not the standard approach for measuring disability in the U.S. They do not identify disabled people with functional limitations beyond the six included, whose disabilities are intermittent, or who do not experience functional limitations. In addition, empirical evidence indicates that the WG-SS questions do not identify many disabled people who do have one of the six functional limitations included in the questions. Due to these data limitations, the results in this report are not generalizable to the disabled population in the U.S.
[14] dataindex.us, accessed November 10, 2025, https://dataindex.us/; Victoria Hunter Gibney and Cara Brumfield, “Federal Data Are Disappearing as Statistical Agencies Face Budget Cuts and Political Pressure,” CBPP, September 29, 2025, https://www.cbpp.org/research/poverty-and-inequality/federal-data-are-disappearing-as-statistical-agencies-face-budget.
[15] Gibney and Brumfield, op. cit.
[16] Centers for Disease Control and Prevention, “Disability and Health Data System (DHDS),” National Center on Birth Defects and Developmental Disabilities, Division of Human Development and Disability, accessed March 3, 2025, https://dhds.cdc.gov.
[17] CBPP analysis of 2023 Behavioral Risk Factor Surveillance System (BRFSS) data; “CDC Data Shows Over 70 Million U.S. Adults Reported Having a Disability,” Centers for Disease Control and Prevention, July 16, 2024, https://www.cdc.gov/media/releases/202 4/s0716-Adult-disability.html.
[18] Nanette Goodman, Bonnie O’Day, and Michael Morris, “Financial Capability of Adults With Disabilities,” National Disability Institute, 2017, https://www.nationaldisabilityinstitute.org/wp-content/uploads/2019/01/ndi-finra-report-2017.pdf.
[19] Varshini Varadaraj et al., “National Prevalence of Disability and Disability Types Among Adults in the US, 2019,” JAMA Network Open, Vol. 4, No. 10, https://doi:10.1001/jamanetworkopen.2021.30358; Rebecca Vallas, Kimberly Knackstedt, and Vilissa Thompson, “7 Facts About the Economic Crisis Facing People with Disabilities in the United States,” The Century Foundation, April 21, 2022, https://tcf.org/content/commentary/7-facts-about-the-economic-crisis-facing-people-with-disabilities-in-the-united-states/.
[20] Goodman, Morris, Morris, et al., op. cit.
[21] Joint Center for Housing Studies of Harvard University, “The State of the Nation's Housing 2022,” 2022, https://www.jchs.harvard.edu/sites/default/files/reports/files/Harvard_JCHS_State_Nations_Housing_2022.pdf; Sophie Mitra, Patricia Findley, and Usha Sambamoorthi, “Health Care Expenditures of Living With a Disability: Total Expenditures, Out-of-Pocket Expenses, and Burden, 1996 to 2004,” Archives of Physical Medicine and Rehabilitation, Vol. 90, No. 9, September 2009, https://pubmed.ncbi.nlm.nih.gov/19735781/.
[22] Tatjana Meschede, Kartik Trivedi, and Joe Caldwell, “Severe Housing and Neighborhood Inequities of Households With Disabled Members and Households in Need of Long-Term Services and Supports, Housing and Society, Vol. 50, No. 2, April 22, 2022, https://www.tandfonline.com/doi/abs/10.1080/08882746.2022.2065614; Goodman, O’Day, and Morris, op. cit.
[23] Susan Parish et al., “Material Hardship in U.S. Families Raising Children With Disabilities,” Exceptional Children, Vol. 75, No. 1, October 2008, https://journals.sagepub.com/doi/10.1177/001440290807500104.
[24] Rajan Anthony Sonik et al., “Parents With and Without Disabilities: Demographics, Material Hardship, and Program Participation,” Review of Disability Studies, Vol. 14, No. 4, December 2018, https://www.rdsjournal.org/index.php/journal/article/view/822.
[25] Dielle J. Lundberg and Jessica A. Chen, “Structural ableism in public health and healthcare: a definition and conceptual framework,” Lancet Regional Health – Americas, Vol. 30, February 2024, https://doi.org/10.1016/j.lana.2023.100650.
[26] Varadaraj et al., op. cit.
[27] Stella U. Ogunwole, “We the People: American Indians and Alaska Natives in the United States,” U.S. Census Bureau, February 2006, https://www.census.gov/content/dam/Census/library/publications/2006/dec/censr-28.pdf; Centers for Disease Control and Prevention, “Racial/Ethnic Disparities in Self-Rated Health Status Among Adults With and Without Disabilities — United States, 2004-2006,” updated October 3, 2008, https://www.cdc.gov/mmwr/preview/mmwrhtml/mm5739a1.htm.
[28] Madeline Reed-Jones, “Prevalence of food insecurity differs by disability status in 2023,” Economic Research Service, U.S. Department of Agriculture, November 12, 2024, https://www.ers.usda.gov/data-products/charts-of-note/chart-detail?chartId=110370; Matthew P. Rabbitt et al., “Household Food Security in the United States in 2024,” Economic Research Service, U.S. Department of Agriculture, December 30, 2025, https://www.ers.usda.gov/publications/113622.
[29] Reed-Jones, op. cit.; Sonik et al., op. cit.; Samuel, Zhu et al., op. cit.
[30] Kelly Balistreri, “Food Insufficiency and Children With Special Healthcare Needs,” Public Health Vol. 167, February 2019, https://pubmed.ncbi.nlm.nih.gov/30639804/; Arun Karpur et al., “Food Insecurity in the Households of Children With Autism Spectrum Disorders and Intellectual Disabilities in the United States: Analysis of the National Survey of Children’s Health Data 2016-2018,” Autism, Vol. 25, No. 8, November 2021, https://pubmed.ncbi.nlm.nih.gov/34075809/.
[31] Craig Gundersen and James Ziliak, “Food Insecurity And Health Outcomes,” Health Affairs, Vol. 34, No. 11, November 2015, https://doi.org/10.1377/hlthaff.2015.0645; Janice Stuff et al., “Household Food Insecurity is Associated With Adult Health Status,” Journal of Nutrition, Vol. 134, No. 9, September 2004, https://pubmed.ncbi.nlm.nih.gov/15333724/; Cindy Leung et al., “The Long-Term Effect of Food Insecurity During College on Future Food Insecurity,” American Journal of Preventive Medicine, Vol. 61, No. 6, December 2021, https://pubmed.ncbi.nlm.nih.gov/34452744/; Hilary Seligman et al., “Food Insecurity is Associated with Diabetes Mellitus: Results from the National Health Examination and Nutrition Examination Survey (NHANES) 1999–2002,” Journal of General Internal Medicine, Vol. 22, No. 7, April 11, 2007, https://www.ncbi.nlm.nih.gov/pmc/articles/PMC2583797/; Hilary Seligman, Barbara Laraia, and Margot Kushel, “Food Insecurity Is Associated with Chronic Disease among Low-Income NHANES Participants,” Journal of Nutrition, Vol. 140, No. 2, February 2010, https://www.ncbi.nlm.nih.gov/pmc/articles/PMC2806885/.
[32] Craig Gundersen and Brent Kreider, “Bounding the Effects of Food Insecurity on Children’s Health Outcomes,” Journal of Health Economics, Vol. 28, No. 5, September 2009, https://pubmed.ncbi.nlm.nih.gov/19631399/; John Cook et al., “Child Food Insecurity Increases Risks Posed by Household Food Insecurity to Young Children’s Health,” Journal of Nutrition, Vol. 136, No. 4, April 2006, https://pubmed.ncbi.nlm.nih.gov/16549481/; Rachel Kimbro and Justin Denney, “Transitions Into Food Insecurity Associated With Behavioral Problems And Worse Overall Health Among Children,” Health Affairs, Vol. 34, No. 11, November 2015, https://www.healthaffairs.org/doi/10.1377/hlthaff.2015.0626; John Cook et al., “Food Insecurity is Associated With Adverse Health Outcomes Among Human Infants and Toddlers,” Journal of Nutrition, Vol. 134, No. 6, June 2004, https://pubmed.ncbi.nlm.nih.gov/15173408/; Katie McLaughlin et al., “Food Insecurity and Mental Disorders in a National Sample of U.S. Adolescents,” Journal of the American Academy of Child & Adolescent Psychiatry, Vol. 51, No. 12, November 6, 2012, https://pubmed.ncbi.nlm.nih.gov/23200286/; Margaret Thomas, Daniel Miller, and Taryn Morrissey, “Food Insecurity and Child Health,” Pediatrics, Vol. 144, No. 4, October 1, 2019, https://doi.org/10.1542/peds.2019-0397; Molly Knowles et al., “‘Do You Wanna Breathe or Eat?’: Parent Perspectives on Child Health Consequences of Food Insecurity, Trade-Offs, and Toxic Stress,” Maternal and Child Health Journal, Vol. 20, No. 1, January 2016, https://pubmed.ncbi.nlm.nih.gov/26156827/; Martha Zaslow et al., “Food Security During Infancy: Implications for Attachment and Mental Proficiency in Toddlerhood,” Maternal and Child Health Journal, Vol. 13, No. 1, January 2009, https://pubmed.ncbi.nlm.nih.gov/18317892/.
[33] Seligman, Laraia, and Kushel, op. cit.; Gundersen and Ziliak, op. cit.; Deepak Palakshappa et al., “Food Insecurity Was Associated With Greater Family Health Care Expenditures In The US, 2016–17,” Health Affairs, Vol. 42, No. 1, January 2023, https://www.healthaffairs.org/doi/abs/10.1377/hlthaff.2022.00414; Boeun Kim et al., “Food Insecurity and Cognitive Trajectories in Community-Dwelling Medicare Beneficiaries 65 Years and Older,” JAMA Network Open, Vol. 6, No. 3, March 1, 2023, https://jamanetwork.com/journals/jamanetworkopen/fullarticle/2802752.
[34] U.S. Department of Agriculture, “SNAP Data Tables,” updated March 24, 2026, https://www.fns.usda.gov/pd/supplemental-nutrition-assistance-program-snap.
[35] Craig Gundersen, Brent Kreider, and John Pepper, “Partial Identification Methods for Evaluating Food Assistance Programs: A Case Study of the Causal Impact of SNAP on Food Insecurity,” American Journal of Agricultural Economics, Vol. 99, No. 4, July 2017, https://onlinelibrary.wiley.com/doi/abs/10.1093/ajae/aax026; Signe-Mary McKernan, Caroline Ratcliffe, and Breno Braga, “The Effect of the U.S. Safety Net on Material Hardship Over Two Decades,” Journal of Public Economics, Vol. 197, May 2021, https://www.sciencedirect.com/science/article/abs/pii/S0047272721000396; Caroline Ratcliffe, Signe-Mary McKernan, and Sisi Zhang, “How Much Does the Supplemental Nutrition Assistance Program Reduce Food Insecurity?” American Journal of Agricultural Economics, Vol. 93, No. 4, July 2011, https://onlinelibrary.wiley.com/doi/abs/10.1093/ajae/aar026; Stephanie Ettinger de Cuba et al., “Loss Of SNAP Is Associated With Food Insecurity And Poor Health In Working Families With Young Children,” Health Affairs, Vol. 38, No. 5, May 2019, https://www.healthaffairs.org/doi/10.1377/hlthaff.2018.05265.
[36] Steven Carlson and Joseph Llobrera, “SNAP Is Linked With Improved Health Outcomes and Lower Health Care Costs,” CBPP, December 14, 2022, https://www.cbpp.org/research/food-assistance/snap-is-linked-with-improved-health-outcomes-and-lower-health-care-costs.
[37] Colleen Heflin, Leslie Hodges, and Peter Mueser, “Supplemental Nutrition Assistance Program Benefits and Emergency Room Visits for Hypoglycaemia,” Public Health Nutrition, Vol. 20, No. 7, May 2017, https://pubmed.ncbi.nlm.nih.gov/27964772/; Colleen Heflin et al., “SNAP Benefits and Childhood Asthma,” Social Science & Medicine, Vol. 220, January 2019, https://www.sciencedirect.com/science/article/abs/pii/S0277953618306294; Seth Berkowitz et al., “SNAP Participation and Healthcare Use in Older Adults: A Cohort Study,” Annals of Internal Medicine, Vol. 174, No. 12, December 2021, https://www.ncbi.nlm.nih.gov/pmc/articles/PMC8893035/; Jennifer Pooler and Mithuna Srinivasan, “Association Between Supplemental Nutrition Assistance Program Participation and Cost-Related Medication Nonadherence Among Older Adults With Diabetes,” JAMA Internal Medicine, Vol. 179, No. 1, January 2019, https://www.ncbi.nlm.nih.gov/pmc/articles/PMC6583428/.
[38] Andrew Bryant and Lendie Follett, “Hunger relief: A natural experiment from additional SNAP benefits during the COVID-19 pandemic,” Lancet Regional Health Americas, Vol. 10, June 2022, https://doi.org/10.1016/j.lana.2022.100224; Brandon J. Restrepo, “The protective effect of SNAP during economic downturns: Evidence from the COVID-19 pandemic,” Applied Economic Perspectives and Policy, Vol. 45, No. 4, December 2023, https://doi.org/10.1002/aepp.13345; Di Fang et al., “Food insecurity during the COVID-19 pandemic: evidence from a survey of low-income Americans,” Food Security, Vol. 14, No. 1, February 2022, https://doi.org/10.1007/s12571-021-01189-1; Whitney Wells et al., “Food Insufficiency Increased After The Expiration Of COVID-19 Emergency Allotments For SNAP Benefits In 2023,” Health Affairs, Vol. 43, No. 10, October 2024, https://doi.org/10.1377/hlthaff.2023.01566; Namrata Sanjeevi and Pablo Monsivais, “Association of emergency allotment discontinuation with household food insufficiency in Supplemental Nutrition Assistance Program participants: A quasi-experimental study,” Preventive Medicine, Vol. 177, December 2023, https://doi.org/10.1016/j.ypmed.2023.107784; Aaron Richterman, Christina A. Roberto, and Harsha Thirumurthy, “Associations Between Ending Supplemental Nutrition Assistance Program Emergency Allotments and Food Insufficiency,” JAMA Health Forum, Vol. 4, No. 8, August 11, 2023, https://doi.org/10.1001/jamahealthforum.2023.2511; Matthew Lavallee, Sandro Galea, and Nadia N. Abuelezam, “Supplemental Nutrition Assistance Program Emergency Allotments and Food Security, Hospitalizations, and Hospital Capacity,” JAMA Network Open, Vol. 6, No. 8, August 9, 2023, https://doi.org/10.1001/jamanetworkopen.2023.26332; C. Ross Hatton et al., “Early Supplemental Nutrition Assistance Program Emergency Allotment Withdrawal and Household Food Insufficiency,” American Journal of Preventive Medicine, Vol. 69, No. 3, September 2025, https://doi.org/10.1016/j.amepre.2025.107940; Anna E. Austin et al., “Food insufficiency and difficulty affording expenses after the end of Supplemental Nutrition Assistance Program emergency allotments in the United States among households with and without children,” Preventive Medicine, Vol. 199, October 2025, https://doi.org/10.1016/j.ypmed.2025.108385.
[39] Catlin Nchako, “A Closer Look at Who Benefits From SNAP: State-by-State Fact Sheets,” CBPP, updated January 21, 2025, https://www.cbpp.org/research/food-assistance/a-closer-look-at-who-benefits-from-snap-state-by-state-fact-sheets.
[40] Using 2023 NHIS data, we estimate that some 19.5 million individuals in the U.S. have a disability and receive SNAP benefits. See Table 1 for additional estimates.
[41] SNAP Quality Control data count individuals as having a disability if they received disability-related benefits such as SSI, veterans’ benefits or workers compensation. See Appendix B in SNAP Quality Control Technical documentation: https://snapqcdata.net/sites/default/files/2025-03/FY%202023%20Tech%20Doc.pdf.
[42] Mia Monkovic and Ben Ward, “Characteristics of Supplemental Nutrition Assistance Program Households: Fiscal Year 2023,” U.S. Department of Agriculture, April 2025, https://fns-prod.azureedge.us/sites/default/files/resource-files/snap-FY23-Characteristics-Report.pdf.
[43] Katie Savin et al., “‘Now I Feel a Little Bit More Secure’: The Impact of SNAP Enrollment on Older Adult SSI Recipients,” Nutrients, Vol. 13, No. 12, December 2021, https://www.ncbi.nlm.nih.gov/pmc/articles/PMC8707609/.
[44] Brantley et al., op. cit.
[45] Ashley Burnside et al., “Advancing Disability Equity and Access in TANF and SNAP for People with Long COVID,” The Center for Law and Social Policy, October 2022, https://www.clasp.org/wp-content/uploads/2022/10/2022.10.12_Advancing-Disability-Equity-and-Access-in-TANF-and-SNAP-for-People-with-Long-COVID.pdf.
[46] Samuel, Xiao, et al., op. cit.; U.S. Bureau of Labor Statistics, “Persons with a Disability: Labor Force Characteristics – 2024,”February 25, 2025, https://www.bls.gov/news.release/pdf/disabl.pdf.
[47] Brantley, et al., op cit.
[48] Goodman, Morris, Morris, et al., op. cit.; Goodman, O’Day, and Morris, op. cit.; Carli Friedman, “Food Insecurity of People With Disabilities Who Were Medicare Beneficiaries During the COVID-19 Pandemic,” Disability and Health Journal, Vol. 14, No. 4, October 2021, https://pubmed.ncbi.nlm.nih.gov/34272190/; Gabriela Vedovato et al., “Giving Families a Voice for Equitable Healthy Food Access in the Wake of Online Grocery Shopping,” Nutrients, Vol. 14, No. 20, October 2022, https://www.ncbi.nlm.nih.gov/pmc/articles/PMC9609455/; Friedman, op. cit.; Vedovato, op. cit.
[49] Grace Jo et al., “COVID-19 Vaccine Website Accessibility Dashboard,” Disability and Health Journal, Vol. 15, No. 3, July 2022, https://pubmed.ncbi.nlm.nih.gov/35534390/; Samuel et al., op cit.
[50] Laura Samuel et al., “The Development of the Supplemental Nutrition Assistance Program Enrollment Accessibility (SNAP-Access) Score,” Disability and Health Journal, Vol. 15, No. 4, October 4, 2022, https://www.sciencedirect.com/science/article/pii/S1936657422001169.
[51] “By the Numbers: Harmful Republican Megabill Takes Food Assistance Away From Millions of People,” CBPP, updated August 14, 2025, https://www.cbpp.org/research/food-assistance/by-the-numbers-harmful-republican-megabill-takes-food-assistance-away-from.
[52] Catherine Okoro et al., “Prevalence of Disabilities and Health Care Access by Disability Status and Type Among Adults - United States, 2016,” Morbidity and Mortality Weekly Report, Vol. 67, No. 32, August 17, 2018, https://www.cdc.gov/mmwr/volumes/67/wr/mm6732a3.htm.
[53] Eileen Crimmins, Jung Kim, and Teresa Seeman, “Poverty and Biological Risk: The Earlier ‘Aging’ of the Poor,” Journals of Gerontology Series A: Biological Sciences and Medical Sciences, Vol. 64A, No. 2, February 2009, https://www.ncbi.nlm.nih.gov/pmc/articles/PMC2655037/; Nanette Goodman, Michael Morris, and Kelvin Boston, “Financial Inequality: Disability, Race and Poverty in America,” National Disability Institute, 2019, https://www.nationaldisabilityinstitute.org/wp-content/uploads/2019/02/disability-race-poverty-in-america.pdf.
[54] Katie Bergh, Catlin Nchako, and Luis Nuñez, “Worsening SNAP’s Harsh Work Requirement Would Take Food Assistance Away From Millions of Low-Income People,” CBPP, April 30, 2025, https://www.cbpp.org/research/food-assistance/worsening-snaps-harsh-work-requirement-would-take-food-assistance-away.
[55] U.S. Department of Agriculture, “SNAP Special Rules for the Elderly or Disabled,” updated September 30, 2025, https://www.fns.usda.gov/snap/eligibility/elderly-disabled-special-rules.
[56] Varadaraj et al., op. cit.
[57] Elizabeth Curda, “Social Security Disability: Information on Wait Times, Bankruptcies, and Deaths among. Applicants Who Appealed Benefit Denials,” Government Accountability Office, August 13, 2020, https://www.gao.gov/assets/gao-20-641r.pdf.
[58] U.S. Department of Agriculture, “Broad-Based Categorical Eligibility (BBCE),” updated August 7, 2025, https://www.fns.usda.gov/snap/broad-based-categorical-eligibility.
[59] Zachary Morris et al., “The Extra Costs Associated With Living With a Disability in the United States,” National Disability Institute, October 2020, https://www.nationaldisabilityinstitute.org/wp-content/uploads/2020/10/extra-costs-working-paper.pdf.
[60] Samuel, Xiao et al., op. cit.; Tong et al., op. cit.; Alicia Cohen et al., “Risk factors for Veteran food insecurity: findings from a National US Department of Veterans Affairs Food Insecurity Screener,” Public Health Nutrition, Vol. 25, No. 4, April 2022, https://www.ncbi.nlm.nih.gov/pmc/articles/PMC8957505/; Debra Brucker and Derek Nord, “Food Insecurity Among Young Adults With Intellectual and Developmental Disabilities in the United States: Evidence From the National Health Interview Survey,” American Journal on Intellectual and Developmental Disabilities, Vol. 121, No. 6, November 2016, https://meridian.allenpress.com/ajidd/article-abstract/121/6/520/6310/Food-Insecurity-Among-Young-Adults-With?redirectedFrom=fulltext; Debra Brucker, “Food Security Among Young Adults With Disabilities in the United States: Findings From the National Health Interview Survey,” Disability and Health Journal, Vol. 9, No. 2, April 2016, https://www.sciencedirect.com/science/article/abs/pii/S1936657415001636.
[61] Katie Bergh and Dottie Rosenbaum, “Many Low-Income People Will Soon Begin to Lose Food Assistance Under Republican Megabill,” CBPP, September 10, 2025, https://www.cbpp.org/research/food-assistance/many-low-income-people-will-soon-begin-to-lose-food-assistance-under.
[62] Kali Grant et al., “Unworkable & Unwise: Conditioning Access to Programs That Ensure a Basic Foundation for Families on Work Requirements,” Georgetown Law Center on Poverty and Inequality, February 1, 2019, http://www.georgetownpoverty.org/wp-content/uploads/2019/02/Unworkable-Unwise-20190201.pdf; Wenhui Fent, “The Effects of Changing SNAP Work Requirement on the Health and Employment Outcomes of Able-Bodied Adults without Dependents,” Journal of the American Nutrition Association, Vol. 41, No. 3, February 22, 2021, https://www.tandfonline.com/doi/abs/10.1080/07315724.2021.1879692; Colin Gray et al., “Employed in a SNAP? The Impact of Work Requirements on Program Participation and Labor Supply,” American Economic Journal: Economic Policy, Vol. 15, No. 1, February 2023, https://www.aeaweb.org/articles?id=10.1257/pol.20200561; Brantley et al., op. cit.
[63] Samuel, Zhu et al., op. cit.
[64] Samuel, Xiao et al., op. cit.
[65] Monkovic and Ward, op. cit.
[66] CBPP analysis of 2023 SNAP Quality Control data, estimating what the average monthly SNAP household benefit would have been for households with members with disabilities that claimed the medical deduction, if those same households had not received a medical deduction.
[67] Vedovato et al., op. cit.; Henry Whittle et al., “‘The Land of the Sick and the Land of the Healthy’: Disability, Bureaucracy, and Stigma Among People Living With Poverty and Chronic Illness in the United States,” Social Science & Medicine, Vol. 190, October 2017, https://www.ncbi.nlm.nih.gov/pmc/articles/PMC5937915/.
[68] Samuel, Zhu et al., op. cit.
[69] Whittle et al., op. cit.
[70] Food Research and Action Center, “A Guide to Supplemental Security Income/Supplemental Nutrition Assistance Program: Combined Application Projects,” June 2017, https://frac.org/wp-content/uploads/guide-ssi-snap-combined-application-projects.pdf.
[71] Samuel et al., op cit.; Varadaraj et al., op cit.
[72] Emily Ware et al., “Practical Needs in the Home Care of Latino Children With Medical Complexity,” Home Health Care Now, Vol. 38, No. 4, July/August 2020, https://journals.lww.com/homehealthcarenurseonline/abstract/2020/07000/practical_needs_in_the_home_care_of_latino.4.aspx.
[73] Centers for Disease Control and Prevention, “Caregiving for Family and Friends — A Public Health Issue,” February 13, 2019, https://www.cdc.gov/healthy-aging-data/media/pdfs/caregiver-brief-508.pdf.
[74] Vedovato et al., op. cit.; Savin et al., op. cit.
[75] Jordan W. Jones et al., “SNAP Online Purchasing Pilot Reduced Food Insufficiency Among Low-Income Households During Early Pandemic,” USDA, April 16, 2024, https://www.ers.usda.gov/amber-waves/2024/april/snap-online-purchasing-pilot-reduced-food-insufficiency-among-low-income-households-during-early-pandemic; USDA, “SNAP Online Purchasing Pilot,” August 3, 2022, https://www.fns.usda.gov/snap/online-purchasing-pilot; Isabelle Foster et al., “Understanding Nationwide Uptake: An Analysis of the Newly Expanded SNAP Online Purchasing Program during 2020,” unBox, February 10, 2021, https://www.unboxproject.org/snap-online-purchasing-brief; Isabelle Foster, Christopher LeBoa, and Eric Rimm, “An Analysis of SNAP Online Purchasing Behavior in California: A Review of the First 7 Months of Program Implementation and Lessons Learned,” American Journal of Health Promotion, Vol. 37, No. 3, October 15, 2022, https://journals.sagepub.com/doi/10.1177/08901171221131194.
[76] Kyle Jones et al., Andrea Leschewski, Jordan Jones, and Grace Melo, "The Supplemental Nutrition Assistance Program Online Purchasing Pilot’s impact on food insufficiency," Food Policy, Vol. 121: 102538, November 2023, https://doi.org/10.1016/j.foodpol.2023.102538; and Michael Mendelson et al.,, Ayesha Enver, Shannon Hitchcock, Robin Koralek, Eleanor Elmudesi, Jacob Klerman, and Lauren Olsho, “Evaluation of Technology Modernization for SNAP Benefit Redemption through Online Transactions—Final Evaluation Report,” U.S. Department of Agriculture, September 2023, https://fns-prod.azureedge.us/sites/default/files/resource-files/snap-online-pilot-report.pdf.
[77] Mendelson et al., op. cit.
[78] Sins Invalid, “Articulating a movement,” in Skin, Tooth, and Bone: The Basis of Movement is Our People, 2019.
[79] Erin Brantley, Drishti Pillai, and Leighton Ku, “Association of Work Requirements With Supplemental Nutrition Assistance Program Participation by Race/Ethnicity and Disability Status, 2013-2017,” JAMA Network Open, Vol. 3, No. 6, June 26, 2020, https://jamanetwork.com/journals/jamanetworkopen/fullarticle/2767673.
[80] Social Security Administration, “Annual Statistical Supplement, 2025,” accessed November 10, 2025, https://www.ssa.gov/policy/docs/statcomps/supplement/2025/index.html.
[81] Paulette C. Morgan and Phoenix Voorhies, “Medicare Overview,” Congressional Research Service, updated July 8, 2024, https://www.everycrsreport.com/reports/IF10885.html.
[82] Kaiser Family Foundation, “Medicaid Financial Eligibility for Seniors and People with Disabilities in 2015,” March 1, 2016, https://files.kff.org/attachment/report-medicaid-financial-eligibility-for-seniors-and-people-with-disabilities-in-2015.
[83] Medicaid and CHIP Payment and Access Commission, “People with disabilities,” July 30, 2025, https://www.macpac.gov/subtopic/people-with-disabilities/.
[84] U.S. Department of Agriculture, “Supplemental Nutrition Assistance Program State Options Report,” August 2025, https://fns-prod.azureedge.us/sites/default/files/resource-files/snap-stateOptionsReport-17edition-120925.pdf.
[85] Landes, Swenor, and Vaitsiakhovich, op. cit.
[86] U.S. Census Bureau, op. cit.; Centers for Disease Control and Prevention, op. cit., https://www.cdc.gov/dhds/datasets/index.html.
[87] Landes, Swenor, Vaitsiakhovich, op. cit.
[88] Washington Group on Disability Statistics, op. cit.
[89] Centers for Disease Control and Prevention, “NHIS Questionnaires, Datasets, and Documentation,” accessed November 10, 2025, https://www.cdc.gov/nchs/nhis/documentation/index.html.
[90] Washington Group on Disability Statistics, op. cit.
[91] SIPP and NHIS also contain numerous, more detailed, measures of health status and disability.
[92] Centers for Disease Control and Prevention, “Survey Description, National Health Interview Survey, 2023,” July 2024, https://ftp.cdc.gov/pub/Health_Statistics/NCHS/Dataset_Documentation/NHIS/2023/srvydesc-508.pdf.
[93] Census Bureau, “American Community Survey and Puerto Rico Community Survey 2023 Subject Definitions,” https://www2.census.gov/programs-surveys/acs/tech_docs/subject_definitions/2023_ACSSubjectDefinitions.pdf; Census Bureau, “The Undercount of Young Children,” October 8, 2021, https://www.census.gov/programs-surveys/decennial-census/decade/2020/planning-management/plan/undercount-of-young-children.html.