

Costly Tax Cuts Increase Our Nation’s Fiscal Challenges
Testimony of Brendan Duke, Senior Director for Federal Budget Policy, Center on Budget and Policy Priorities, Before the Senate Budget Committee
Thank you, Chair Graham, Ranking Member Merkley, and members of the Budget Committee. My name is Brendan Duke, and I am Senior Director for Federal Budget Policy at the Center on Budget and Policy Priorities (CBPP). CBPP is a nonpartisan research and policy institute that advances federal and state policies to help build a nation where everyone has the resources they need to thrive and share in the nation’s prosperity.
Our nation faces serious long-term fiscal challenges. Addressing them will require policymakers to recognize several realities:
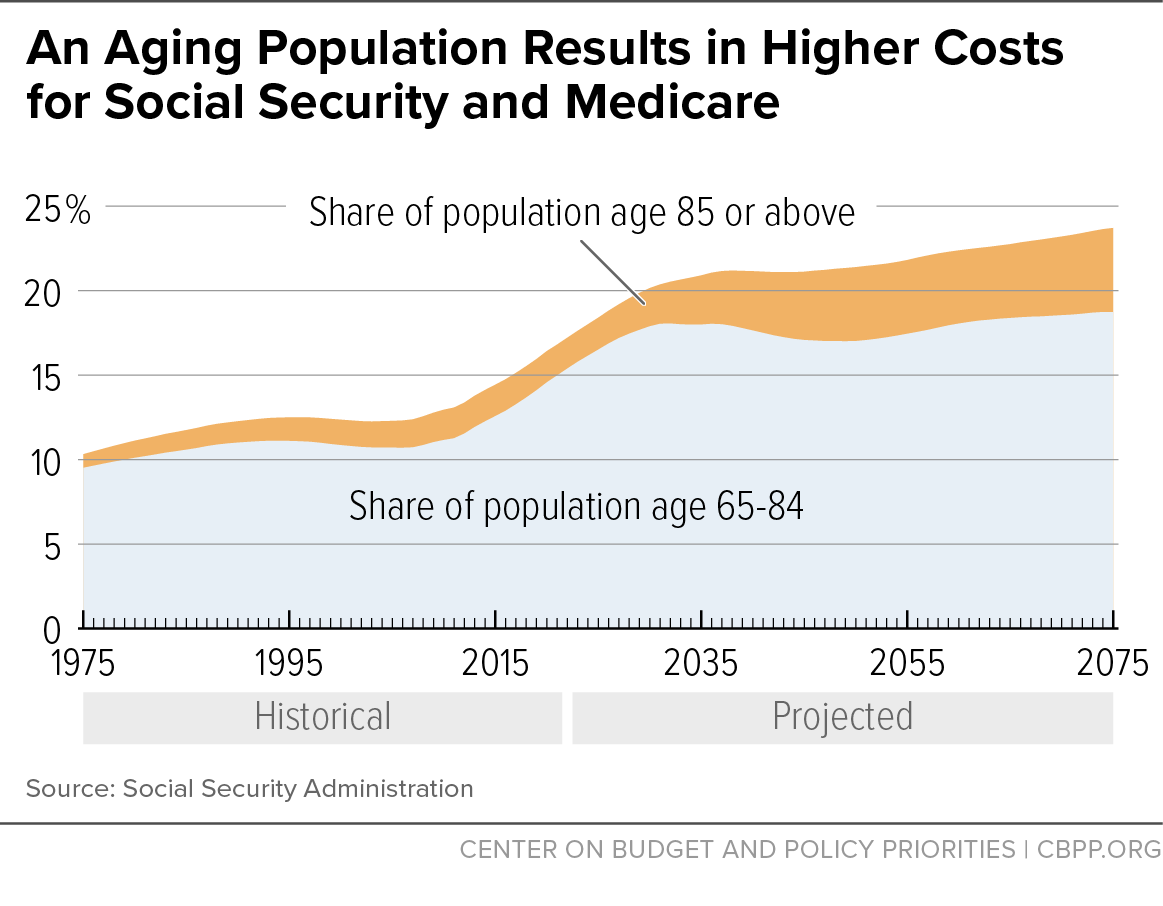
- An aging population means that we will need to spend more to meet our obligations to seniors. Measured as a share of the economy (gross domestic product or GDP), revenues currently are around their average level of recent decades, but spending on Social Security and Medicare has risen as the baby-boom generation has moved into retirement. Spending outside of those two programs has fallen as a share of GDP, refuting claims that our fiscal challenge simply reflects overspending.
- The American people favor a broad range of critical public services, investments in our economy such as education, research, and infrastructure, and supports for seniors, people with disabilities, and individuals and families who need help affording food, health care, child care, and housing.
- Tax cuts enacted over the last 25 years — the Bush tax cuts, their extensions under the Obama Administration, and the 2017 Trump tax cuts — have weakened revenues, driving up deficits. In 2012 — before most of the Bush tax cuts were made permanent and the Trump tax cuts were even conceived — the Congressional Budget Office (CBO) projected that the deficit in 2025 would be 1.8 percent of GDP. The actual 2025 deficit was 5.8 percent. The difference is due to the tax cuts, as programmatic spending in 2025 was lower as a percent of GDP than CBO had projected.
- H.R. 1, the deeply flawed megabill enacted last year, doubled down on those tax-cut mistakes. It has a net cost of $3.4 trillion through 2034 despite imposing massive program cuts that will take away health care and food assistance from millions of people (CBO more recently estimated the ten-year cost through 2035 at $4.7 trillion including its effects on the economy and additional interest payments). Independent analyses agree that it will not generate enough economic growth to meaningfully offset the cost of these tax cuts.
- The push for large-scale deportation of immigrants and closing off the U.S. to new immigrants not only harms our communities and families, but it also makes our fiscal challenges worse. Immigration can reduce the need for the politically difficult measures required to improve the fiscal outlook by expanding the workforce and increasing revenue. But CBO projects that the Administration’s actions to reduce immigration will increase deficits by $500 billion over ten years, principally by reducing the number of taxpayers.
An Aging Population Will Require More Revenue
Analyses of the federal budget typically focus on government revenue and spending as percentages of GDP. In 2025, revenue was 17 percent of GDP, very similar to the average over the past 50 years and the same as in 1985. Programmatic spending, on the other hand, grew from 19.2 percent to 19.9 percent of GDP between 1985 and 2025. And net interest — the cost of servicing the net federal debt — grew from 3.0 percent to 3.2 percent of GDP over that period.
While many in Congress have concluded, “we have a spending problem, not a revenue problem,” this claim ignores the reality that spending on Social Security and Medicare has gone up because the population has aged; programmatic spending outside of those two programs is actually lower as a percent of the economy today than in 1985.[1] Non-defense discretionary spending, for example, fell from 3.8 percent to 3.2 percent of GDP between 1985 and 2025.
Forty years ago, the members of the baby-boom generation (those born between 1946 and 1964) were in or still approaching their “prime working years”; today they are in their “prime retirement years,” with all but the very youngest now eligible for Social Security and Medicare. And over the next 50 years, this trend of an aging population will continue. (See Figure 1.)

The combination of population aging and basic arithmetic means we face a choice: either we raise revenue above the 17 percent level that was typical when the country was younger, or we make drastic cuts to programs and renege on commitments we’ve made, including to seniors who receive benefits through Medicare, Social Security, or Medicaid (the country’s largest payer of long-term care services). Two-thirds of federal program spending each year goes to the combination of Social Security, Medicare, long-term care in Medicaid, defense, and veterans. Without additional revenue, therefore, there is simply no way to significantly slow the rise in the federal debt while shielding these programs from cuts.
Actions by the current Congress and Administration show how damaging these program cuts would have to be — and how deeply we would have to cut to address our rising debt trajectory. The Trump Administration has attempted — often illegally — to close whole agencies, engaged in mass layoffs, and at various times tried to freeze or impound various funds, but with little savings to show for it. Similarly, congressional Republicans failed to offset the full cost of the trillions of dollars in tax cuts they enacted last year despite imposing a 22 percent cut to the Supplemental Nutrition Assistance Program (SNAP) and 18 percent cut to Medicaid by 2034, and those program cuts have sparked substantial and warranted public pushback. And even the Trump Administration says it opposes cuts to Social Security and Medicare benefits. Indeed, large bipartisan majorities in Congress increased Social Security benefits one year ago by repealing Social Security’s windfall elimination provision and government pension offset without even attempting to offset the cost.[2]
Meeting long-standing retirement and health care commitments to seniors, managing the future risks associated with higher debt, and making critical national investments will, therefore, require substantially more revenue. Trump Administration actions once again help prove this. The deficit fell from 6.3 percent to 5.8 percent of GDP between fiscal years 2024 and 2025, in large part due to about $120 billion in additional revenue from tariffs. (Last month the Supreme Court ruled a large fraction of these tariffs are illegal.) These tariffs — while regressive and economically destructive — nonetheless reflect the reality that revenue needs to be part of the fiscal discussion.
Without 25 Years of Unpaid-for Tax Cuts, Our Debt Today Would Be Lower and Stable
The retirement of the baby-boom generation was both predictable and predicted. And at the beginning of the 21st century, our fiscal system was projected to deliver adequate revenue to meet our needs because revenue was projected to rise above 17 percent of GDP. But that was before policymakers enacted a series of enormously costly tax cuts that dramatically changed the fiscal trajectory.
One way to see this is to compare current budget data with CBO projections from 2012 — the year before more than four-fifths of the Bush tax cuts were made permanent and before the 2017 Trump tax cuts were proposed and then enacted. CBO’s 2012 projections for 2025 assumed the Bush tax cuts would expire as scheduled and the 2017 tax cuts would never happen.
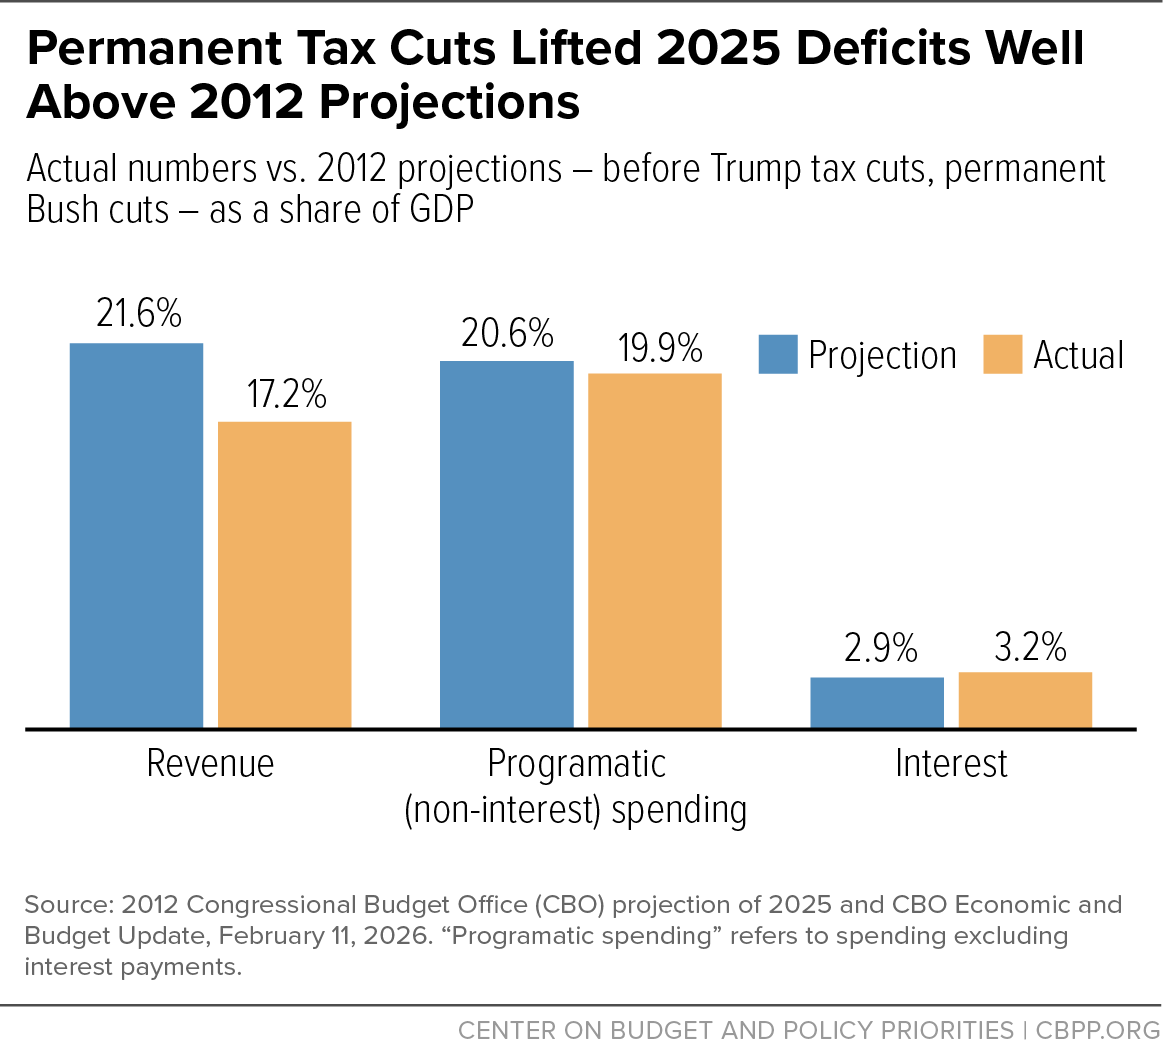
In 2012 CBO projected that the fiscal year 2025 deficit would be 1.8 percent of GDP — low enough that economic growth could reasonably be expected to keep the ratio of debt to GDP from growing endlessly from that point forward. But the 2025 deficit was 5.8 percent of GDP. The reason is simple: despite rising costs due to the aging of the baby-boom generation, policymakers have enacted unpaid-for tax cuts in the past two decades that have eroded the revenue base.
The deficit increase was not because of higher programmatic spending. In 2012, CBO projected that programmatic spending would make up 20.6 percent of GDP in 2025; the actual 2025 level was 19.9 percent, in part because health care cost growth slowed as compared to the 2012 CBO estimates. The higher non-interest deficit is entirely attributable to the drop in revenue, from CBO’s projection of 21.6 percent of GDP to the actual 2025 level of 17.2 percent, mostly as a result of the permanent extension of the Bush tax cuts and enactment of the 2017 Trump tax cuts. [3] (See Figure 2.)

Importantly, 2025 spending for key individual programs — such as Social Security, Medicare, Medicaid, the Children’s Health Insurance Program (CHIP), and the Affordable Care Act’s premium tax credits — also came in below CBO’s 2012 projections. This shows that it’s possible to meet our commitments to our seniors while ensuring millions of low- and moderate-income Americans have health care if we are willing to raise the revenue to do so. Notably, the 2025 costs of Medicaid, CHIP, and the premium tax credits were below the 2012 projections despite the subsequent enactment of premium tax credit enhancements, which unfortunately expired at the end of last year. (See Figure 3.)

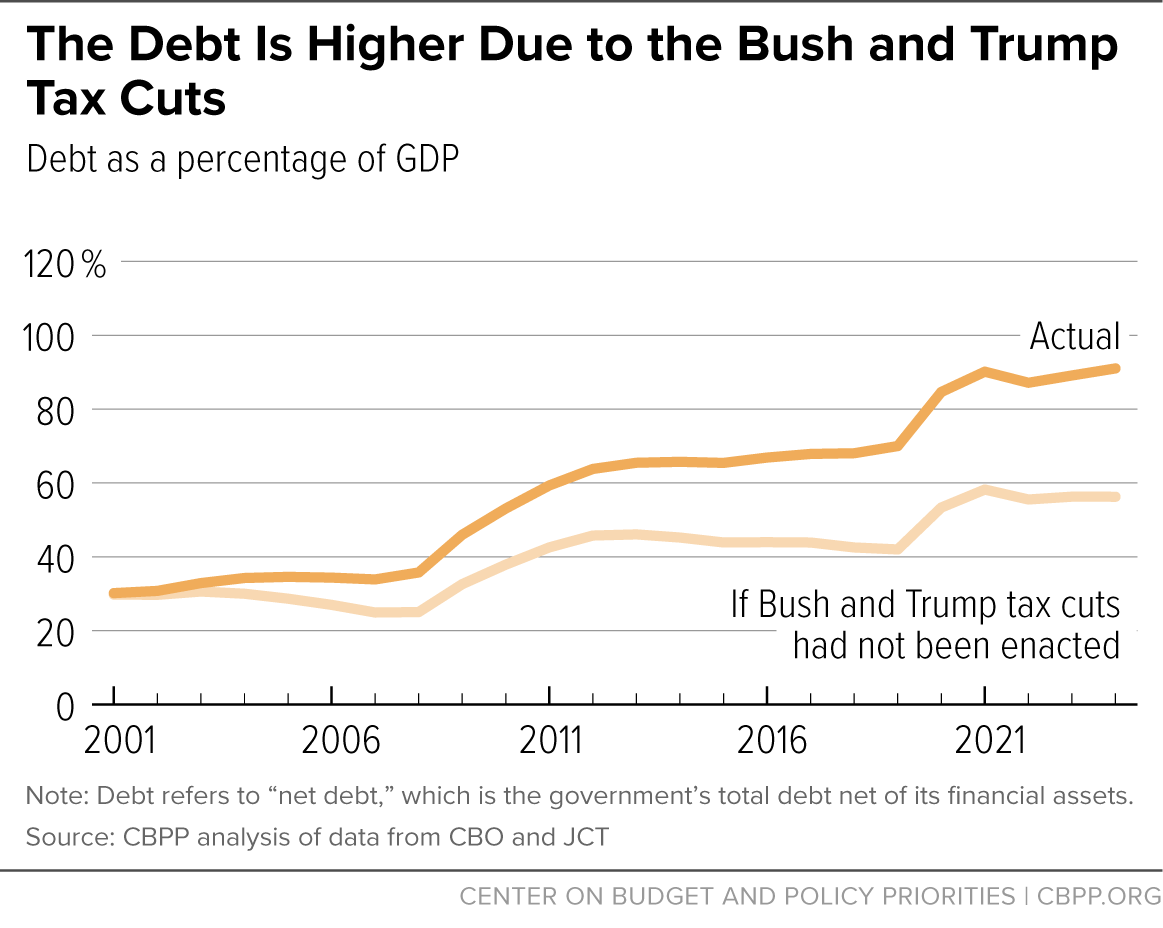
Switching from deficits to debt, we can directly see the burden that decades of unpaid-for tax cuts have placed on our fiscal system. My CBPP colleagues estimate that if the Bush tax cuts, their extensions under President Obama, and the 2017 Trump tax cuts had not been enacted, the debt ratio (“debt net of financial assets”) would be considerably lower: 56 percent of GDP in 2024, compared to the actual 92 percent.[4] (See Figure 4.)

Finally, our fiscal deficit is not our only deficit — we also have a public investment deficit. We are underinvesting in the building blocks of economic growth, including science and research, clean energy transition, and the investments in children and families that reduce hardship in the near term while also increasing future productivity and prosperity.
Stabilizing our fiscal trajectory, let alone making critical investments, will require reversing the revenue losses from the Bush and Trump tax cuts. There are myriad policies that can do this. It does not mean reversing every individual tax cut enacted over the last 25 years; for example, the tax increases could be more progressive than the tax cuts. The solution, while mathematically simple, is politically difficult. But it’s substantially less politically difficult than walking away from our commitments to the millions of people who count on Medicare and Social Security, slashing spending for defense and veterans, and taking food assistance and health coverage away from people who need help affording the basics.
Deeply Flawed Republican Megabill Worsens Fiscal Outlook While Increasing Hardship
Congress missed an opportunity to learn this lesson in the major tax and spending legislation it passed last year. Instead, it doubled down on the mistakes of the Bush tax cuts, their deficit-financed Obama-era extensions, and the first round of Trump tax cuts; Congress also added more than $170 billion for immigration detention and border enforcement, bolstering a large detention and removal apparatus that is separating families and violating the legal and constitutional rights of many immigrants and U.S. citizens who get swept up by the deportation dragnet.
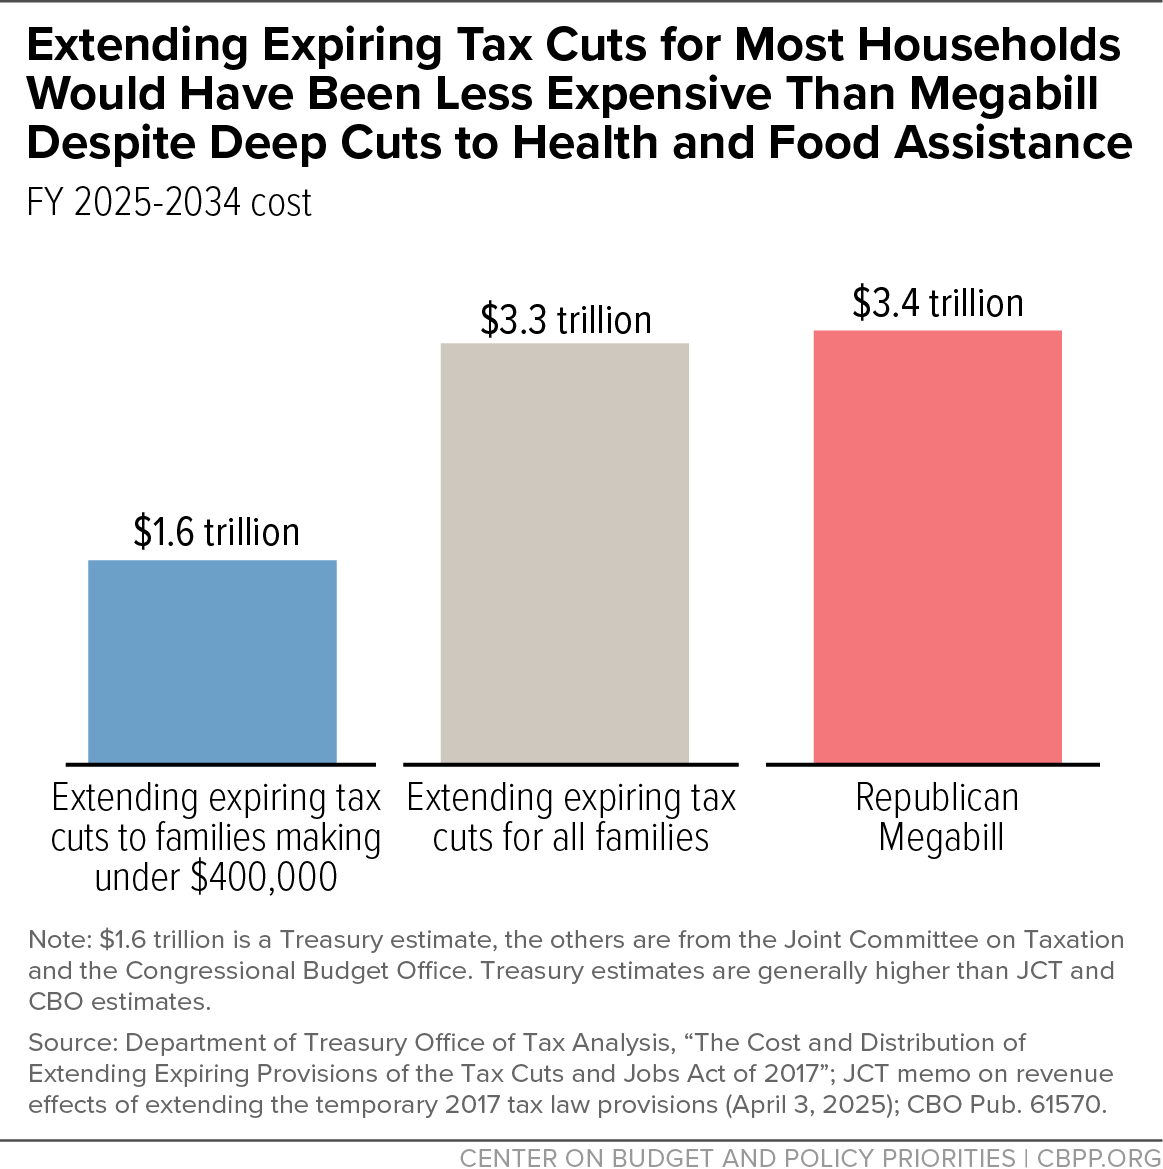
As a result, H.R. 1 will carry a net cost of $3.4 trillion through 2034 despite its cuts to health care and food assistance, according to CBO (CBO more recently estimated the ten-year cost through 2035 as $4.7 trillion including its effects on the economy and additional interest payments). Even worse, this figure could rise to $4.2 trillion if the temporary new tax cuts in the law, currently set to expire in 2028 and 2029, are extended.
If Congress instead had simply extended the 2017 tax law’s expiring provisions for families, without any cuts to Medicaid and SNAP or other offsets, the resulting bill would have cost slightly less than H.R. 1. And extending the 2017 tax cuts for the 98 percent of households making under $400,000 would have cost far less. (See Figure 5.)

No independent organization — including right-leaning ones such as the Tax Foundation and the American Enterprise Institute[5] — has found that the megabill will generate enough economic growth to meaningfully offset the cost of these tax cuts. Indeed, some analyses, such as those from CBO, the Budget Lab at Yale and the Penn Wharton Budget Model, find that accounting for economic growth effects would increase its price tag.[6] (See Figure 6.)



Tariffs, another key piece of the Administration’s agenda, have brought in revenues, and while the Administration may have to rebate a large fraction of them in light of last month’s Supreme Court ruling, the President said he plans to seek to recreate those tariffs using different authorities. But they amount to a regressive tax increase on consumers, raising prices on everything from food to baby strollers to manufacturing inputs such as industrial chemicals. Many of those most affected by the tariffs also face the loss of health care and food assistance and were left out of the Child Tax Credit expansion in the megabill.
The net effect of the megabill’s tax cuts and the tariffs is a big windfall for the wealthy. The Budget Lab — using calculations based on the tariff regime as it stood before last month — estimates that households with incomes in the top 10 percent will enjoy an income increase averaging $9,700 (1.9 percent), while households with incomes in the bottom 70 percent will end up worse off and those with incomes in the bottom 10 percent will lose an average of $2,200 (5.6 percent).
Immigrants Strengthen Economy, Improve Fiscal Outlook
The steps required to significantly improve the fiscal outlook, whether through revenue increases or program cuts, can be politically challenging. Immigration can reduce the need for difficult measures (though not eliminate them entirely), but the Administration is moving in the opposite direction.
People who are immigrants contribute to our communities and the U.S. economy in many ways. They work at high rates and make up more than a third of the workforce in some industries.[7] Their geographic mobility helps local economies respond to worker shortages, smoothing out bumps that could otherwise weaken the economy. Immigrants are entrepreneurial, comprising a disproportionate share of startups.[8] And children born to immigrant families are upwardly mobile, promising future benefits not only to their families and communities but to the U.S. economy overall. People who are immigrants do important jobs — from care workers who tend to children and seniors to construction workers who build homes to store owners to Nobel-winning scientists who forge a path of discovery and innovation — and enrich our neighborhoods and communities.
Immigrants are younger than the U.S. population overall and they boost our national birth rate; in other contexts many conservatives have embraced a higher birth rate as a policy goal.
A low birth rate can lead to a decline in the labor force and a slowing and less dynamic economy. Immigrants can counteract these effects. Moreover, the decline in the native-born birth rate, combined with the aging of the baby-boom generation, means that immigrants can boost our workforce, growing our economy and helping to support the baby-boom generation in their retirement years. A recent Cato Institute report found that immigrants have been essential contributors to federal, state, and local budgets, paying more in taxes for each year from 1994 to 2023 than they received in benefits. Over that period, in fact, immigrants created a cumulative fiscal surplus of $14.5 trillion in 2024 dollars.[9]
CBO’s recent “Budget and Economic Outlook” demonstrates the economic and fiscal costs of the Administration’s anti-immigrant policies.[10] CBO cut in half its projection of the annual growth rate of the U.S. population over the next ten years, relative to last year’s projection. CBO now estimates that the 2035 working-age population will be 2.4 million people smaller than in its previous projection. CBO also projects that slower population growth will reduce capital investment. This has important fiscal costs, too — CBO projects that the Administration’s actions to reduce immigration will increase deficits by $500 billion over ten years, principally by reducing the number of taxpayers.
Those higher deficits will make deficit reduction that much harder, adding to the damage from H.R. 1.
Financing income tax cuts tilted to the wealthy by cutting programs to help families afford food and medicine while raising taxes on imported food and medicine, even as we discourage immigration and disparage immigrants — the approach this Administration has relied on — is no way to address our fiscal imbalances. We need a better approach, and revenues need to be a large part of the solution.
End Notes
[1] Program spending is outlays excluding net interest. Spending on net interest is ultimately the result of both Congress’s program spending and revenue decisions since the beginning of the Republic, i.e., the resulting level of net debt, in addition to the market forces that determine interest rates.
[2] Kathleen Romig, “Repealing Social Security’s WEP and GPO Rules Would Be Misguided,” CBPP, September 19, 2022, https://www.cbpp.org/research/social-security/repealing-social-securitys-wep-and-gpo-rules-would-be-misguided.
[3] CBO’s 2012 projection assumed the Alternative Minimum Tax (AMT) would continue not to be indexed for inflation and would thus cause the revenue-to-GDP ratio to rise. (Later that year it was indexed to inflation as part of the legislative package that made most of the Bush tax cuts permanent.) But the legislation making most of the Bush tax cuts permanent still significantly reduced revenue, even setting aside its changes to the AMT. The analysis of the debt trajectory below — which separates out the effect of adjusting the AMT for inflation and the Bush tax cut extension — still shows that the debt-to-GDP ratio would be approximately stable without those tax cuts but with the AMT nonetheless adjusted for inflation. And it is still the case that program costs in 2025 are lower than CBO had projected in 2012; the increased deficits are still entirely the result of tax cuts.
[4] As noted above, this analysis assumes that Congress already “patched” the AMT by permanently adjusting its parameters for inflation, so the cost of such a patch does not count as part of the Bush tax cuts.
[5] Kyle Pomerleau, “A Preliminary Macroeconomic Analysis of the ‘One Big Beautiful Bill Act,’” American Enterprise Institute, June 12, 2025, https://www.aei.org/articles/a-preliminary-macroeconomic-analysis-of-the-one-big-beautiful-bill-act/; Garrett Watson et al., “One Big Beautiful Bill Act Tax Policies: Details and Analysis,” Tax Foundation, February 10, 2026, https://taxfoundation.org/research/all/federal/big-beautiful-bill-senate-gop-tax-plan/.
[6] Budget Lab, “Long-term Impacts of the One Big Beautiful Bill Act, as Enacted on July 4, 2025,” July 30, 2025, https://budgetlab.yale.edu/research/long-term-impacts-one-big-beautiful-bill-act-enacted-july-4-2025; Penn Wharton Budget Model, "President Trump-Signed Reconciliation Bill: Budget, Economic, and Distributional Effects," July 8, 2025, https://budgetmodel.wharton.upenn.edu/issues/2025/7/8/president-trump-signed-reconciliation-bill-budget-economic-and-distributional-effects.
[7] Arloc Sherman, “Immigrants Contribute Greatly to U.S. Economy, Despite Administration’s ‘Public Charge’ Rule Rationale,” CBPP, August 15, 2019, https://www.cbpp.org/research/immigrants-contribute-greatly-to-us-economy-despite-administrations-public-charge-rule.
[8] Pierre Azoulay et al., "Immigration and Entrepreneurship in the United States," American Economic Review: Insights, March 2022; Saheel A. Chodavadia et al., “Immigrant Entrepreneurship: New Estimates and a Research Agenda," National Bureau of Economic Research Working Paper No. 32400, May 2024, https://www.nber.org/papers/w32400.
[9] David J. Bier, Michael Howard, and Julian Salazar, “Immigrants’ Recent Effects on Government Budgets: 1994-2023,” Cato Institute, February 3, 2026, https://www.cato.org/white-paper/immigrants-recent-effects-government-budgets-1994-2023.
[10] CBO, “The Budget and Economic Outlook: 2026 to 2036,” February 11, 2026, https://www.cbo.gov/publication/61882.