Contrary To President's Claim, Large Majority of Americans Ultimately Will Lose From Tax Reconciliation Bill
In his recent statement responding to the tax reconciliation bill conference agreement, President Bush asserted that failure to extend the tax cuts contained in the bill would be “disastrous” for “all working Americans.”[2]
The President’s claim is implausible in light of the distribution of the reconciliation bill’s benefits. Some 68 percent of all American households will receive no tax cut at all from the legislation, and the average tax cut for households in the middle fifth of the income distribution will be $20. While the $43,000 average tax cut that households with incomes over $1 million will get from the bill could have a significant impact on a family’s finances, it hardly seems that the loss of a $20 tax benefit would qualify as a disaster.
An even larger fallacy in the President’s claim is that it rests on the assumption that the tax cuts are a costless gift from a beneficent government. In fact, deficit-financed tax cuts eventually have to be paid for. The 68 percent of households that receive nothing from the tax cuts will, nonetheless, almost surely have to bear a share of the costs. More than 85 percent of all households have incomes below $100,000, and the vast majority of these households will be net losers when the financing costs of the tax reconciliation bill are considered, according to an analysis by the Urban Institute-Brookings Institution Tax Policy Center. Moreover, if the tax reconciliation bill is taken to have been partly financed by the spending reconciliation bill enacted earlier this year, then households with modest incomes are already net losers from the tax cuts (see discussion below).
Some claim that there really is a free lunch to be had in this case because the tax cuts will spur economic growth, which will help everyone and generate enough additional revenue to offset most, if not all, of the tax cuts’ costs. That claim is not supported by the evidence (see box below). Rather, it is widely recognized that the tax cuts eventually must be financed. Financial markets will not indefinitely tolerate large, persistent, and growing deficits of the type that the nation is projected to face. As former Federal Reserve Chairman Alan Greenspan warned, “If you’re going to lower taxes, you shouldn’t be borrowing essentially the tax cut. And that over the long run is not a stable fiscal situation.”[3] Simply stated, funds that are borrowed must eventually be paid back.
Under a Variety of Financing Assumptions, Most Households Will Lose from the Tax Cuts
In this analysis, we consider three possible approaches to paying for the tax cuts: one that approximates financing largely through cuts in federal programs, one that approximates financing through a combination of program cuts and progressive tax increases, and a third that approximates financing entirely through progressive tax increases. In the first scenario, every household would pay the same dollar amount — about $450, in today’s terms — to finance the cost of the tax cuts contained in the legislation. In the second scenario, all households would pay the same percentage of income to finance the tax cuts. In the third scenario, all households would see their income tax burdens rise by the same percentage to pay for the tax cuts.[4]
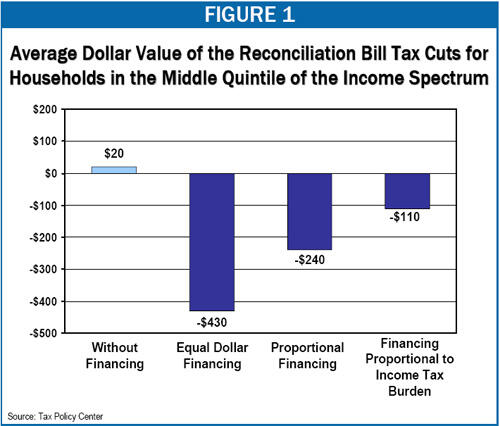
The Tax Policy Center data show that, under all three scenarios, the average household with income below $100,000 would lose from the tax bill. Households in the middle quintile of the income spectrum, which in the short run will gain an average of $20 from the tax cuts included in the legislation, would ultimately lose by more than $110 on average under each financing scenario (see Figure 1 and Table 1 and Table 2).
Tax Cuts Have Not Led to Widespread Economic Gains
Some proponents of the capital gains and dividend tax cuts included in the reconciliation bill claim these tax cuts have generated widespread economic growth that has helped everyone. Those who voice this opinion do not, and are not able to, demonstrate a causal link. Instead, they simply assume that since growth followed the tax cuts, the tax cuts caused the growth — despite the lack of evidence that the tax cuts played a significant role and that the population as a whole has benefited from the growth that occurred.
The economic growth of the past few years, however, is what one would expect at this stage in the business cycle: after a recession, as occurred in 2001, there is a recovery. In fact, overall, the current recovery has been less robust than past recoveries.
In addition, it is impossible to demonstrate that the tax cuts have played either a positive or negative role to date; there is insufficient evidence at this point to establish or refute a causal link. In theory, the results could go either way: capital gains tax cuts may spur some savings and investment, but they also provide incentives to invest in tax shelters — economically unproductive schemes designed to convert ordinary income into more lightly taxed capital gains and dividends.a
Moreover, the tax cuts are currently deficit financed, and deficit financing impedes investment by soaking up some of the capital that otherwise would be available for investment and by leading to higher interest rates, at least in the long run.
Further, even if recent economic trends were attributable to the tax cuts, they would not mitigate the tax cuts’ regressivity. The current recovery has failed to produce robust income growth for middle-income households. To the contrary, during this recovery, wages and salaries and employment have grown more slowly, on average, than in any previous post-World War II recovery. (Corporate profits, by contrast, have grown more than twice as fast as in the average previous recovery.)
Advocates of the capital gains and dividend tax cuts emphasize that growth has picked up in the past two years. But during the recovery of the 1990s, growth was also weak initially, and a similar acceleration in growth coincided closely with a tax increase.. Moreover, even in the past two years, employment growth has been well below the average for previous post-World War II recoveries, and, after adjusting for inflation, wages among low- and middle-income workers fell in 2005.b
a See Leonard E. Burman, The Labyrinth of Capital Gains Tax Policy: A Guide for the Perplexed, Brookings Institution Press, 1999.
b Lee Price and Jared Bernstein, “The State of Jobs and Wages,” Economic Policy Institute, updated January 27, 2006. There has been some wage growth in the first part of 2006, but real hourly wages have only just returned to their level in November 2001, when the recovery started.
If each household paid the same dollar amount to finance the cost of the tax reconciliation bill, the middle fifth of households would experience an average net loss of $430 per household.[5] The top 20 percent of households would experience an average net gain of $1,700, while the top one percent of households would receive an average net gain of $13,600. For households with incomes over $1 million, the average net gain would be $42,000.
If each household paid the same percentage of income to finance the tax cuts, middle-income and low-income households still would still be net losers and those at the top net winners, although by smaller amounts. Under this scenario, the middle fifth of households would lose an average of $240, while the top 20 percent would gain an average of $750, the top one percent would gain by an average of $5,800, and millionaires would gain by an average of $21,000.
Even if the entire tax cut ultimately were financed through a proportional increase in progressive income taxes (with everyone’s income taxes being increased by the same percentage), households with incomes below $100,000 still would see net losses on average. Under this scenario, the middle fifth of households would lose an average of $100, while the top 20 percent would gain by $390 and millionaires by $2,700.[6]
The Spending Reconciliation Bill
The President and Congressional leaders already have begun to use the substantial deficits that have resulted in significant part from the 2001 and 2003 tax cuts to justify budget cuts in a wide array of domestic programs. The President’s budget calls for increasingly deep cuts in domestic programs over the next five years, including cuts in education, veterans’ health benefits, medical research, and environmental protection, along with reductions in numerous programs for low-income families.
In addition, it is worth remembering that the tax reconciliation bill is the second of two reconciliation bills authorized under last year’s budget resolution. The first, which was presented as a deficit-reduction measure, contained significant reductions in Medicaid and some other federal programs that directly affect low-income families and children or low-income people who are elderly or have serious disabilities. If these measures are considered to be partial offsets for the cost of the tax reconciliation bill, then this confirms that low- and middle-income households are net losers from the tax cuts. More than any of the financing methods considered above, the spending reconciliation bill (which enacted savings over five years equal to a little more than half the cost of the tax bill) imposed significant burdens on households with modest incomes while demanding little sacrifice from high-income households.
In the end, there is no free lunch: one way or another, future households eventually must foot the bill for tax cuts that are now financed by borrowing.[7] When these long-term costs are taken into account, as they should be in evaluating the legislation’s effects, the bill is likely to be damaging rather than beneficial for most Americans.
End Notes
[1] Aviva Aron-Dine is a research assistant at, and Isaac Shapiro an associate director of, the Center on Budget and Policy Priorities. Leonard E. Burman is the director of the Urban Institute-Brookings Institution Tax Policy Center and a senior fellow at the Urban Institute. Views expressed in this piece do not represent those of the Urban Institute, its board, or its funders. The authors wish to thank Jeff Rohaly for providing the estimates underlying this analysis.
[2] “President Urges Senate to Pass Tax Cut Legislation,” White House release, May 10, 2006.
[3] Chairman Alan Greenspan in “US Representative Jim Nussle (R-IA) Holds Hearings on the Budget and the Economy,” FDCH Political Transcripts, September 8, 2004.
[4] The Tax Policy Center figures are based on estimates of the value the tax cuts would have for different groups of households in a single year, 2006, if they were all fully in effect in that year. (The TPC distribution tables are available at www.taxpolicycenter.org, Tables T06-0088 through T06-0093.) While different provisions of the bill are in effect in different years and for different lengths of time, taking into account these complications would not change our key findings. In fact, the tax bill would appear even more skewed to high-income households if one took these differences into account. Most notably, the calculations presented here reflect only a one-year extension of the capital gains and dividend tax cuts, even though these provisions are extended for two years by the bill. The calculations also reflect only the IRA rollovers that would occur in 2010; yet the bill would actually result in a growing share of savings being sheltered from tax over time. (See Leonard E. Burman, “The IRA Conversion Provision in the 2006 Tax Reconciliation Bill: Smoke and Mirrors,” May 11, 2006. Available at http://www.urban.org/UploadedPDF/1000977_IRA_Conversion_Provision.pdf.) Since these two provisions are heavily tilted toward high-income households, accounting for their full effects would show even larger losses for middle-income households than are shown here, when measures to pay for the tax cuts are taken into account.
[5] This net loss is the sum of the household’s $20 tax cut and its $450 share of the tax cut’s cost.
[6] Under this third scenario, the top one percent of households would lose by an average of $920, but the very highest income households, those in the top 0.1 percent, would gain by an average of $13,600.
[7] The households paying for the tax cuts would not be exactly the same households as those receiving the benefits, and some households will move between income quintiles over time. This does not change the reality, however, that the tax cuts eventually must be paid for, and that, unless their costs are borne almost exclusively by the high-income households now receiving large benefits from them, the vast majority of households will lose overall from the deal.
Más de los autores