MÁS ALLÁ DE LOS NÚMEROS
ACA Marketplace Enrollment Shrank in Nearly Every State After Premium Tax Credit Enhancements Expired
Effectuated enrollment in the Affordable Care Act (ACA) marketplaces shrank in nearly every state after premium tax credit (PTC) enhancements expired, new data from the Centers for Medicare & Medicaid Services (CMS) show. An accompanying report found that nationally, effectuated enrollment in the ACA marketplaces declined by nearly 3 million people between February 2025 and February 2026.
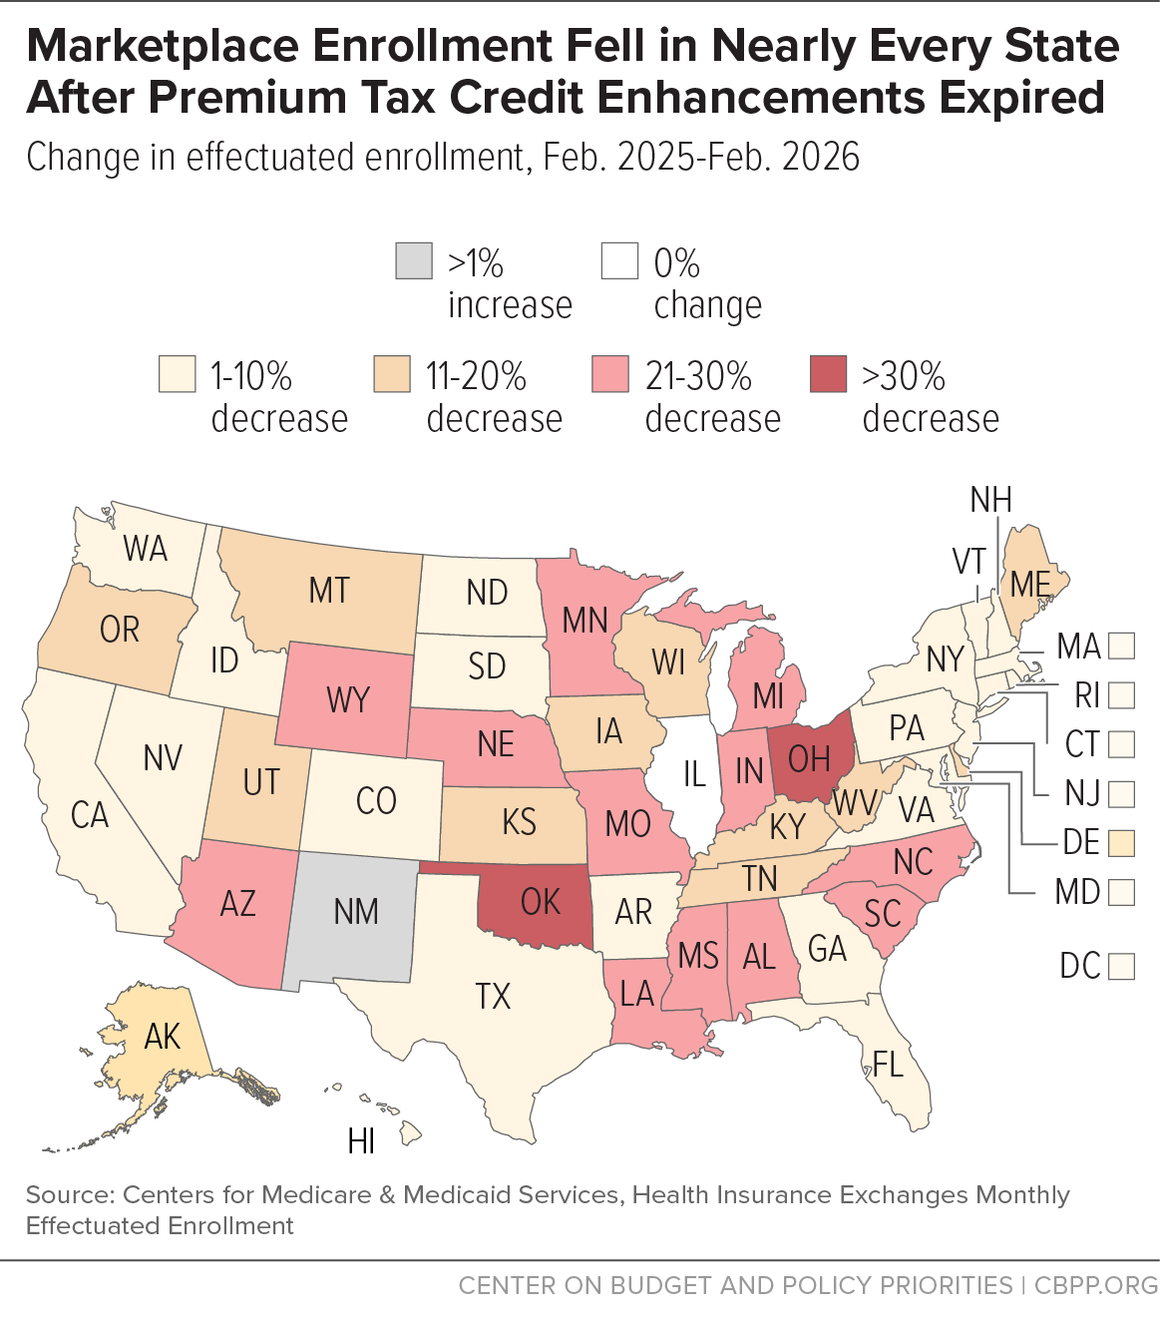
Earlier this year, CMS released data showing the number of people who selected a plan on the ACA marketplaces during the open enrollment period (November 1, 2025 through January 16, 2026 in most states). These latest data show how many people paid their first month’s premium and effectuated coverage as of February 2026. (People with $0 net premiums automatically effectuate coverage.)
The new CMS data indicate that state-based marketplaces (SBMs) generally experienced less severe coverage losses than states using the federally facilitated marketplace, HealthCare.gov. Several SBMs have acted to reduce premiums and mitigate the harm caused by the loss of federal subsidies. (CMS’s numbers differ from those released by SBMs earlier this year, likely due to differences in measurement, data collection methods, and timing.)
The premium tax credit enhancements made coverage more affordable for millions. Congressional Republicans’ decision to let them expire has increased premium costs for people across the country.
| TABLE 1 | ||||
|---|---|---|---|---|
Changes in ACA Marketplace Effectuated Enrollment | ||||
| State | Marketplace Effectuated Enrollment, February 2025 | Marketplace Effectuated Enrollment, February 2026 | Change in Effectuated Enrollment (number of enrollees) | Percent Change in Effectuated Enrollment |
| Total US | 21,776,626 | 19,169,148 | -2,607,478 | -12% |
| Alabama | 418,815 | 324,504 | -94,311 | -23% |
| Alaska | 27,052 | 23,546 | -3,506 | -13% |
| Arizona | 363,110 | 255,927 | -107,183 | -30% |
| Arkansas | 144,140 | 129,699 | -14,441 | -10% |
| California* | 1,971,965 | 1,847,315 | -124,650 | -6% |
| Colorado* | 260,973 | 242,970 | -18,003 | -7% |
| Connecticut* | 150,483 | 148,596 | -1,887 | -1% |
| Delaware | 44,290 | 36,282 | -8,008 | -18% |
| District of Columbia* | 13,432 | 12,973 | -459 | -3% |
| Florida | 4,292,372 | 3,849,587 | -442,785 | -10% |
| Georgia* | 1,298,071 | 1,188,140 | -109,931 | -8% |
| Hawai'i | 23,025 | 20,974 | -2,051 | -9% |
| Idaho* | 116,478 | 113,957 | -2,521 | -2% |
| Illinois* | 423,727 | 421,852 | -1,875 | 0% |
| Indiana | 281,215 | 203,119 | -78,096 | -28% |
| Iowa | 124,311 | 103,253 | -21,058 | -17% |
| Kansas | 179,920 | 143,880 | -36,040 | -20% |
| Kentucky* | 90,443 | 77,526 | -12,917 | -14% |
| Louisiana | 264,790 | 195,759 | -69,031 | -26% |
| Maine* | 62,381 | 54,800 | -7,581 | -12% |
| Maryland* | 235,924 | 223,483 | -12,441 | -5% |
| Massachusetts* | 351,117 | 338,197 | -12,920 | -4% |
| Michigan | 488,139 | 357,350 | -130,789 | -27% |
| Minnesota* | 145,967 | 104,788 | -41,179 | -28% |
| Mississippi | 260,289 | 191,631 | -68,658 | -26% |
| Missouri | 347,424 | 260,999 | -86,425 | -25% |
| Montana | 72,195 | 63,975 | -8,220 | -11% |
| Nebraska | 130,407 | 100,622 | -29,785 | -23% |
| Nevada* | 107,749 | 99,663 | -8,086 | -8% |
| New Hampshire | 62,584 | 57,716 | -4,868 | -8% |
| New Jersey* | 499,872 | 471,801 | -28,071 | -6% |
| New Mexico* | 69,915 | 80,047 | 10,132 | 14% |
| New York* | 201,997 | 186,497 | -15,500 | -8% |
| North Carolina | 774,226 | 609,544 | -164,682 | -21% |
| North Dakota | 40,650 | 37,472 | -3,178 | -8% |
| Ohio | 497,443 | 336,058 | -161,385 | -32% |
| Oklahoma | 265,157 | 179,600 | -85,557 | -32% |
| Oregon | 129,546 | 105,911 | -23,635 | -18% |
| Pennsylvania* | 478,353 | 472,627 | -5,726 | -1% |
| Rhode Island* | 41,994 | 39,991 | -2,003 | -5% |
| South Carolina | 546,335 | 387,145 | -159,190 | -29% |
| South Dakota | 51,268 | 45,888 | -5,380 | -10% |
| Tennessee | 513,772 | 441,515 | -72,257 | -14% |
| Texas | 3,423,543 | 3,277,198 | -146,345 | -4% |
| Utah | 400,330 | 337,266 | -63,064 | -16% |
| Vermont* | 32,287 | 28,968 | -3,319 | -10% |
| Virginia* | 368,519 | 338,768 | -29,751 | -8% |
| Washington* | 296,073 | 269,993 | -26,080 | -9% |
| West Virginia | 56,962 | 49,508 | -7,454 | -13% |
| Wisconsin | 291,329 | 245,753 | -45,576 | -16% |
| Wyoming | 44,267 | 34,514 | -9,753 | -22% |
* State-based marketplaces. The remaining states are either federally facilitated marketplaces or state-based marketplaces that use the federal platform. Source: Centers for Medicare & Medicaid Services, Health Insurance Exchanges Monthly Effectuated Enrollment | ||||