The massive and multifaceted policy responses to the financial crisis and Great Recession — ranging from traditional fiscal stimulus to tools that policymakers invented on the fly — dramatically reduced the severity and length of the meltdown that began in 2008; its effects on jobs, unemployment, and budget deficits; and its lasting impact on today’s economy.
Without the policy responses of late 2008 and early 2009, we estimate that:
- The peak-to-trough decline in real gross domestic product (GDP), which was barely over 4%, would have been close to a stunning 14%;
- The economy would have contracted for more than three years, more than twice as long as it did;
- More than 17 million jobs would have been lost, about twice the actual number.
- Unemployment would have peaked at just under 16%, rather than the actual 10%;
- The budget deficit would have grown to more than 20 percent of GDP, about double its actual peak of 10 percent, topping off at $2.8 trillion in fiscal 2011.
- Today’s economy might be far weaker than it is — with real GDP in the second quarter of 2015 about $800 billion lower than its actual level, 3.6 million fewer jobs, and unemployment at a still-dizzying 7.6%.
We estimate that, due to the fiscal and financial responses of policymakers (the latter of which includes the Federal Reserve), real GDP was 16.3% higher in 2011 than it would have been. Unemployment was almost seven percentage points lower that year than it would have been, with about 10 million more jobs.
To be sure, while some aspects of the policy responses worked splendidly, others fell far short of hopes. Many policy responses were controversial at the time and remain so in retrospect. Indeed, certain financial responses were deeply unpopular, like the bank bailouts in the Troubled Asset Relief Program (TARP). Nevertheless, these unpopular responses had a larger combined impact on growth and jobs than the fiscal interventions. All told, the policy responses — the 2009 Recovery Act, financial interventions, Federal Reserve initiatives, auto rescue, and more — were a resounding success.
Our findings have important implications for how policymakers should respond to the next financial crisis, which will inevitably occur at some point because crises are an inherent part of our financial system. As explained in greater detail in Section 5:
- It is essential that policymakers employ “macroprudential tools” (oversight of financial markets) before the next financial crisis to avoid or minimize asset bubbles and the increased leverage that are the fodder of financial catastrophes.
- When financial panics do come, regulators should be as consistent as possible in their responses to troubled financial institutions, ensuring that creditors know where their investments stand and thus don’t run to dump them when good times give way to bad.
- Policymakers should not respond to every financial event, but they should respond aggressively to potential crises — and the greater the uncertainty, the more policymakers should err on the side of a bigger response.
- Policymakers should recognize that the first step in fighting a crisis is to stabilize the financial system because without credit, the real economy will suffocate regardless of almost any other policy response.
- To minimize moral hazard, bailouts of companies should be avoided. If they are unavoidable, shareholders should take whatever losses the market doles out and creditors should be heavily penalized. Furthermore, taxpayers should ultimately be made financially whole and better communication with the public should be considered an integral part of any bailout operation.
- Because fiscal and monetary policy interactions are large, policymakers should use a “two-handed” approach (monetary and fiscal) to fight recessions — and, if possible, they should select specific monetary and fiscal tools that reinforce each other.
- Because conventional monetary policy — e.g., lowering the overnight interest rate — may be insufficient to forestall or cure a severe recession, policymakers should be open to supplementing conventional monetary policy with unconventional monetary policies, such as the Federal Reserve’s quantitative easing (QE) program of large-scale financial asset purchases, especially once short-term nominal interest rates approach zero.
- Discretionary fiscal policy, which has been a standard way to fight recessions since the Great Depression, remains an effective way to do so, and the size of the stimulus should be proportionate to the magnitude of the expected decline in economic activity.
- Policymakers should not move fiscal policy from stimulus to austerity until the financial system is clearly stable and the economy is enjoying self-sustaining growth.
The worldwide financial crisis and global recession of 2007-2009 were the worst since the 1930s. With luck, we will not see their likes again for many decades. But we will see a variety of financial crises and recessions, and we should be better prepared for them than we were in 2007. That’s why we examined the policy responses to this most recent crisis closely, and why we wrote this paper.
We provide details of the methods we used to generate the findings summarized above. But generally speaking, we use the Moody’s Analytics model of the macroeconomy to simulate how growth, jobs, unemployment, and other variables might have evolved in the absence of the policy. We then compare this simulated path to what actually happened, identifying the differences as the impacts of the policy. That’s a standard approach, one that, for example, the Congressional Budget Office used to evaluate the Recovery Act (whose findings, as we show, are similar to our own).
Table 1 shows the estimated impacts of the full panoply of policy responses, along with the impacts of two specific sub-categories: fiscal stimulus and the financial response. The columns show how much the policies boosted real GDP and jobs, and how much they reduced unemployment, in the years 2009-2012. (Details in the paper provide quarterly data through the second quarter of 2015 and include impacts on inflation as well.)
| TABLE 1 | |||||
|---|---|---|---|---|---|
| Policy Responses to the Great Recession Boosted GDP and Jobs and Reduced Unemployment | |||||
| Cumulative Boost to Real GDP (%) | Cumulative Number of Jobs Added (Millions) | Cumulative Change in Unemployment (Percentage Points) | |||
| Total Policy Response | 2009 | 6.0 | 3.6 | -2.0 | |
| 2010 | 13.5 | 8.5 | -5.4 | ||
| 2011 | 16.3 | 10.1 | -6.8 | ||
| 2012 | 16.0 | 9.9 | -6.7 | ||
| Fiscal Stimulus, including Recovery Act | 2009 | 1.6 | 0.8 | -0.3 | |
| 2010 | 3.6 | 2.7 | -1.2 | ||
| 2011 | 3.3 | 2.7 | -1.7 | ||
| 2012 | 2.9 | 2.2 | -1.4 | ||
| Financial Response | 2009 | 2.8 | 2.1 | -1.0 | |
| 2010 | 5.6 | 4.5 | -2.7 | ||
| 2011 | 5.6 | 4.9 | -2.9 | ||
| 2012 | 6.4 | 4.9 | -2.8 | ||
The economic expansion would have taken much longer without the massive and unprecedented responses of policymakers.Policymakers clearly made mistakes leading up to the financial crisis and Great Recession. They failed to prevent the housing and bond bubbles from inflating, under-regulated the financial system, and erred by treating the prospective failures of Bear Stearns and Lehman Brothers so differently. Not every one of their monetary, financial, and fiscal policies after the day Lehman Brothers filed for bankruptcy was effective, and the policymaking process was messy at times. But, as a whole, the policy response was a huge success. Without it, we might have experienced something approaching Great Depression 2.0.
Today, the economic expansion is more than six years old — longer than most expansions — and we’re approaching full employment. It’s been a long time coming, but it would have taken much longer without the timely, massive, and unprecedented responses of policymakers.
In July of 2010, the two of us published a comprehensive analysis of the panoply of policy interventions that, we argued, successfully mitigated the Great Recession and put the U.S. economy on the road to recovery.[1] The estimated impacts were significant. For example, we estimated that all the policies together reduced the peak-to-trough decline in real GDP by about 70% and held the maximum unemployment rate to 10% rather than letting it top out near 16%.
To this day, that analysis — in which we used the Moody’s Analytics U.S. Macro Model extensively[2] — remains the only attempt we know of to assess the quantitative impacts of the entire package of policies (or at least most of them) promulgated by the Federal Reserve, the Treasury Department, the White House and Congress, and others. Now, with the benefit of a newly revised macro model, five more years of data, and a variety of published studies of individual pieces of policy, this paper is the second.
But it’s more than that:
- Section 1 provides a very brief description of the origins of the cataclysm that hit us in 2007-2008.[3]
- Section 2 explains the numerous and sometimes creative policy interventions — fiscal, monetary, and financial — that policymakers deployed to limit the financial damage and mitigate the recession.
- Section 3 uses the Moody’s model to assess the impacts of these policies on major macro variables, both as a whole and in parts. (Sections 2 and 3, which are the heart of this paper, replicate and extend our 2010 paper, and we find that our original estimates hold up well.)
- Section 4 addresses some of the major criticisms of the policies and briefly reviews some criticisms of our method of assessing their effects and some other studies — not based on macro econometric models — that have evaluated the effectiveness of some of the same policies.
- Finally, Section 5 seeks to draw lessons for the future. While it seems most unlikely that history will repeat itself, Mark Twain has reminded us that it often rhymes.
Section 1: Back to the Thirties?: What Hit Us
The U.S. and quite a few other countries experienced massive asset-price bubbles during the 2000s. Two kinds, mainly. The first was the well-known house-price bubble, which began in the early 2000s in the U.S. and started to burst in 2006 or 2007 (depending on which price index you use). The second was a global bubble in the prices of fixed-income securities—a “bond bubble,” for short—or, what amounts to the same thing, the compression of risk premia to inexplicably low levels as investors either ignored or underpriced risk. As one stunning and poignant example, consider that the spread between Greek and German 10-year sovereign bond yields was razor-thin—below 35 basis points—for years up until just before the crisis hit.
When the housing and bond bubbles burst at about the same time, asset holders suffered huge capital losses. (Stock markets also swooned.) Worse yet, many investors had leveraged their positions, in some cases heavily, thereby magnifying the losses. Mountains of derivatives (MBS, CDOs, CDS, etc.), some of them complex and opaque, had been built upon the shaky foundations of dubious mortgages, inflated house prices, and compressed risk spreads—often creating huge amounts of additional leverage.
This complex, opaque, overleveraged and under-regulated house of cards began to shake, gently at first, in July 2007 when Bear Stearns told investors that there was “effectively no value left” in one of its mortgage-related funds. Market jitters got even worse in August, when BNP Paribas halted withdrawals on three funds based on U.S. subprime mortgages, telling its investors that “the complete evaporation of liquidity” in these markets “made it impossible to value [these] assets fairly.” HSBC quickly followed, closing its U.S. subprime mortgage lending business in September 2007.[4]
The financial system was under mounting pressure thereafter, with markets experiencing a frightening roller-coaster ride, moving up and down as the ebb and flow of news varied from merely bad to truly horrible. But the world’s financial system might not have collapsed as it subsequently did were it not for the inconsistent handling of a pair of stumbling investment banks: Bear Stearns and Lehman Brothers.
The stock- and bondholders of these two institutions were treated very differently by policymakers working to quell the gathering panic. Bear’s shareholders lost most—but not quite all—of their equity when JP Morgan Chase took it over, but Bear’s creditors were made whole by JP Morgan with help from the Fed. Almost six months later, shareholders and creditors of mortgage giants Fannie Mae and Freddie Mac received similar treatments. But on September 15, 2008, Lehman was sent to bankruptcy court, and everything fell apart. Lehman shareholders and bondholders were wiped out, thereby “solving” what economists call the moral hazard problem, an economic distortion that arises when a person or firm believes that part of its risk will be covered by some third party. After Lehman, creditors in other financial institutions no longer knew whether the U.S. government stood behind the financial system. Interbank lending stopped, risk spreads soared, and the worldwide financial crisis was on. Within days, the U.S. government, which had decided not to “bail out” Lehman, found itself bailing out or otherwise saving AIG, Bank of America, Citigroup, Goldman Sachs, Morgan Stanley, money market mutual funds, the commercial paper market, and much else.
What happened in the financial markets did not stay in the financial markets. The U.S. economy had been sputtering but not contracting before the Lehman bankruptcy.[5] But after Lehman, it began to fall at a frightening pace: Real GDP declined by an annualized 8.2% in the fourth quarter of 2008 and 5.4% in the first quarter of 2009. Around that time, many people who are not prone to hysteria talked openly about the prospects of “Great Depression 2.0.”
It did not happen, however; and we argue here (as we did in our 2010 paper) that one major reason was the extraordinary policy response from the Federal Reserve, the Treasury, the Federal Deposit Insurance Corp., the Federal Housing Administration, and Congress.[6] The list of policy initiatives that we present in Section 3 is long and complex. But a handful stand out. We believe, and offer supporting evidence below, that the economy would have fallen much further were it not for aggressive actions taken by the Fed and FDIC to shore up liquidity in the financial system early in the crises in late 2008: the Troubled Asset Relief Program, or TARP, passed in early October 2008; the bank stress tests, or SCAP, announced in February 2009 and completed in May 2009; the large fiscal stimulus known as the American Recovery and Reinvestment Act, passed in mid-February 2009; and the unprecedented easing of monetary policy that included near-zero short-term interest rates, which continue today, and several rounds of quantitative easing, the last of which ended in late 2014.
These policies, each one complex and controversial, led, we believe, to a surprising result: Even though the U.S. was at the epicenter of the financial crisis, we experienced one of the milder recessions in the world. For example, the peak-to-trough decline in real GDP in the U.S. was only 4.1%, compared with 6.9% in Germany (which had no housing bubble) and 6% in the U.K. (which did). Even in Canada, where there was neither a housing bubble nor a homegrown financial crisis, the GDP decline matched our own. Most other countries fared worse.
Recovery from the recession has been another matter, however. There the U.S. has less to brag about. In the six years since the official recession trough in the second quarter of 2009, U.S. GDP growth has averaged a mediocre 2.1% per annum. Only miserable productivity performance turned this sluggish GDP growth into millions of new jobs and a 4.7-percentage point drop in the unemployment rate since its peak in April 2010.
Part of the reason for the weak recovery, we will argue in Section 4, is that fiscal policy turned notably contractionary beginning in 2011. In addition, political brinkmanship that led to a government shutdown in October 2013 and a near default on the Treasury’s debt payments created enormous uncertainties in an already-uncertain time. That weighed heavily on the collective psyche and presumably on business expansion plans. Even today, the long shadow of the Great Recession still constricts the flow of residential mortgage credit, particularly to first-time homebuyers, slowing the recovery from the housing bust.
Despite the recovery’s disappointing performance, it has been much better than that of nearly all other countries that have suffered financial crises over the years. Japan is still trying to dig out from its financial implosion of a quarter century ago. History shows that making it back from a financial crisis is very difficult,[7] but the U.S. economy in recent years has done better than most.
How the U.S. economy fared on the way down and on the way back up are matters of historical record. But parsing out the portions attributable to policy actions—whether in cushioning the downturn or supporting the recovery—requires a counterfactual: How would the economy have performed in the absence of some or all of the policy interventions? To answer questions like these, one needs a model; and in Section 4 we rely mostly on the Moody’s Analytics model.
Section 2: The Policy Response: Massive and Multifaceted
The policy responses to the financial crisis and the Great Recession were massive and multifaceted (see Table 2). Not only did they include the aggressive use of standard monetary and fiscal policy tools, but new tools were invented and implemented on the fly in late 2008 and early 2009. Some aspects of the response worked splendidly, while others fell far short of hopes, and many were controversial—both in real time and even in retrospect. In total, however, we firmly believe that the policies must be judged a success.
| TABLE 2 | ||
|---|---|---|
| Cost of Federal Government Response to the Financial Crisis (billions of dollars) | ||
| Originally Committed | Ultimate Cost | |
| Total | 12,332 | 1,640 |
| Federal Reserve | 6,699 | 15 |
| Term auction credit | 900 | 0 |
| Other loans | Unlimited | 3 |
| Primary credit | Unlimited | 0 |
| Secondary credit | Unlimited | 0 |
| Seasonal credit | Unlimited | 0 |
| Primary Dealer Credit Facility (expired 2/1/2010) | Unlimited | 0 |
| Asset-Backed Commercial Paper Money Market Mutual Fund | Unlimited | 0 |
| AIG | 26 | 2 |
| AIG (for SPVs) | 9 | 0 |
| AIG (for ALICO, AIA) | 26 | 1 |
| Rescue of Bear Sterns (Maiden Lane)** | 27 | 4 |
| AIG-RMBS purchase program (Maiden Lane II)** | 23 | 1 |
| AIG-CDO purchase program (Maiden Lane III)** | 30 | 4 |
| Term Securities Lending Facility (expired 2/1/2010) | 200 | 0 |
| Commercial Paper Funding Facility** (expired 2/1/2010) | 1,800 | 0 |
| TALF | 1,000 | 0 |
| Money Market Investor Funding Facility (expired 10/30/2009) | 540 | 0 |
| Currency swap lines (expired 2/1/2010) | Unlimited | 0 |
| Purchase of GSE debt and MBS (3/31/2010) | 1,425 | 0 |
| Guarantee of Citigroup assets (terminated 12/23/2009) | 286 | 0 |
| Guarantee of Bank of America assets (terminated) | 108 | 0 |
| Purchase of long-term Treasuries | 300 | 0 |
| Treasury | 1,160 | 40 |
| TARP | 600 | 40 |
| Fed supplementary financing account | 560 | 0 |
| Fannie Mae and Freddie Mac**** | Unlimited | 0 |
| FDIC | 2,913 | 75 |
| Guarantee of U.S. banks' debt* | 1,400 | 4 |
| Guarantee of Citigroup debt | 10 | 0 |
| Guarantee of Bank of America debt | 3 | 0 |
| Transaction deposit accounts | 500 | 0 |
| Public-Private Investment Fund Guarantee | 1,000 | 0 |
| Bank resolutions | Unlimited | 71 |
| Federal Housing Administration | 100 | 26 |
| Refinancing of mortgages, Hope for Homeowners | 100 | 0 |
| Expanded Mortgage Lending | Unlimited | 26 |
| Congress | 1,460 | 1,484 |
| Economic Stimulus Act of 2008 | 170 | 170 |
| American Recovery and Reinvestment Act of 2009*** | 808 | 832 |
| Cash for clunkers | 3 | 3 |
| Additional emergency UI benefits | 90 | 90 |
| Education Jobs and Medicaid Assistance Act | 26 | 26 |
| Other stimulus | 20 | 20 |
| Tax Relief, Unemployment Insurance Reauthorization, and Job Creation Act of 2010 | 189 | 189 |
| Temporary Payroll Tax Cut Continuation Act of 2011 | 29 | 29 |
| Middle Class Tax Relief and Job Creation Act of 2012 | 125 | 125 |
The essential first steps were a series of emergency rescue operations of the financial system—something that is never popular. The Federal Reserve flooded the system with liquidity, throwing a lifeline first to banks, then also to money-market funds, commercial paper issuers, broker-dealers, insurance companies, and investment banks. These initial steps were critical because financial institutions had all but stopped lending to one another, fearful of being dragged over the brink by another failing institution—a fear that was not unreasonable after Lehman Brothers collapsed. The FDIC acted by raising insurance limits on bank deposits to quell what appeared to be silent runs at some major banks,[8] and by guaranteeing debt issued by depository institutions, which had been all but locked out of the bond market.[9] It seems fair to say that, absent a dire emergency, neither the Fed nor the FDIC would have considered any of these extraordinary measures.
Although the Fed’s efforts were substantial and valiant, they were insufficient. Congress needed to act as well. After much hand-wringing, it did, by establishing a $700 billion bailout fund known as the Troubled Asset Relief Program. Congress initially voted TARP down, but quickly reversed itself after stockholders furiously dumped shares in reaction. The word “TARP” remains political poison to this day. No member of Congress wanted to be known for supporting a bailout of the Wall Street institutions that were at the root of the crisis. But doing so was essential.
In fact, TARP’s real purpose was not to save Wall Street, but to protect Main Street. Yes, many banks were bailed out by receiving capital they desperately needed to survive. But had the banks failed, credit to businesses and households would have dried up, pushing the already-reeling economy deeper into the abyss.
The $700 billion authorized by Congress for TARP was never fully committed, and the ultimate cost to taxpayers will come in closer to $40 billion—far below initial loss estimates.[10] And much of that loss is accounted for by the auto bailout, which was not part of TARP’s original purpose (see Table 3). Taxpayers actually made money on the part of TARP, which was the majority, that was used to bail out the financial system—although, of course, virtually all investors lost money when the financial system imploded. A few small-bank recipients of TARP money were not able to pay it back, but most, including all the large banks, repaid with both interest and capital gains on warrants.
| TABLE 3 | ||
|---|---|---|
| Troubled Asset Relief Program (billions of dollars) |
||
| Originally Committed | Ultimate Cost | |
| Total | 600 | 40 |
| Financial System Bailout | 450 | -5 |
| Capital Purchase Plan | 250 | -16 |
| Systemically Important Institutions | 115 | 15 |
| Federal Reserve (TALF) | 55 | -1 |
| Public-Private Investment Fund (PPIP) | 30 | -3 |
| Auto Bailout | 84 | 17 |
| GM | 64 | 14 |
| Chrysler | 15 | 3 |
| Auto suppliers | 5 | 0 |
| Small-Business Aid | 15 | 0 |
| SBA loan purchase | 15 | 0 |
| Community Development Capital Initiative | N/A | 0 |
| Housing Bailout | 52 | 28 |
| Homeowner Affordability and Stability Plan | 52 | 28 |
| FHA Short Refinance program | N/A | 0 |
The financial panic was not fully subdued, however, until the biggest financial institutions were forced to recapitalize. In the spring of 2009, regulators demanded that banks figure out how much capital they needed in order to withstand massive losses comparable to those suffered in the Great Depression—the so-called stress tests. Then, if short, the bankers would have to go out and raise that much new equity from private investors. If they failed, they would have to accept capital from the government (using TARP funds) on highly unfavorable terms.
Bankers objected to this exercise loudly at first, since the stress tests were new and complex, and the thought of going hat in hand to investors for more capital was unpalatable. But regulators wisely overruled the banks, and the stress tests worked—probably better than anyone imagined. America’s banks were recapitalized, and both the markets and the bankers themselves were reassured that the system was sound. A few short months after the U.S. financial system had effectively collapsed, it was up and running again. Note that stress-testing requires very little public spending, and hence provides a huge “big bang for the buck.”
Stress-testing has since become a standard part of global financial regulation. When asked what he likes most about financial regulatory reform, former Fed Chairman Ben Bernanke often points to stress-testing.[11] European authorities have also conducted extensive stress tests, and the International Monetary Fund advocates their adoption by all member countries. The largest financial institutions in the world now stress-test their balance sheets and income statements every year; it has become a critical part of risk and capital management.
After getting the financial system back on solid ground, policymakers turned their attention to the faltering economy. The Federal Reserve jettisoned its historic go-slow approach, slashing short-term interest rates virtually to zero by December 2008. The Fed also brought out new monetary tools that had previously existed only in theory. Most notably, it engaged in quantitative easing, or QE, which entailed the purchase of trillions of dollars in Treasury and agency securities (such as mortgage-backed securities issued by government-sponsored enterprises). It also offered market participants a lot more forward guidance—in various forms—than it ever had before.
QE has its downsides, but it substantially lowered long-term interest rates.[12] Within a short time, homebuyers with good jobs and high credit scores could obtain mortgages at record low rates, which helped end the housing crash. QE also significantly lifted stock prices. The Fed had misjudged events leading up to the financial crises, but it committed itself to avoiding the same mistakes afterward.[13]
Away from Wall Street and the banks, the U.S. auto industry posed an especially vexing problem for the Bush and Obama administrations and Congress. U.S. automakers had been losing market share to more efficient foreign producers (including transplants on U.S. soil) for decades. Then the Great Recession hit and rising unemployment and shrinking credit made it much harder for Americans to afford new cars. Vehicle sales collapsed. Profits suffered even more, as the automakers tried desperately to maintain sales volumes by offering aggressive discounts and easier financing terms. By early 2009, GM and Chrysler were careening toward bankruptcy.
Worse, the turmoil in financial markets meant that the crippled auto companies might not find financing to keep their factories running during the months or years of restructuring that a normal bankruptcy would require. The obvious alternative was liquidation. But if Chrysler and GM closed down, other auto-related firms, maybe even Ford, would follow. The list of potential casualties included a vast network of parts suppliers and dealerships all over America. Millions of jobs were at stake, especially in the Midwest and South.
Washington’s bailout of the auto industry was not pretty, and it certainly was not part of the standard playbook of economists who believe in “creative destruction.” But it forestalled something much uglier, and it was essential to the subsequent revival of the industry.[14] By most metrics, it was a success,[15] although it cost taxpayers about $17 billon in TARP money (see Table 3).
Among the biggest and most controversial efforts to end the recession was the Obama administration’s fiscal stimulus. The logic behind fiscal stimulus is straightforward: With businesses and consumers hunkered down, the government steps in by temporarily increasing its own spending and/or cutting taxes to induce households and businesses to spend more. The objective of such a stimulus is to mitigate or end recessions and/or to jump-start or propel a recovery, depending on the timing. Importantly, but often forgotten, a stimulus is not intended to speed up longer-term economic growth. To a first approximation, real GDP five years or so later should be the same with or without stimulus measures.
Using fiscal policy to combat a recession was hardly a novel idea in 2008-2009; it had been part of the response to every recession since World War II, and the size of the stimulus was always tied to the severity of the recession. The amount of the fiscal stimulus used to fight the recession of 2007-2009 was massive, however: equal to almost 10% of GDP, more than half of which came from the American Recovery and Reinvestment Act (see Table 4). But the Great Recession was the worst downturn since 1937.
| TABLE 4 | |
|---|---|
| Fiscal Stimulus During the Great Recession (billions of dollars) |
|
| Spending | |
| Total Fiscal Stimulus | 1,484 |
| Spending increases | 783 |
| Tax cuts | 701 |
| Economic Stimulus Act of 2008 | 170 |
| American Recovery and Reinvestment Act of 2009 | 832 |
| Infrastructure and other spending | 147 |
| Traditional infrastructure | 38 |
| Nontraditional infrastructure | 109 |
| Transfers to state and local governments | 188 |
| Medicaid | 93 |
| Education | 95 |
| Transfers to persons | 307 |
| Social Security | 13 |
| Unemployment assistance | 224 |
| Food stamps | 46 |
| COBRA payments | 24 |
| Tax cuts | 190 |
| Businesses & other tax incentives | 40 |
| Making Work Pay | 64 |
| First-time homebuyer tax credit | 14 |
| Individuals excluding increase in AMT exemption | 72 |
| Cash for Appliances | 0.3 |
| Cash for clunkers | 3 |
| HIRE Act (Job Tax Credit) | 17 |
| Worker, Homeownership, and Business Assistance Act of 2009 | 91 |
| Extended unemployment insurance benefits (Mar 16) | 6 |
| Extended unemployment insurance benefits (Apr 14) | 12 |
| Extended unemployment insurance benefits (May 27) | 3 |
| Extended unemployment insurance benefits (Jul 22) | 34 |
| Extended/expanded net operating loss provisions of ARRA | 33 |
| Extended/expanded homebuyer tax credit | 3 |
| Department of Defense Appropriations Act of 2010 | 2 |
| Extended guarantees and fee waivers for SBA loans | 1 |
| Expanded COBRA premium subsidy | 1 |
| Education Jobs and Medicaid Assistance Act | 26 |
| Tax relief, unemployment insurance reauthorization, and Job Creation Act of 2010 | 189 |
| Temporary extension of UI benefits (outlay) | 56 |
| Temporary extension of investment incentives | 22 |
| Temporary payroll tax holiday (change in revenue) | 112 |
| Temporary Payroll Tax Cut Continuation Act of 2011 | 29 |
| Middle Class Tax Relief and Job Creation Act of 2012 | 125 |
Several rounds of fiscal stimulus measures were fired at the recession. The first consisted of the tax rebates sent out near the end of the Bush administration. The largest—and most lastingly controversial—was the American Recovery and Reinvestment Act, which passed on a largely party-line vote just weeks after Barack Obama took office. The ARRA provided more than $830 billion in stimulus measures, much of it in the first three years after its passage in February 2009; about three-fourths of this was temporary spending increases, and the other fourth was tax cuts.[16] It worked. The job losses started to abate immediately,[17] and the Great Recession officially ended in June.
The stimulus was far less successful politically, however. Skepticism about its effectiveness was widespread, fueled in part by a serious marketing blunder made by the fledgling Obama administration. In selling the ARRA, also known as the Recovery Act, to a suspicious Congress, the administration argued that the act would prevent the unemployment rate from rising above 8%.[18] In fact, the unemployment rate was already about 8% by the time the administration took office—only nobody knew that. The economy was sinking so rapidly that the data could not keep up. Policymakers planning the stimulus were working with forecasts that severely underestimated how bad things would get, and with data that underestimated how bad things already were. It was a rookie mistake by the new president and his staff, but it handed their opponents a political sledgehammer with which they proceeded, inappropriately but effectively, to bash the stimulus—even claiming that it was somehow a “job killer.”
Policymakers also focused—though not nearly enough, in our view—on the plummeting housing market, which was in a depression, not just a recession. A range of policy steps had been taken, beginning with the Bush administration’s temporary tax break on mortgage debt forgiven in a short sale and with Hope for Homeowners, which was largely wishful thinking.
The Obama administration acted more aggressively, empowering government lenders Fannie Mae, Freddie Mac, and the FHA to fill the hole created by the collapse of private mortgage lending. The FHA’s response was especially forceful. While the credit spigot closed for nearly all borrowers during the financial crisis, it remained open for mortgage borrowers because of the FHA—which was precisely what the agency’s New Deal-era designers had in mind when they set it up. Without a steady flow of credit from the FHA, the housing market might have completely shut down, taking the already-reeling economy with it.
Government policy also succeeded in breaking the vicious deflationary psychology that had gripped the housing market. A series of tax credits for first-time homebuyers, each of which lasted only a few months, gave buyers a compelling reason to act rather than to wait for prices to fall further. Home sales gyrated as the credits were extended, withdrawn, and then extended again—an element of volatility directly attributable to the government. But at least the free fall in home sales and prices stopped.
Probably the least effective of the Obama administration’s policy responses to the housing crash involved mortgage loan modifications and refinancings. Because foreclosure is costly to both homeowners and financial institutions, government officials hoped to persuade banks to change the terms of troubled mortgage loans, lowering either the interest rate or the principal owed, so as to keep homeowners in their homes. Loosening the rules on refinancing so that troubled homeowners could reduce their monthly payments also seemed promising. But these ideas worked better in theory than in practice. The Making Home Affordable Program, introduced by President Obama in mid-February 2009, was designed to push both modifications and refinancing. But it was underfinanced, under-promoted, and not effectively managed. While the program helped some, it fell well short of both expectations and needs.
With housing no longer in free fall and the economy recovering, policymakers turned later in 2009 to the daunting task of financial regulatory reform. The financial system’s catastrophic failure demanded a reworking of the system’s legal and regulatory plumbing. The Dodd-Frank Act, the reform legislation that became law in the summer of 2010 after a tortuous trip through Congress, made a vast number of changes to the financial system. This multifaceted law is not without its flaws, but overall it likely ensures that future financial crises will not be nearly as cataclysmic as the one we just suffered through.
One key reason for this is Dodd-Frank’s clearly defined process for dealing with potential failures of financial institutions that are too big to fail (now called SIFIs, for Systemically Important Financial Institutions). Regulators had been partly confused and partly unable to handle nonbank institutions that threatened to fail in 2008—ranging from Bear Stearns to Fannie and Freddie to Lehman to AIG. A myriad of problems arose in managing those failures and near failures, which allowed the financial shock waves to propagate.
Dodd-Frank does not solve the too-big-to-fail problem; there will always be institutions whose failure would rock the system. But the law does make it more likely that such failures will be more orderly in the future. Requiring big institutions to formulate “living wills”—guiding regulators on how to unwind the firms’ operations if they fail—also seems likely to help.
Importantly, although perhaps less well known, Dodd-Frank also institutionalized the bank stress tests that had so successfully ended the financial turmoil in 2009, thereby further reducing too-big-to-fail risk. The largest and most important financial institutions now must simulate adverse economic scenarios and study the effect on their balance sheets and income statements annually.
Dodd-Frank’s most controversial provision, however, was probably the establishment of the Consumer Financial Protection Bureau. Although critics were right to worry about the added regulatory burden created by this new agency, the CFPB put consumer interests front and center in a way they had not been before. Part of the CFPB’s mission is to ensure that financial products offered to consumers are appropriate to their needs, and that consumers have enough information to adequately evaluate these products. CFPB protections were sorely needed given the sometimes-dizzying complexity of financial services and the woeful state of consumer financial literacy—many homebuyers have a hard time understanding compound interest, never mind Libor and adjustable rate mortgages.
Dodd-Frank is far from a perfect law; some of its blemishes ought to get ironed out in subsequent legislation. In all, though, it should reduce the odds of another cataclysmic financial crisis. This does not mean that we will not experience big ups and downs, even asset-price bubbles, in the future, but these should not lead to a complete shattering of the financial system as we witnessed just a few years ago.
Section 3: Quantifying the economic impacts
To quantify the economic impacts of the aforementioned panoply of policies, we simulated the Moody’s Analytics model of the U.S. economy under different counterfactual scenarios. In all scenarios, the federal government’s automatic stabilizers—the countercyclical tax and spending policies that are implemented without explicit approval from Congress and the administration—are assumed to operate. So is the traditional monetary policy response via the Federal Reserve’s management of short-term interest rates, albeit constrained by the zero lower bound.[19]
To assess the full impact of the policy response, the “No Policy Response” scenario assumes that, apart from the above, policymakers simply sit on their hands in response to the crisis. They take no extraordinary fiscal or monetary measures as the turmoil mounts. While it is hard to imagine that policymakers would stand still while such a downturn intensified, many critics of the policy responses have argued that is precisely what policymakers should have done.
To isolate the economic impacts of the fiscal stimulus, the “No Fiscal Stimulus” scenario assumes that policymakers do not implement any discretionary tax cuts and government spending increases. Policymakers in this scenario do bail out the financial system, and the Federal Reserve does take extraordinary steps to provide liquidity to the financial system and engages in quantitative easing. But there is no fiscal response. The “No Recovery Act Scenario” is similar, but it focuses only on the largest and most controversial fiscal stimulus: the ARRA.
In the “No Financial Policy” scenario, we assume that the full fiscal response happens but that the Federal Reserve does not act as the lender of last resort, refusing to implement the full range of liquidity provisions and quantitative easing that it actually did. Nor is the financial system bailed out via the FDIC’s guarantee of bank debt, the bank stress-testing process, and the provision of equity capital via the TARP.
To separately analyze the economic impact of the Fed’s controversial QE program, the “No Quantitative Easing” scenario assumes that the Fed does not engage in QE, but that all other aspects of the financial rescue happen as they actually did. Finally, to isolate the impacts of the bank bailout, the “No Bank Bailout” scenario assumes that all policy steps are taken except for the Fed’s bank stress tests and the capital infusions from TARP.
The final scenario considered is the “No Auto Bailout” scenario, which examines the economic impact of policymakers’ support to the U.S. auto industry. This support was neither a fiscal stimulus nor financial policy, and is thus considered independently.
All of the scenarios are simulated using the Moody’s Analytics macro model over the period from the start of the Great Recession in 2008 through the first half of 2015. The differences between the economy’s performance under each of the scenarios and its actual performance provide the model’s estimates of the effects of the wide range of policies implemented to stem the financial crisis and end the Great Recession.
The macro model
Quantifying the economic impact of government policies is not an accounting exercise; it is an econometric one. Outcomes for employment and other measures of economic activity must be estimated by using a statistical representation of the economy based on historical relationships, such as the Moody’s Analytics macro model.
The Moody’s model is regularly used for similar purposes: forecasting, scenario analysis, bank stress-testing, and quantifying the economy-wide impacts of a range of policies. The Federal Reserve uses a similar model for its forecasting and policy analysis, as do the Congressional Budget Office and the Office of Management and Budget. Some important details about the model’s specifications are mentioned in discussing the simulation results below.[20] There are both advantages and disadvantages to using such large macroeconometric models, but no other type of model is able to consider the totality of the policy responses to the Great Recession.
Modeling fiscal stimulus
The modeling techniques for simulating the various fiscal policy responses to the economic downturn are straightforward, and have been used by countless modelers over the years. While the scale of the fiscal stimulus was massive, most of the tax and government spending instruments have been used in past recessions. So little modeling innovation was required on our part.
This does not deny that there has been a heated debate over the efficacy of fiscal stimulus measures. Much of that debate has centered on the magnitude of the multipliers generated by various fiscal policy instruments. These multipliers measure the added economic activity generated by a change in taxes or government spending.
In its analysis of the expected impacts of the ARRA, in early 2009, the Obama administration estimated government spending multipliers that were persistently near 1.5—meaning that a $1 increase in government spending results in a $1.50 increase in GDP (see Figure 1).[21] In contrast, Professor John Taylor, a critic of fiscal stimulus, estimated that the multipliers were more than 1 initially but quickly faded away.[22]
In the Moody’s Analytics macro model, the multipliers vary considerably depending on the precise fiscal policy instrument and on how far the economy is from full employment. Direct income support to low-income and unemployed individuals has some of the largest bang for the buck, with the temporary increase in SNAP benefits topping the list, as Table 5 shows.
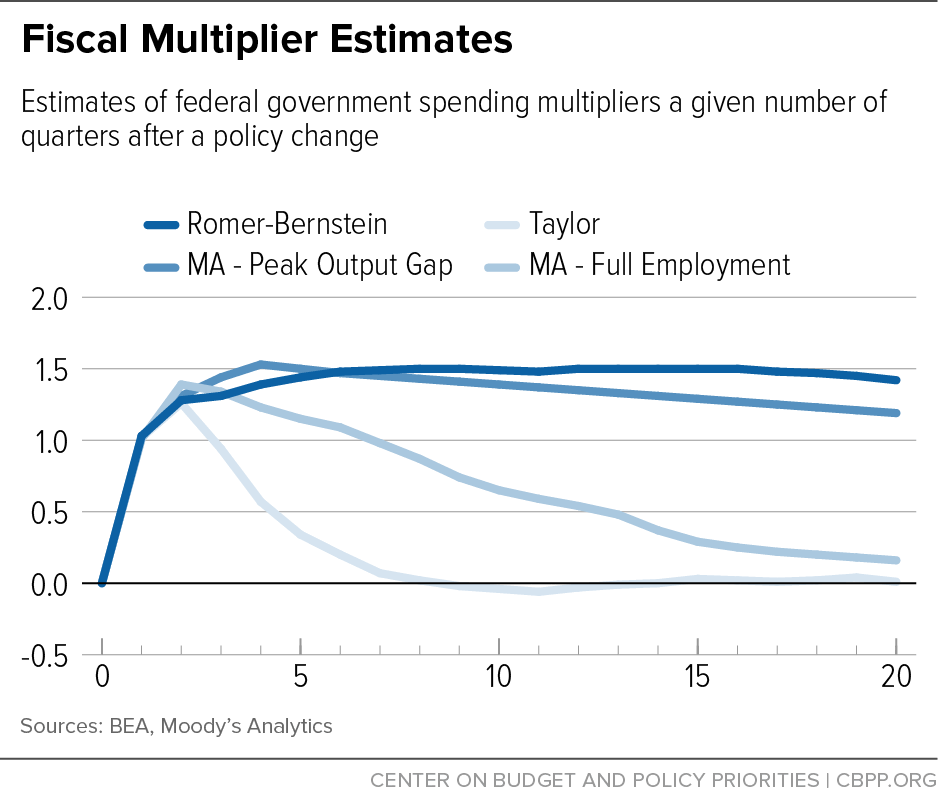
When the economy has a large output gap, that is, when actual GDP is far below potential GDP, as it was in early 2009, the multipliers are large and persistent. For example, the early-2009 multiplier for infrastructure spending in the Moody’s model is very close to what the Obama administration assumed. However, as the output gap disappears, the multipliers diminish quickly (see Figure 1). Indeed, when the output gap is zero—that is, when the economy is at full employment—the increase in government spending crowds out private sector output almost completely. The multipliers become quite small as the higher interest rates resulting from the increased government spending and larger budget deficits reduce consumer spending and business investment nearly dollar for dollar.
| TABLE 5 | ||
|---|---|---|
| Fiscal Stimulus Multipliers (estimates of the one-year change in GDP for given reductions in federal tax revenue or increases in government spending) | ||
| As of 2009 Q1 | As of 2015 Q1 | |
| Tax Cuts | ||
| Refundable lump-sum tax rebate | 1.22 | 1.03 |
| Nonrefundable lump-sum tax rebate | 1.01 | 0.69 |
| Temporary Tax Cuts | ||
| Child Tax Credit, ARRA parameters | 1.38 | 1.17 |
| Making Work Pay | 1.30 | 1.03 |
| Payroll tax holiday for employees | 1.27 | 0.94 |
| Earned income tax credit, ARRA parameters | 1.24 | 0.87 |
| Job tax credit | 1.20 | 0.85 |
| Payroll tax holiday for employers | 1.05 | 0.79 |
| Across-the-board tax cut | 1.02 | 0.66 |
| Housing tax credit | 0.90 | 0.61 |
| Accelerated depreciation | 0.29 | 0.23 |
| Loss carryback | 0.25 | 0.09 |
| Permanent Tax Cuts | ||
| Extend alternative minimum tax patch | 0.53 | 0.44 |
| Make dividend and capital gains tax cuts permanent | 0.39 | 0.34 |
| Cut in corporate tax rate | 0.32 | 0.30 |
| Spending Increases | ||
| Temporary increase in food stamps | 1.74 | 1.22 |
| Temporary federal financing of work-share programs | 1.69 | 1.13 |
| Extension of unemployment insurance benefits | 1.61 | 1.01 |
| Increase in defense spending | 1.53 | 0.87 |
| Increase in infrastructure spending | 1.57 | 0.86 |
| General aid to state governments | 1.41 | 0.58 |
| Low Income Home Energy Assistance Program (LIHEAP) | 1.13 | 0.55 |
Modeling quantitative easing
Modeling the myriad of policies used to address the collapse of the financial system was more difficult, given that most were unprecedented and unconventional. This task not only demanded some creativity, it also required us to make a number of simplifying assumptions and judgment calls.
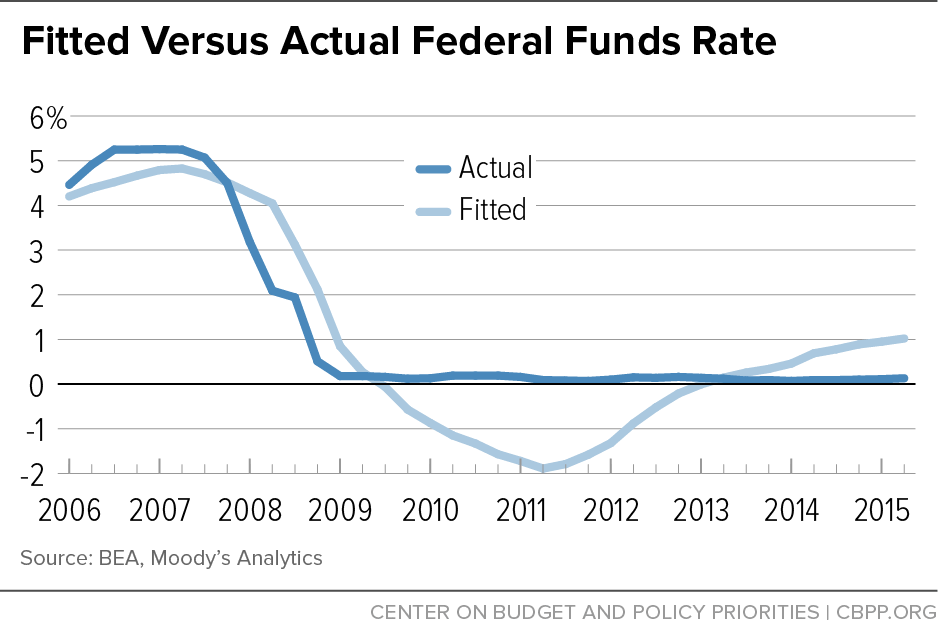
To illustrate, consider our approach to modeling the Federal Reserve’s quantitative easing programs. The federal funds rate is determined in the model by a modified Taylor rule: an equation that links the Fed’s interest rate policy to economic and financial market conditions. Specifically, the Taylor rule in the model includes a measure of the equilibrium funds rate, the difference between the unemployment rate and the natural rate, the difference between inflation (as measured by the core consumer expenditure deflator) and the Fed’s inflation target, and the VIX index—the implied volatility in Standard & Poor’s 500 index options, which is a proxy for investor confidence in the stability of the financial system (see Appendix Table A1).[23] The nominal equilibrium funds rate is determined within the model, and equals the sum of the Fed’s inflation target and the economy’s estimated growth rate of real potential GDP.[24]
Of course, the Fed reduced the funds rate rapidly when the Great Recession struck. The rate hit the 0- to 25-basis point lower bound in December 2008. A few weeks prior to that, the Fed had announced its first large-scale bond-buying program, designed to push down long-term interest rates. In the model, QE kicks in once the fitted funds rate—the funds rate determined by the modified Taylor rule—falls below zero (see Figure 2). It is captured by an expansion of the assets held on the Fed’s balance sheet. The size of the balance sheet directly impacts 10-year Treasury yields and fixed mortgage rates in the model, and those two interest rates, in turn, have wide-ranging impacts.
The magnitude of the bond-buying and balance sheet expansion is calibrated to the actual QE-related bond-buying undertaken by the Fed. Most pre-existing estimates of the impact of QE on interest rates come from event studies using “windows” of various lengths around an announcement date. Those studies typically find that QE1, which helped bring moribund markets back to life, had more bang for the buck than subsequent rounds of QE. That cannot be true given the structure of the Moody’s model. So, relative to the event-studies literature, we expect our simulations to show smaller early effects of QE1 and perhaps larger effects of subsequent rounds of QE.
Modeling the bank bailout
Modeling the channels through which the bank bailout impacted the economy is also challenging. The severity of the Great Recession was due in significant part to the collapse of the financial system, and the subsequent revival of the economy was due in no small part to the policy steps that brought the system back from the brink.
The macro model captures the interplay between the financial system and the economy through equations for commercial banks’ Tier 1 capital, net charge-offs, assets outstanding, and return on assets.
The ratio of Tier 1 capital to risk-weighted assets is a key measure used by regulators to gauge the capital adequacy of financial institutions. The bank stress-testing process, which was first implemented in early 2009, requires banks to maintain a minimum level of Tier 1 capital under a “severe adverse” scenario that is similar in severity and duration to the Great Recession.[25] The current standard is that banks must have at least a 5.5% Tier 1 capital ratio after allowing for losses from the stress scenario.
The Tier 1 capital ratio is determined in the model by banks’ returns on assets, as banks can use their profits to enhance their capital positions; by their net charge-off rates, as greater loan losses cut into capital; and by a measure of the capital that banks are required to raise to meet their regulatory minimums (see Appendix Table A2). The equity capital that the nation’s largest banks were required to take from the TARP bailout fund during the financial crisis is also accounted for.
In the model, the Tier 1 capital ratio is an important driver of bank lending standards, as measured by the Federal Reserve’s Senior Loan Officer Opinion Survey. Lending standards for commercial and industrial loans and for mortgage loans are particularly significant drivers of business investment and housing activity. As banks raise capital to meet their regulatory requirements, lending standards tighten, restricting credit availability and thus investment and housing demand. Once banks are adequately capitalized, credit conditions ease, supporting stronger investment and housing activity.
An illiquid and undercapitalized financial system also results in higher interest rates on loans, as financial institutions demand higher risk premia to compensate them for the prospect of not getting repaid in a timely manner. In the macro model, this angst in the financial system is captured by the VIX index. The VIX is a key driver of one-month Libor which, in turn, affects all interest rates in the model, including various interest rate spreads such as the spread between three-month Libor and three-month Treasury bills; the spread between fixed mortgage rates and 10-year Treasury bonds; and the spread of below-investment-grade corporate bond (“junk bond”) rates over Treasuries. Interest rate spreads rose alarmingly during the crisis, but came tumbling down once policymakers responded. The impacts of the Fed’s extraordinary liquidity provisions and the FDIC’s move to guarantee bank debt during the height of the financial crisis are also captured in the one-month Libor equation (see Appendix Table A3).
One plus one is ... three?
When quantifying the economic impact of the policy response to the financial crisis and recession, one plus one is greater than two. Because the policies reinforce each other, the combined effects of different policies exceed the sum of the effects of each of the policies taken in isolation—often by large amounts.
To illustrate this dynamic, consider the impact of providing housing tax credits, which were part of the fiscal stimulus. The tax credits boost housing demand, which pushes house prices higher. Foreclosures then decrease, so the financial system suffers smaller mortgage loan losses. These smaller losses, in turn, enhance the capital of the banking system, allowing banks to ease underwriting conditions and reduce lending rates, which supports even greater economic activity. Hence housing tax credits increase the efficacy of monetary policy.
The Federal Reserve’s effort to provide liquidity to the asset-backed securities market through the Term Asset-Backed Securities Loan Facility is another example of positive interactions. TALF was instrumental in supporting auto lending and auto sales, and thus enhancing the impact of the auto industry bailout.
There are also several important nonlinearities in the macro model that significantly amplify the economic impacts of policy changes. Particularly important in this regard is the model’s relationship between consumer spending and consumer confidence. Confidence impacts spending through the wealth effect—the change in households’ spending due to a change in their wealth. These positive wealth effects are modest when consumer confidence is low, but become larger when consumers are more confident. Therefore, a more muscular policy response to a financial crisis can have outsize economic benefits, if it lifts confidence sufficiently.
The relationship between capacity utilization and business investment is also highly nonlinear. Rising utilization rates do little to prompt more investment spending when they are low, but they have larger impacts on investment when factories, mines and utilities are operating closer to capacity. A policy response that supports a struggling economy will therefore have an extra-large economic benefit.
But the most important nonlinearity in the macro model is in the relationship between the VIX index and two key financial prices: interest rates and the value of the U.S. dollar. In the model, the VIX increases with lower capacity utilization and consumer confidence, higher price-earnings multiples for S&P 500 companies, lower bank capitalization (as measured by the Tier 1 capital ratio), and more systemic risk in the financial system as measured by the strength of the relationship between the expected default frequencies of publicly traded financial institutions (see Appendix Table A4).[26]
Movements in the VIX have outsize impacts on rates and the dollar, which in turn have large impacts on the economy. For example, big increases in the VIX signal that global investors are nervous, prompting a flight to quality into U.S. assets and an appreciation of the dollar—which is precisely what happened during the year after Bear Stearns collapsed in spring 2008. Policies that work quickly to head off such financial panic stem this flight to quality, and the economy benefits as the lower value of the dollar improves the nation’s trade balance.
What actually happened?
Before turning to the model simulations, it is worth briefly considering how the financial system and economy have performed since the extraordinary measures taken by policymakers during the crisis.
The bailout of the financial system appears to have been both highly effective and efficient. As noted earlier, the system was near collapse in the turmoil of late 2008, but was already operating well by the late spring of 2009. Liquidity in the system had been restored and the nation’s large banks had been sufficiently recapitalized to weather the mounting losses on their residential mortgages and other loans. Lenders remained cautious for a while, but credit flows began to normalize by 2011.
Many critics hold that the bankers and their creditors got unfairly bailed out by taxpayers. There is also still some unfinished business left over from the crisis response. The mortgage giants, Fannie Mae and Freddie Mac, which were put into conservatorship early in the crisis, remain stuck there, the private residential mortgage securities market remains largely dormant, and monetary policy has yet to normalize.
These are all valid criticisms, several of which will be dealt with in Section 5 below. But it is important to acknowledge that without a well-functioning financial system the broader economy might never have gotten back on its feet. This view is bolstered by recent experiences in Europe and Japan, where the banking systems, and thus the economies, have struggled. Moreover, taxpayers ultimately made money on the bailout, as noted earlier. The Dodd-Frank Act also imposed substantial changes on the financial services industry, increasing the system’s capitalization, increasing regulatory oversight, and mitigating the risk that financial institutions are too big to fail. The government continues to play an outsize role in the residential mortgage market, but that role is steadily diminishing.[27] The Fed has ended QE and, as this is written, appears poised to begin normalizing interest rates.
The economy’s performance since the crisis and recession has fallen short of most expectations. While the Great Recession ended soon after the policy response to the crisis was in full swing, the pace of recovery has been slow. Real GDP growth has averaged only 2.1% per annum over the past six years, well below the 3% average growth experienced since World War II. Job growth has been more encouraging, mainly because productivity growth has nearly stalled, but the economy has begun getting closer to full employment only recently, nearly a decade since it was last there.
However, as we will soon show, it seems perverse to blame the economy’s disappointing recovery on the policy responses. More likely, it was due to the inevitable headwinds created by the economy’s deleveraging in the wake of the financial crisis, adjustments induced by the major reforms to the healthcare and financial system during this period, the premature turn from fiscal stimulus to fiscal austerity--and even the uncertainty created by political brinkmanship over the budget, which led to a government shutdown and a downgrade of U.S. Treasury debt.
The “No Policy Response” scenario
The substantial economic benefits from the wide-ranging policy responses to the crisis and recession are clearest when considering how poorly the economy might have performed if there had been no policy response at all. It probably would have been devastating. The peak-to-trough decline in real GDP, which was barely over 4% in reality, would have been close to 14%, a stunning number, according to the model. Furthermore, the economy would have contracted for more than three years, more than twice as long as the actual contraction (see Table 6 and Appendix Table B1).
| TABLE 6 | ||||||||
|---|---|---|---|---|---|---|---|---|
| Economic Impact of No Policy Response | ||||||||
| 2008 | 2009 | 2010 | 2011 | 2012 | 2013 | 2014 | ||
| Real GDP* | No Policy | 14,757.2 | 13,602.6 | 13,030.0 | 12,919.9 | 13,236.5 | 13,867.2 | 14,827.5 |
| % Change | -0.8 | -7.8 | -4.2 | -0.8 | 2.5 | 4.8 | 6.9 | |
| Real GDP* | Actual | 14,830.4 | 14,418.8 | 14,783.8 | 15,020.6 | 15,354.6 | 15,583.3 | 15,961.7 |
| % Change | -0.3 | -2.8 | 2.5 | 1.6 | 2.2 | 1.5 | 2.4 | |
| Payroll employment** | No Policy | 137.1 | 127.6 | 121.8 | 121.8 | 124.2 | 128.1 | 133.6 |
| % Change | -0.4 | -6.9 | -4.5 | 0.0 | 2.0 | 3.1 | 4.3 | |
| Payroll employment** | Actual | 137.2 | 131.2 | 130.3 | 131.8 | 134.1 | 136.4 | 139.0 |
| % Change | -0.6 | -4.3 | -0.7 | 1.2 | 1.7 | 1.7 | 1.9 | |
| Unemployment rate (%) | No Policy | 5.8 | 11.2 | 15.0 | 15.7 | 14.7 | 12.8 | 9.5 |
| Unemployment rate (%) | Actual | 5.8 | 9.3 | 9.6 | 8.9 | 8.1 | 7.4 | 6.2 |
| CPI*** | No Policy | 215.2 | 211.5 | 206.1 | 206.5 | 208.5 | 211.2 | 215.2 |
| % Change | 3.8 | -1.7 | -2.5 | 0.2 | 1.0 | 1.3 | 1.9 | |
| CPI*** | Actual | 215.3 | 214.6 | 218.1 | 224.9 | 229.6 | 233.0 | 236.7 |
| % Change | 3.8 | -0.3 | 1.6 | 3.1 | 2.1 | 1.5 | 1.6 | |
By the time employment hits bottom in the “No Policy Response” scenario, more than 17 million jobs have been lost, which is about twice the actual number, and unemployment peaks at just under 16% (instead of 10%). Though not determined in the model, it would not be surprising if the underemployment rate, which includes marginally attached workers and part-timers who want full-time jobs, would have exceeded one-fourth of the labor force. This dour scenario is also characterized by deflation, as wages and prices decline through 2011.
Furthermore, the federal budget deficit (not shown in table) surges, peaking at $2.8 trillion, more than 20% of GDP, in fiscal 2011. This, too, is about double the size of the actual deficit—which peaked in fiscal 2009. Thus, even though the policy response was costly to taxpayers, not responding would have been much more costly.[28]
According to the Moody’s Analytics model, had policymakers punted and not responded to the crisis, the economy would have unraveled into a 1930s-like depression. Indeed, to this day the economy would still be far weaker than it actually is. As of the second quarter of 2015, real GDP in the “No Policy Response” scenario is still about $800 billion lower than actual, there are 3.6 million fewer jobs, and the unemployment rate is a still-dizzying 7.6%.
The “No Fiscal Stimulus” scenario
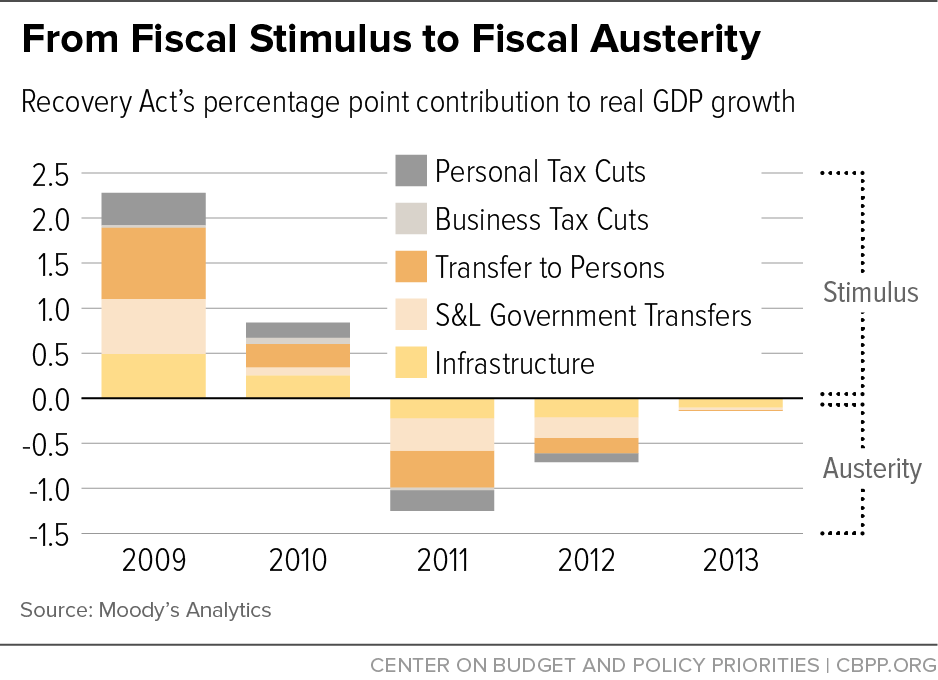
The use of fiscal stimulus measures to combat the recession may have been the most politically contentious of the policy steps taken to combat the recession. But it was critical in stanching the hemorrhaging of the economy and jump-starting the recovery. The Recovery Act (February 2009) included myriad tax and spending provisions. Combined, they added well over 2% to GDP in 2009 and an additional almost 1% by the end of 2010 (see Figure 3). The temporary tax cuts were particularly important in supporting consumer spending in the teeth of the downturn, but the spending, including increased outlays on infrastructure, boosted growth for longer. By 2011, the provisions of the Recovery Act were winding down, which weighed on growth, shaving over a percentage point from real GDP growth. The effects of this large fiscal stimulus package had largely faded away by 2013.
But a string of other, smaller fiscal stimulus packages was to come, and taken together with the Recovery Act, they provided an important economic boost. This can be seen in the scenario in which it is assumed there is no fiscal stimulus, but that policymakers follow through on all the other policy efforts (see Table 7 and Appendix Table B2). The peak-to-trough decline in real GDP in this scenario is almost 6%, and employment declines by almost 11 million jobs.[29] The economy hits bottom in late 2009, and by the time it finally gains traction in spring 2011, the unemployment rate peaks at almost 11%.
| TABLE 7 | ||||||||
|---|---|---|---|---|---|---|---|---|
| Economic Impact of No Fiscal Stimulus | ||||||||
| 2008 | 2009 | 2010 | 2011 | 2012 | 2013 | 2014 | ||
| Real GDP* | No Fiscal Stimulus | 14,784.0 | 14,187.3 | 14,271.3 | 14,536.4 | 14,927.2 | 15,306.0 | 15,851.2 |
| % Change | -0.6 | -4.0 | 0.6 | 1.9 | 2.7 | 2.5 | 3.6 | |
| Real GDP* | Actual | 14,830.4 | 14,418.8 | 14,783.8 | 15,020.6 | 15,354.6 | 15,583.3 | 15,961.7 |
| % Change | -0.3 | -2.8 | 2.5 | 1.6 | 2.2 | 1.5 | 2.4 | |
| Payroll employment** | No Fiscal Stimulus | 137.1 | 130.5 | 127.6 | 129.2 | 131.9 | 134.8 | 138.3 |
| % Change | -0.3 | -4.9 | -2.2 | 1.2 | 2.1 | 2.2 | 2.6 | |
| Payroll employment** | Actual | 137.2 | 131.2 | 130.3 | 131.8 | 134.1 | 136.4 | 139.0 |
| % Change | -0.6 | -4.3 | -0.7 | 1.2 | 1.7 | 1.7 | 1.9 | |
| Unemployment rate (%) | No Fiscal Stimulus | 5.8 | 9.6 | 10.8 | 10.6 | 9.5 | 8.4 | 6.6 |
| Unemployment rate (%) | Actual | 5.8 | 9.3 | 9.6 | 8.9 | 8.1 | 7.4 | 6.2 |
| CPI*** | No Fiscal Stimulus | 215.2 | 213.6 | 214.6 | 219.7 | 223.8 | 227.1 | 231.2 |
| % Change | 3.8 | -0.8 | 0.5 | 2.3 | 1.9 | 1.5 | 1.8 | |
| CPI*** | Actual | 215.3 | 214.6 | 218.1 | 224.9 | 229.6 | 233.0 | 236.7 |
| % Change | 3.8 | -0.3 | 1.6 | 3.1 | 2.1 | 1.5 | 1.6 | |
Without the fiscal stimulus, the federal budget deficit peaks at $1.6 trillion in fiscal 2010, and does not fall below $1 trillion until fiscal 2013. The cumulative difference between the deficits in this scenario and the government’s actual deficits covers about three-fourths of the more than $1.4 trillion taxpayers shelled out to finance the stimulus packages. But the cost seems worth it. Without the stimulus, GDP, jobs and unemployment would have only recently caught up to the economy’s actual performance.
The “No Recovery Act” scenario
The American Recovery and Reinvestment Act was far and away the largest and most controversial of the fiscal stimulus efforts. It was vital to ending the free fall in the economy and jump-starting the economic recovery. The Recovery Act was passed in February 2009, the recession ended in June 2009, and job growth resumed in February 2010.
According to the Moody’s model, the maximum GDP impact from the Recovery Act occurred in 2010, when real GDP was 3.3% higher than if the stimulus had never been implemented (see Table 8 and Appendix Table B3). In terms of jobs, the stimulus added almost 3 million jobs at its apex, and the unemployment rate was reduced by more than 1.5 percentage points.
These results are consistent with those of the Congressional Budget Office in its analysis of the economic impact of the Recovery Act.[30]
| TABLE 8 | |||||||||
|---|---|---|---|---|---|---|---|---|---|
| Estimated Impact of the American Recovery and Reinvestment Act | |||||||||
| Real GDP (%) | Employment (millions) | Unemployment Rate (percentage point) | |||||||
| CBO Low | CBO High | Moody’s | CBO Low | CBO High | Moody’s | CBO Low | CBO High | Moody’s | |
| 2009 | 0.4 | 1.8 | 1.3 | 0.2 | 0.9 | 0.8 | -0.1 | -0.5 | -0.4 |
| 2010 | 0.7 | 4.1 | 3.3 | 0.7 | 3.3 | 2.6 | -0.4 | -1.8 | -1.4 |
| 2011 | 0.4 | 2.3 | 2.0 | 0.5 | 2.6 | 1.7 | -0.2 | -1.4 | -1.1 |
| 2012 | 0.1 | 0.8 | 0.5 | 0.2 | 1.1 | 0.4 | -0.1 | -0.6 | -0.2 |
| 2013 | 0.1 | 0.4 | 0.1 | 0.1 | 0.5 | 0.1 | 0.0 | -0.3 | -0.1 |
| 2014 | 0.0 | 0.2 | 0.0 | 0.1 | 3.0 | 0.0 | 0.0 | -0.2 | 0.0 |
The “No Financial Policy Response” scenario
Re-establishing a stable financial system and healthy credit flows were a necessary condition for economic recovery. The long list of extraordinary policy responses that saved the nation’s financial system—including the Fed’s extraordinary efforts, the FDIC’s guarantee of bank debt, the bank stress tests, and the recapitalization through TARP—was especially important.
In a counterfactual scenario that assumes that policymakers did not take any of the steps they did to shore up the financial system but did follow through on the fiscal policies just analyzed, the economy would have struggled through spring 2011 (see Table 9 and Appendix Table B4). According to the model, GDP would have declined 6.5% from peak to trough, employment would have fallen by more than 12.5 million jobs, and the unemployment rate would have risen to nearly 12.5%.[31] There is also a period of modest deflation in 2010 and very large budget deficits in this scenario.
Perhaps most disconcerting is that, to this day, the economy would still not have recovered what it lost in the recession. As of the second quarter of 2015, real GDP in this scenario is still about $600 billion shy of where it is currently, employment is lower by 3.2 million jobs, and the unemployment rate is 1.9 percentage points higher.
| TABLE 9 | ||||||||
|---|---|---|---|---|---|---|---|---|
| Economic Impact of No Financial Policy Response | ||||||||
| 2008 | 2009 | 2010 | 2011 | 2012 | 2013 | 2014 | ||
| Real GDP* | No Financial Policy | 14,811 | 14,023 | 14,006 | 14,133 | 14,435 | 14,689 | 15,193 |
| % Change | -0.4 | -5.3 | -0.1 | 0.9 | 2.1 | 1.8 | 3.4 | |
| Real GDP* | Actual | 14,830 | 14,419 | 14,784 | 15,021 | 15,355 | 15,583 | 15,962 |
| % Change | -0.3 | -2.8 | 2.5 | 1.6 | 2.2 | 1.5 | 2.4 | |
| Payroll employment** | No Financial Policy | 137.1 | 129.1 | 125.8 | 127.0 | 129.2 | 131.7 | 135.0 |
| % Change | -0.3 | -5.8 | -2.5 | 0.9 | 1.8 | 1.9 | 2.5 | |
| Payroll employment** | Actual | 137.2 | 131.2 | 130.3 | 131.8 | 134.1 | 136.4 | 139.0 |
| % Change | -0.6 | -4.3 | -0.7 | 1.2 | 1.7 | 1.7 | 1.9 | |
| Unemployment rate (%) | No Financial Policy | 5.8 | 10.3 | 12.3 | 11.8 | 10.9 | 10.0 | 8.4 |
| Unemployment rate (%) | Actual | 5.8 | 9.3 | 9.6 | 8.9 | 8.1 | 7.4 | 6.2 |
| CPI*** | No Financial Policy | 215.2 | 213.1 | 211.9 | 215.0 | 217.7 | 220.4 | 224.0 |
| % Change | 3.8 | -1.0 | -0.5 | 1.5 | 1.3 | 1.2 | 1.6 | |
| CPI*** | Actual | 215.3 | 214.6 | 218.1 | 224.9 | 229.6 | 233.0 | 236.7 |
| % Change | 3.8 | -0.3 | 1.6 | 3.1 | 2.1 | 1.5 | 1.6 | |
The “No Quantitative Easing” scenario
Controversy over the Fed’s quantitative easing program has been extraordinarily heated. When the Fed first began QE1 in 2009, there was much hand-wringing over the prospects of runaway inflation due to the surfeit of bank reserves created by the Fed’s bond-buying. However, inflation has remained subdued. Critics then shifted to claiming that QE is fomenting bubbles in various asset markets. Stock and property values may be a bit rich today, in part because of QE. But it is hard to argue that these markets have turned speculative in the sense that investors are flipping stocks and properties and using leverage to finance their buying and selling.
There are also worries that the Fed’s policies are exacerbating the skewing of the distributions of income and wealth as older retirees who hold most of their savings in cash-like instruments have been hit hard by super-low interest rates. Some critics even worry that QE, by holding interest rates down, has let fiscal policymakers off the hook, as they did not need to make the hard budget-shrinking policy choices necessary for solid long-term growth.
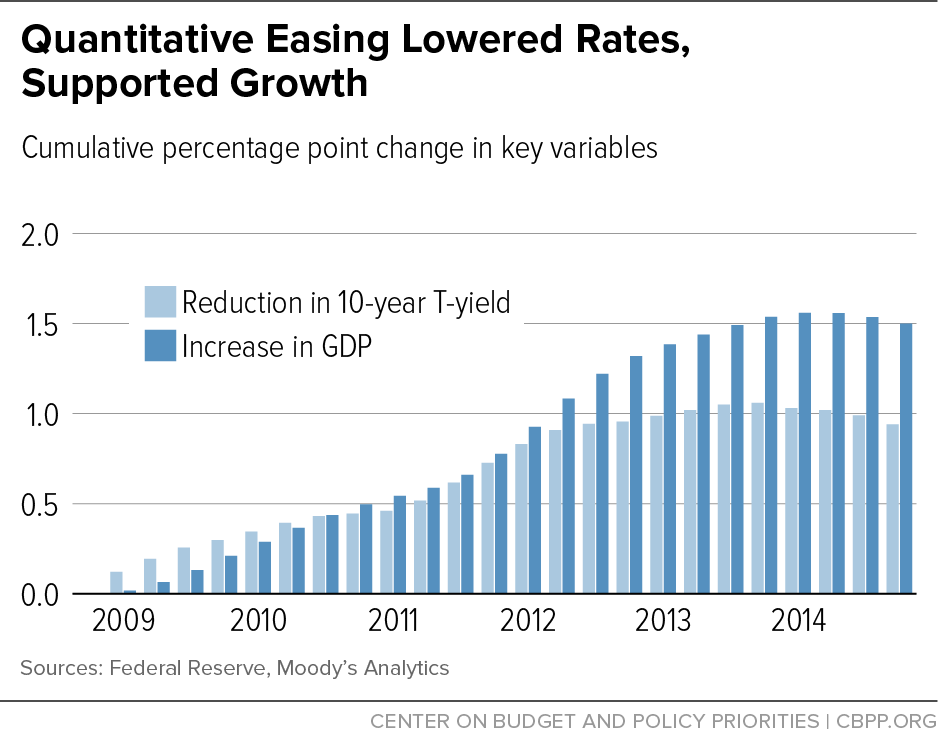
Perhaps. All these objections are taken up in Section 5. But the evidence is strong that QE has done what it was intended to do, namely to lower long-term interest rates. This is captured in the macro model as follows: QE purchases push down the yield on 10-year Treasury bonds via the increase in the Fed’s balance sheet (see Appendix Table A5). Every 1-percentage point increase in the ratio of Fed assets to GDP ultimately reduces the 10-year Treasury yield by close to 5 basis points in the model. Doing the arithmetic, this implies the Fed’s QE program has reduced long-term Treasury yields by more than a percentage point.[32],[33]
The lower long-term interest rates resulting from QE support stronger economic growth in the macro model via their impact on stock prices and housing values and the wealth effects on consumer spending. Lower long-term rates also lift business investment through a lower cost of capital, and support a better trade balance as the lower rates push down the value of the dollar.
In total, QE has increased the level of real GDP by approximately 1.5% as of the first quarter of 2015, according to the model (see Figure 4). Although the script on QE’s success or failure is still being written, and it is unclear how graceful the normalization of the Fed’s balance sheet will be, so far at least, it appears to be a significant success.
The “No Bank Bailout” scenario
As for most of the policy responses to the financial crisis there is significant disagreement about the efficacy of the bank bailout. But without the bank stress tests and the TARP bailout funds, the nation’s banking system likely would have remained undercapitalized, if not comatose, for much longer, impeding lending and economic growth. To what extent? To estimate that, the macro model was simulated under the scenario that the banks were not stress-tested and did not get capital injections from TARP.
With inadequate capital, banks respond by tightening their underwriting standards and raising their loan rates in an effort to shed risky assets. Commercial and industrial lending to businesses is hit especially hard, with outstandings cut nearly in half at their nadir in 2011 (see Figure 5). Commercial real estate and consumer lending is also much weaker. Residential mortgage lending is impacted less, owing to the effective nationalization of mortgage lending when Fannie Mae and Freddie Mac were placed into conservatorship.
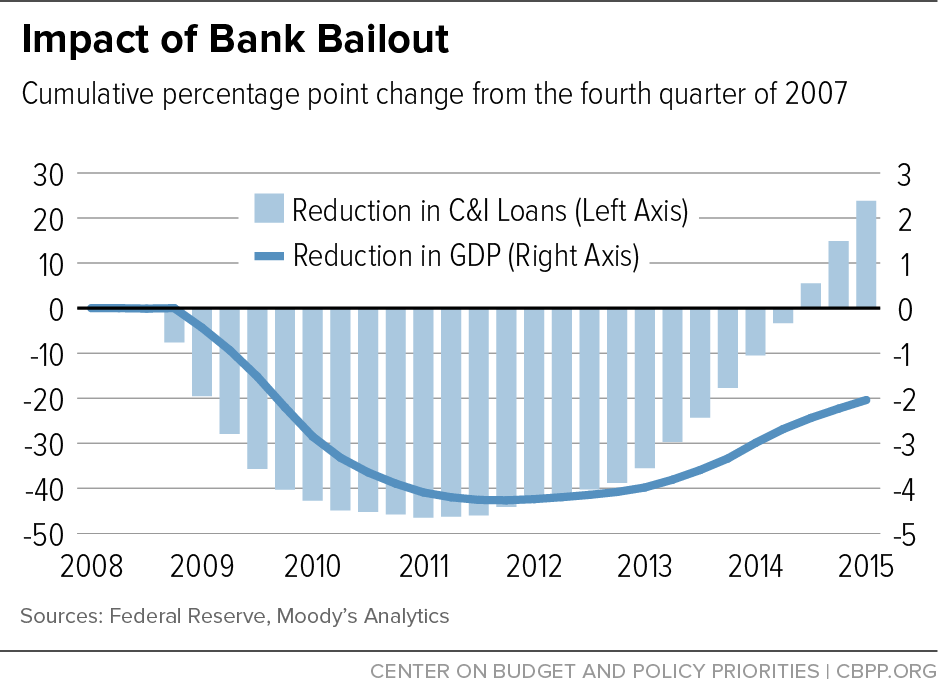
The fallout on the real economy is substantial (see Figure 5, Table 10, and Appendix Table B5). Credit is the mother’s milk of economic activity. As illustrated by Europe, where the banking system was only recently adequately stress-tested and recapitalized, an economy will struggle to grow without well-functioning banks to extend credit. In the model, real GDP is lower by close to 4% at the bottom in 2011.
| TABLE 10 | ||||||||
|---|---|---|---|---|---|---|---|---|
| Economic Impact of No Bank Bailout | ||||||||
| 2008 | 2009 | 2010 | 2011 | 2012 | 2013 | 2014 | ||
| Real GDP* | No Bank Bailout | 14,830 | 14,237 | 14,293 | 14,414 | 14,740 | 15,030 | 15,559 |
| % change | -0.3 | -4.0 | 0.4 | 0.8 | 2.3 | 2.0 | 3.5 | |
| Real GDP* | Actual | 14,830 | 14,419 | 14,784 | 15,021 | 15,355 | 15,583 | 15,962 |
| % change | -0.3 | -2.8 | 2.5 | 1.6 | 2.2 | 1.5 | 2.4 | |
| Payroll employment** | No Bank Bailout | 137.2 | 130.2 | 127.5 | 128.5 | 130.8 | 133.5 | 136.9 |
| % change | -0.3 | -5.1 | -2.1 | 0.8 | 1.8 | 2.1 | 2.6 | |
| Payroll employment** | Actual | 137.2 | 131.2 | 130.3 | 131.8 | 134.1 | 136.4 | 139.0 |
| % change | -0.6 | -4.3 | -0.7 | 1.2 | 1.7 | 1.7 | 1.9 | |
| Unemployment rate (%) | No Bank Bailout | 5.8 | 9.9 | 11.5 | 11.1 | 10.2 | 9.2 | 7.5 |
| Unemployment rate (%) | Actual | 5.8 | 9.3 | 9.6 | 8.9 | 8.1 | 7.4 | 6.2 |
| CPI*** | No Bank Bailout | 215.3 | 213.7 | 212.8 | 216.2 | 218.8 | 221.3 | 224.8 |
| % change | 3.8 | -0.7 | -0.4 | 1.6 | 1.2 | 1.2 | 1.6 | |
| CPI*** | Actual | 215.3 | 214.6 | 218.1 | 224.9 | 229.6 | 233.0 | 236.7 |
| % change | 3.8 | -0.3 | 1.6 | 3.1 | 2.1 | 1.5 | 1.6 | |
The “No Auto Bailout” scenario
Policymakers agonized over their decision to provide financial aid to the reeling auto industry in late 2008. No one wanted to use taxpayer dollars to shore up the industry. But the fear was that, without any government help, the Big Three would quickly end up in a Chapter 7 liquidation rather than a Chapter 11 restructuring. Given the collapse in the financial system and resulting credit crunch, debtor in possession financing would be extremely difficult to get from private sources. So their factories and other operations might shut down, resulting in hundreds of thousands of layoffs at just the wrong time.
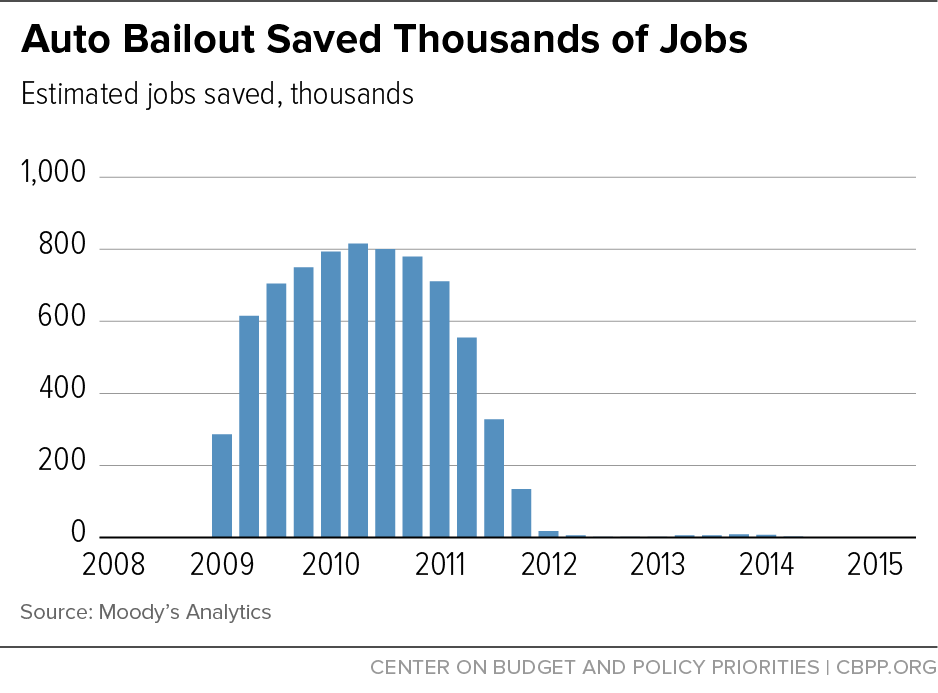
Neither the Bush nor Obama administration wanted to take that chance in a sliding economy. The Big Three employed fewer than 250,000 people in the U.S., but given their broad links into the rest of the economy, hundreds of thousands of other jobs would have been at risk immediately. Indeed, according to the Moody’s model, not providing help to the industry would have cost the economy 800,000 jobs at the peak of its impact in mid-2010 (see Figure 6).[34]
Section 4: Some criticisms of the policy interventions
We have just argued that the dramatic policy interventions pursued by the Federal Reserve, the Treasury, and Congress in 2008-2009 had large, and largely salutary, effects on the U.S. economy: ending the financial panic, mitigating the recession, and hastening the recovery. But, to put it mildly, not everyone agrees with that assessment, not to mention with our specific numerical estimates. And in fairness, we have focused on the impacts of the anti-recession policies on macro variables such as GDP and employment, thereby estimating the benefits of the extraordinary policies but not fully considering their potential costs.
What are some of these costs? Critics have focused on a list of issues that we take up in turn, albeit briefly.
Many of the emergency rescue operations created moral hazard problems that will plague us in the future.
There can be no doubt that several of the emergency actions taken by the Fed and the Treasury created or exacerbated moral hazard. Critics worry that this may prove problematic in the future when the precedents set in 2008-2009 either lead to excessive risk-taking, followed perhaps by more financial instability, or are violated, possibly recreating the sort of market chaos that occurred when the Bear Stearns precedent was not followed in the Lehman case. These are valid concerns. But we view it as a potentially catastrophic mistake to accept the argument “it creates moral hazard” as a show stopper. Rather, we think policymakers should conceptualize bailout decisions as trade-offs: trading the costs of potential moral hazard in the future against a potential catastrophe in the present.
Moral hazard costs are conjectural, difficult to quantify, and often distant in time, whereas the macroeconomic benefits from a stronger economy are clear, quantifiable (we have argued), and immediate. Critics point out that this contrast may skew decision-making in real time toward too many bailouts. So it seems important, after the acute stage of the crisis has passed, to install new policies that limit the potential for subsequent opportunistic behavior. That was one of the guiding principles of the Dodd-Frank Act, especially in its “orderly liquidation authority” and “no taxpayer-funded bailout” provisions.
Will it work? Only time will tell. But one way to make an educated guess about whether moral hazard is better or worse today than, say, before the series of financial institution rescues in 2008 is to study the behavior of credit default swap spreads for large too-big-to-fail financial institutions. Narrower spreads imply a lower market assessment of risk, some of which may stem from investors’ beliefs that the government will bail out giant financial institutions if necessary—thus implying greater moral hazard (see Figure 7). Prior to the crisis, between 2004 and 2007, CDS spreads for these institutions averaged close to 20 basis points. This compares to a spread of over 60 basis points more recently. While many factors can impact CDS spreads, including the liquidity of trading in these derivatives, this increase in spreads is large and suggestive that investors believe that the government is no longer backing these institutions as strongly as it did pre-crisis.
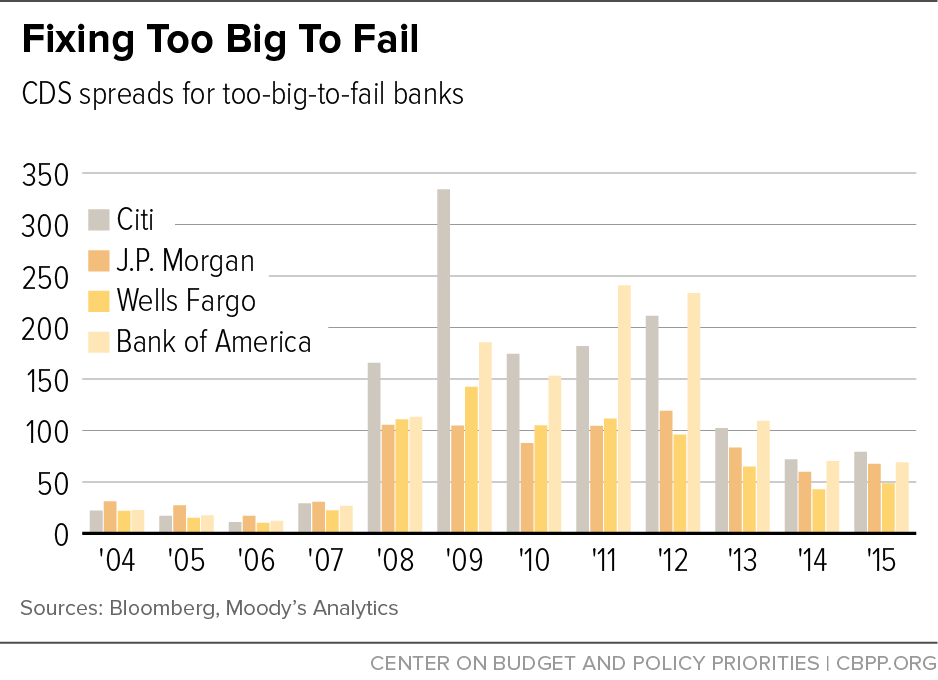
The spending parts of the 2009 fiscal stimulus unduly expanded the size of the federal government, were wasteful, and probably killed more jobs than they created.
Fiscal stimulus measures did fuel a surge in federal government spending during the recession and the early part of the economic recovery. But this was temporary—by design. The central idea behind fiscal stimulus is to lift government spending temporarily in bad economic times, and then, once the economy is back on its feet, to end the additional spending. That is precisely what happened during and after the Great Recession. Whether you measure federal spending in real or nominal terms or as a share of GDP, it peaked in the first quarter of 2010. Government spending remains low as a share of GDP and is about where it was during the Reagan presidency (see Figure 8).
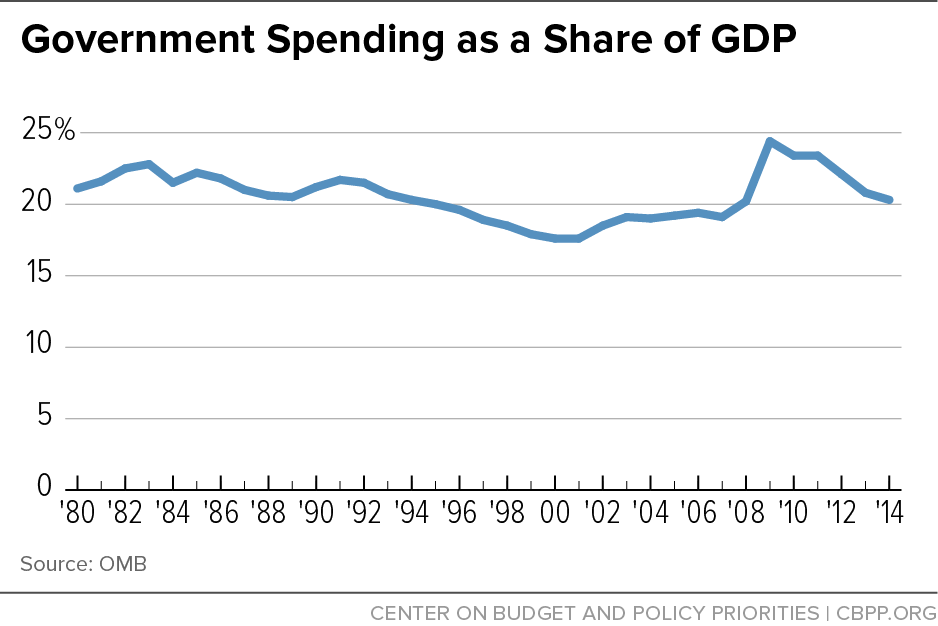
Regarding waste, it is hard to imagine a package of more than $800 billion worth of federal spending, tax cuts, and grants to states and localities that does not include at least some waste, fraud and abuse. But the spending components of the Recovery Act appear to have had amazingly little of that, perhaps in part because of monitoring by the Recovery Act Transparency and Accountability Board.
It may be legitimate to argue that any particular government spending program is wasteful and inefficient, reflects the wrong priorities, or even usurps functions best left to the private sector. But it is difficult to imagine how more government spending could actually “kill” jobs.[35] After all, when it purchases goods and services, the federal government is either hiring people to work for it directly or buying products from private companies, who then probably hire more workers. How can either kill jobs? In the Moody’s model, of course, as in other Keynesian macro models, that does not happen.
Some critics have argued that the conclusion that the stimulus created lots of jobs is built into the structure of these models. For example, the estimates in our 2010 paper could have been made before the stimulus was enacted; they do not depend on what actually happened in 2009-2012.[36] That is true, and one way to address this criticism is to look ex post at a variety of studies of particular pieces of the stimulus that ask whether they really stimulated spending or employment. Since our 2010 paper was published, a number of papers have done precisely that.
One of the first was by James Feyrer and Bruce Sacerdote (2011), who assessed the effectiveness of the 2009 stimulus spending by comparing what actually happened on the ground in states that received different amounts of ARRA money. In making such geography-based assessments, it is important to deal with reverse causation. For example, states hit harder by the recession received more stimulus money than states that fared comparatively well. Failing to account for that econometrically would bias the estimated effects of the stimulus downward. Feyrer and Sacerdote (2011) use instrumental variables to do that, and find that the job impact of fiscal stimulus measures depends on the type of stimulus. Specifically, they estimate that federal education grants to states created hardly any jobs. But excluding those, the rest of the stimulus created jobs at approximately the rate that macro models suggest.
A paper by Daniel Wilson (2012), who focused on Medicaid grants (which were deliberately made fungible by the federal government) and highway funds across states, found broadly similar results, as did Gabriel Chodorow-Reich et al. (2011).
A paper by Timothy Conley and Bill Dupor (2013) is the main exception to the finding that cross-sectional studies based on actual data give roughly the same assessment of the stimulus’ effects as simulations of macro models. They find strong positive effects of ARRA spending on public-sector employment but small or even negative effects on private-sector employment. Han Tran (2015), who obtains starkly different results, speculates that one reason may be that, unlike most other studies of stimulus spending, Conley and Dupor (2013) scale ARRA spending by state government spending (which was directly affected by the ARRA) instead of by state population or state GDP. Christina Romer (2011) suggests that Conley and Dupor (2013) may have a weak instruments problem.
The large fiscal stimulus increased the federal budget deficit, which left the country with a higher debt-to-GDP ratio, spelling future problems.
It is certainly true that the Recovery Act (and many of the other policy interventions) contributed to larger federal budget deficits, which increased from $459 billion in fiscal 2008 to a stunning $1.413 trillion in fiscal 2009. These bigger deficits did add to the nation’s public debt, and the debt-to-GDP ratio nearly doubled.
But the imploding economy raised the nation’s deficits and debt load even more,[37] and the effect of the weak economy on the fiscal situation would have been far larger without the policy interventions. Thus, while the policy interventions cost taxpayers a bundle, it would have cost them even more if policymakers did nothing and allowed the economy to descend into depression.
Furthermore, we agree with the majority of economists who think the cost-benefit calculus of running larger versus smaller deficits shifts dramatically in favor of deficits when the economy is depressed. So we consider the larger deficits of, say, 2009-2013 as a plus rather than a minus.
The government’s response to the crisis was unfair. It bailed out the big banks and the automakers, but it did not help homeowners much, and millions lost their homes in foreclosure.
Many have criticized the policy response for being unfair. It was argued that the U.S. government engaged in crony capitalism, favoring some groups over others for political reasons. The Bush administration was chastised for helping Goldman Sachs, where Treasury Secretary Henry Paulson had been the CEO. The Obama administration was hammered over the GM and Chrysler bailouts, which were said to favor labor unions over bondholders in those companies.
We sympathize with some of these critiques, especially the complaints that (a) more could and should have been done to limit foreclosures and (b) taxpayers could have been given more of the upside from the financial bailouts. But there are always winners and losers when policies change, and in this case the winners far outnumbered the losers. Would other Americans have been better off if the government had refused to save the (greedy and irresponsible) banks and the (incompetent) auto companies? We are pretty sure the answer is no. The policy responses were designed to get the biggest—and quickest—economic bang for the buck, not to promote distributional equity.
The Federal Reserve stretched its powers beyond the legal breaking point, in some cases poaching into the realm of fiscal policy.
While some of its actions were unprecedented, there can be little doubt that the Fed acted within its statutory authority. After all, before the Federal Reserve Act was amended by Dodd-Frank, the pliable Section 13(3) permitted the Board of Governors to extend credit to “any individual, partnership, or corporation” under “unusual and exigent circumstances” as long as borrowers posted good collateral for their loans. The circumstances of 2008-2009 were certainly “unusual and exigent,” and every recipient of Federal Reserve credit was an “individual, partnership, or corporation.” The collateral also appears to have been decent and, in any case, the law designated the Fed itself as the sole judge of that.[38] So legality is not a serious issue.
However, the Fed did put taxpayer money at risk each time it invested in (or loaned against, especially when the loans were without recourse) risky assets. And those can legitimately be considered quasi-fiscal operations. (In principle, they had scorable actuarial costs.) We agree that, in normal circumstances, the Fed should refrain from “spending” taxpayer money, even actuarially. But the circumstances of 2008-2009 were far from normal.
Congress, apparently, did not agree. When it wrote Dodd-Frank, it decided to constrain the Fed’s emergency lending powers in the future. We think that was a mistake, by the way, which leaves the fire brigade less well-equipped to fight the next conflagration. (More on this in Section 6.)
The Federal Reserve sacrificed its independence by bending to the will of the administration and Congress.
We have heard this criticism but, frankly, do not understand the basis for it. Allan Meltzer (2009, p. 13), for example, has claimed that “Chairman Ben Bernanke ... worked closely with the Treasury and yielded to pressures from the chairs of the House and Senate Banking Committee and others in Congress.” Bernanke certainly did work closely with Treasury Secretaries Henry Paulson and Timothy Geithner to extinguish the raging financial fires in 2008 and 2009; we hate to imagine what might have happened if he had not. But we do not see that as sacrificing the central bank’s independence, and we do not see what congressional “pressures” Bernanke bowed to. Perhaps most fundamentally, we do not see the Fed as less independent today than it was in, say, 2007. Were that true, you might expect to see, for example, that long-term inflationary expectations became unhinged. They did not (see Figure 9).
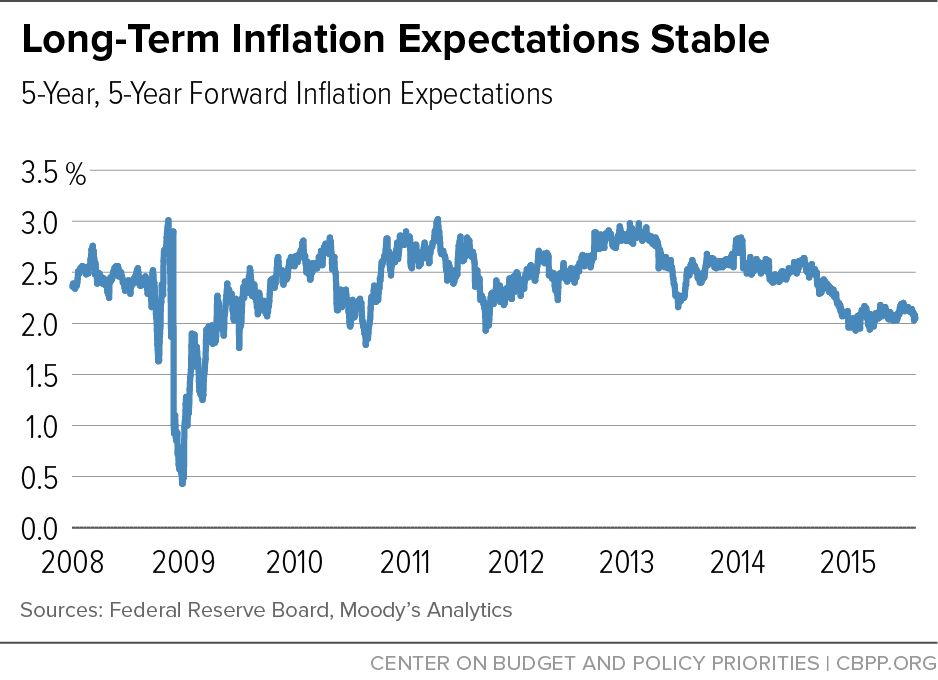
The Fed’s hyper-expansionary monetary policies—in particular the creation of trillions of dollars of excess bank reserves—will eventually prove inflationary.
The future will have to speak for itself. But we know this much already: When the Fed announced the beginnings of what came to be called QE1 in November 2008, the 12-month trailing core CPI inflation rate was 2%. As of this writing, more than 6½ years later, it is 1.8%; and it has been flat as a board since August 2012, never rising above 2% nor falling below 1.6%. The inflation Cassandras, while consistently wrong for years, have never stopped issuing false alarms. They do not seem to recognize either (a) that excess reserves sitting idly in banks’ accounts at the Fed do not create monetary or credit expansions, or (b) that bank reserves are basically like T-bills now that the Fed pays interest on reserves—and no one ever claimed that bank holdings of T-bills are inflationary. Finally, as just noted, market expectations do not agree with the inflation Cassandras.
Maintaining the near-zero interest rate policy, or ZIRP, for so long and engaging in massive quantitative easing risks creating bubbles and undermining financial stability.
Could be. The “bubble” criticism is hard to deal with because most bubbles are identifiable only after they burst—and there has been no such bursting to date. But bubbles are generally characterized by speculation, wherein investors purchase an asset simply because they think they can sell it quickly to another investor for a higher price. Such behavior is not much in evidence in asset markets today. We may someday look back at 2015’s record stock market—which is almost certainly higher because of the Federal Reserve’s actions—and declare that it was bubbly. We do not know that today, however, and the S&P 500 has been more or less flat since the beginning of 2015. Nor have any of the other scare stories of financial instability stemming from ZIRP or QE come true. Time will tell.
ZIRP and QE have created a massive “exit” problem for the Fed, which is likely to go badly.
Two things almost certainly are true: The Fed will eventually shrink its balance sheet (which is now about $4.5 trillion) quite a lot, and the Fed will eventually push the funds rate much higher than it is today (0 to 25 basis points). Those adjustments, which are expected to start within months, are the essence of what is commonly called the Fed’s “exit strategy,” and the Fed has been talking about and planning for exit for years (actually, since 2009!).
Nonetheless, a number of observers fear that the job will overwhelm the Fed in practice. Specifically, it is often claimed that the Fed’s reluctance to move fast enough will leave us with higher inflation in the end. We think exit, while a big job and unlikely to be executed perfectly, is not as difficult as is frequently portrayed—especially since the Fed can speed it up, slow it down, or otherwise modify the exit process as often as it wishes. No one can see the future; we will all have to wait. But we do know that inflationary expectations over the next decade remain low (see again Figure 9).
ZIRP and QE constitute financial repression that forces savers to struggle with extraordinarily low interest rates. It is the wealthy classes—the owners of stocks, bonds and real estate—who have benefited the most.
Ordinary savers, with their assets in CDs and other safe instruments, have indeed suffered from the low interest rate environment. But the number of people living off interest is very small. Most savers have other assets—such as stocks, bonds and real estate—that have benefited substantially from the Fed’s efforts that have supported asset prices by keeping interest rates low. Furthermore, QE probably reduced income inequality by giving the recovery a boost. In total, any inegalitarian redistribution from QE seems to have been modest.[39]
The Fed’s aggressive actions have taken fiscal policymakers off the hook, enabling them to avoid (or at least postpone) the hard fiscal decisions that would put the nation on a sound long-term fiscal path.
Perhaps. But the Fed had to work harder to support the economy once fiscal policymakers decided to push in the opposite direction. Moreover, while political counterfactuals can always be questioned, it seems a stretch to argue that Congress and the administration would have found it easier to work together if the Fed had not supported the flagging economy. Rather, fiscal policymakers might have bickered even more as the weaker economy fostered more political dissension. In our view, the economy would be in a far worse place today if the Fed had left more things up to the politicians.
In short, while there is some basis for some of these criticisms, we do not find any of them compelling. And we certainly do not believe that any of them—nor even the entire list—makes a plausible case that policy passivity would have been wiser in 2008-2009 than the policy activism pursued by U.S. policymakers.
Section 5: The past as prologue: Lessons for “next time”
Only a few years have passed since the financial crisis and Great Recession, and more perspective may be necessary before we can claim to understand fully the lessons from that cataclysmic period. But some already seem clear.
In the spirit of addressing potential moral hazards before, as opposed to during, the crisis, policymakers should employ macroprudential tools to avoid or minimize asset bubbles and the increased leverage that are the fodder for financial catastrophes. Doing so includes requiring more capital and liquidity in the financial system, stress-testing financial institutions, and strengthening regulatory vigilance, particularly over large institutions and rapidly growing parts of the system. Yes, it is notoriously difficult to identify bubbles before they burst, but the old banking adage that “if it is growing like a weed, it is probably a weed” will help policymakers know where to look.
Nonetheless, despite policymakers’ best efforts, there will be financial crises in the future. That is not all bad. Crises are an inherent part of our financial system; without them it is likely that the risk-taking necessary for strong long-term economic growth would be stymied. But when the good times roll, investors find it difficult to avoid getting caught up in the euphoria, to take on too much risk, and to saddle themselves with too much debt.
When financial panics do come, regulators should take care to be as consistent as possible. They should, for example, avoid the starkly different treatments of Bear Stearns and Lehman Brothers in 2008. The consistent resolution of troubled financial institutions is vital to ensure that creditors in the financial system know where their investments stand and thus do not run to dump them when the good times give way to the bad.
The line is subtle here: Policymakers should not respond to every financial event; after all, asset prices go up and down all the time. But they should respond aggressively to potential crises, wherein liquidity dries up throughout the financial system, threatening to take down many institutions and ultimately the entire financial system. Of course, making such a distinction in the fog of real time is difficult. But the greater the uncertainty, the more policymakers should err on the side of a bigger and more open response. That TARP was so big—at the time an unfathomable $700 billion—was a key to its success. Creditors had no doubt that the government was backstopping the financial system.
Furthermore, it seems to us that the first step in fighting a crisis is to stabilize the financial system. Without credit, the real economy will suffocate regardless of almost any other policy response. The Federal Reserve must ensure that there is substantial liquidity (as Walter Bagehot understood in the 19th century) and, if necessary, steps should be taken either to ensure or restore the solvency of systemically important institutions or to resolve them in an orderly way.[40] In this regard, we believe it is a mistake to limit the Fed’s ability to provide emergency loans under Section 13(3) of the Federal Reserve Act, as Dodd-Frank has done.
Conventional monetary policy—that is, lowering the overnight interest rate—may be insufficient to forestall or cure a severe recession. This realization can lead policymakers in one of two directions—or both, if the recession is severe enough or happens suddenly. One direction is to supplement conventional monetary policy with unconventional monetary policies, such as QE, especially once short-term nominal interest rates approach zero.[41] While QE has potential downsides, critics need to learn that massive infusions of bank reserves are not inflationary if they just pile up willingly as excess reserves on banks’ balance sheets.
The other direction is to deploy fiscal policy instruments such as tax cuts and government spending. Here critics need to remember that the effects of a temporary fiscal stimulus on budget deficits are temporary.[42]
Discretionary fiscal policy is an effective way to support an economy suffering a lengthy and severe downturn. Fiscal stimulus measures have been part of the standard policy playbook for combating recessions since the Great Depression. The size of the stimulus should be proportionate to the magnitude of the expected decline in economic activity. The specific tax and spending policies included as part of the stimulus should be based in large part on their efficacy or bang for the buck. But the policy steps taken may have to be more varied, or even experimental, when the downturn is anticipated to be deep. Tax breaks and transfers to persons, such as more food stamps and unemployment insurance, will generally help the economy quickly, but their benefits will fade quickly, too. Infrastructure and other spending will take longer to implement, but that could be a plus in a longer recession.
Fiscal policy should not swing from stimulus to austerity until it is clear that the financial system is stable and the economy is enjoying self-sustaining growth. A good rule of thumb is that the estimated unemployment gap—the difference between actual unemployment and the full-employment unemployment rate as a percent of the labor force—be clearly less than 1 percentage point and declining before the stimulus is withdrawn. Until the labor market is clearly approaching full employment, confidence and thus the economic recovery will remain fragile and vulnerable to almost anything that goes wrong. Policymakers may need to put other policies—for example, deficit reduction or entitlement reform—on hold until a self-sustaining expansion is under way.
Fiscal and monetary policy interactions are large, that is, fiscal stimulus measures enhance the power of monetary/financial stimulus measures substantially—and vice versa.[43] So there is a strong argument for using a “two-handed” (monetary and fiscal) policy approach to fighting recessions. Indeed, it may even be possible to select specific monetary and fiscal tools with an eye to those that reinforce each other. The new homebuyers’ tax credit, for example, enhanced the effectiveness of the Fed’s purchases of mortgage securities in reducing mortgage rates, and vice versa.
Bailouts of companies—whether financial or not—should be avoided if at all possible. If they are unavoidable, shareholders should take whatever losses the market doles out and creditors should be heavily penalized to minimize moral hazard. To the maximum extent possible, such rules should be specified in advance. Furthermore, taxpayers should ultimately be made financially whole. Better communication with the public should be considered an integral part of any bailout operation. Bailouts will never be popular, but policymakers should expend every effort to make them less politically poisonous.
Increasing moral hazard should always be considered a cost of any rescue program, but it should not be a show stopper. There have been in the past, and we suspect there will be in the future, instances in which some sort of “bailout” or rescue operation passes a cost-benefit test even though it exacerbates moral hazard. Decisions must be made case by case.
Policymakers clearly made mistakes in the lead-up to the financial crisis and Great Recession. They failed to use macroprudential policy to weigh against the housing and bond bubbles, and they botched the resolution process of failing financial institutions. But they got the policy response to the crisis mostly right. Not every monetary, financial and fiscal policy step was effective, and the policymaking process was at times messy and counterproductive. But taken in its totality, the policy response was a huge success. Without it, we might have experienced Great Depression 2.0.
The economic expansion is more than six years old, longer than most expansions, and we are getting closer to full employment. It has been a long time coming, but it would have taken much longer without the massive and unprecedented response of policymakers.
Appendix A
| TABLE A1 | |||
|---|---|---|---|
| What Explains the Federal Funds Rate? | |||
| Dependent variable: Federal Funds Rate Method: Least squares Sample: 1979Q1 to 2014Q4 144 observations |
|||
| Variable | Coefficient | Standard Error | t-statistic |
| Federal funds rate lagged 1 qtr | 0.752 | 0.045 | 16.89 |
| Nominal potential GDP growth | 0.258 | 0.053 | 4.91 |
| Difference between actual and natural unemployment rate | -0.203 | 0.054 | -3.73 |
| Difference between core PCE inflation and Fed's target | 0.429 | 0.084 | 5.08 |
| VIX index, 2-qtr moving avg | -0.269 | 0.172 | -1.56 |
| R-squared | 0.959 | ||
| Durbin-Watson | 1.673 | ||
| TABLE A2 | |||
|---|---|---|---|
| What Explains the Tier 1 Capital Ratio? | |||
| Dependent variable: Ratio of Tier 1 capital to risk-weighted assets Method: Least squares Sample: 2000Q1 to 2014Q4 57 observations |
|||
| Variable | Coefficient | Standard Error | t-statistic |
| Constant | 8.095 | 0.386 | 20.93 |
| Net charge-off rate, 8-qtr moving avg | -2.79 | 0.85 | -3.29 |
| Return on assets | 1.44 | 0.31 | 4.64 |
| Dodd-Frank regulatory reform dummy | 2.67 | 0.196 | 13.59 |
| R-squared | 0.86 | ||
| Durbin-Watson | 0.774 | ||
| TABLE A3 | |||
|---|---|---|---|
| What Explains One-Month Libor? | |||
| Dependent variable: 1-mo Libor Method: Least squares Sample: 1987Q2 to 2015Q1 112 observations |
|||
| Variable | Coefficient | Standard Error | t-statistic |
| Constant | -0.072 | 0.386 | 20.93 |
| Federal funds rate | 0.996 | 0.85 | -3.29 |
| VIX | 0.266 | 0.31 | 4.64 |
| Fed/FDIC crisis liquidity provisions | -0.035 | 0.012 | -3.02 |
| Lagged 1-mo Libor | 0.529 | 0.097 | 5.46 |
| R-squared | 0.997 | ||
| Durbin-Watson | 2.19 | ||
| TABLE A4 | |||
|---|---|---|---|
| What Explains the S&P 500 VIX? | |||
| Dependent variable: S&P 500 VIX Method: Least squares Sample: 1978Q1 to 2014Q4 144 observations |
|||
| Variable | Coefficient | Standard Error | t-statistic |
| Constant | 2.495 | 1.035 | 2.411 |
| Capacity utilization | -0.022 | 0.013 | -1.738 |
| Consumer confidence | -0.012 | 0.004 | -3.259 |
| S&P 500 price-earnings ratio | 0.010 | 0.003 | 3.234 |
| Commercial bank Tier 1 capital ratio | -0.254 | 0.061 | -4.131 |
| Systemic risk in the financial system | 0.355 | 0.139 | 2.550 |
| R-squared | 0.382 | ||
| Durbin-Watson | 1.769 | ||
| TABLE A5 | |||
|---|---|---|---|
| What Explains the 10-Year Treasury Yield? | |||
| Dependent variable: 10-yr Treasury bond yield Method: Least squares Sample: 1979Q1 to 2014Q4 144 observations |
|||
| Variable | Coefficient | Standard Error | t-statistic |
| 10-yr Treasury yield lagged 1 quarter | 0.821 | 0.030 | 27.01 |
| Federal funds rate | 0.159 | 0.025 | 6.23 |
| VIX | -0.089 | 0.077 | -1.16 |
| Ratio federal debt to GDP, 2-qtr moving avg | 0.010 | 0.003 | 3.10 |
| Ratio federal assets to GDP, 4-qtr moving avg | -0.010 | 0.008 | -1.02 |
| R-squared | 0.976 | ||
| Durbin-Watson | 1.515 | ||
Appendix B
| TABLE B1 | |||||||||
|---|---|---|---|---|---|---|---|---|---|
| Economic Impact of No Policy Response | |||||||||
| 2008 Q1 | 2008 Q2 | 2008 Q3 | 2008 Q4 | 2009 Q1 | 2009 Q2 | 2009 Q3 | 2009 Q4 | ||
| Real GDP* | No Policy | 14,890 | 14,907.7 | 14,809.8 | 14,421.6 | 14,021.3 | 13,698.0 | 13,442.3 | 13,248.9 |
| Annualized % change | -2.7 | 0.5 | -2.6 | -10.1 | -10.7 | -8.9 | -7.3 | -5.6 | |
| Real GDP* | Actual | 14,890 | 14,963 | 14,892 | 14,577 | 14,375 | 14,356 | 14,403 | 14,542 |
| Annualized % change | -2.7 | 2.0 | -1.9 | -8.2 | -5.4 | -0.5 | 1.3 | 3.9 | |
| Payroll employment** | No Policy | 138.3 | 137.8 | 137.0 | 135.1 | 131.9 | 128.4 | 126.0 | 124.0 |
| Annualized % change | 0.1 | -1.5 | -2.1 | -5.5 | -9.2 | -10.2 | -7.4 | -6.2 | |
| Payroll employment** | Actual | 138.28 | 137.81 | 137.1 | 135.49 | 133.23 | 131.37 | 130.4 | 129.88 |
| Annualized % change | 0.1 | -1.4 | -2.0 | -4.6 | -6.5 | -5.5 | -2.9 | -1.6 | |
| Unemployment rate (%) | No Policy | 5.0 | 5.3 | 6.0 | 7.0 | 8.8 | 10.6 | 12.1 | 13.4 |
| Unemployment rate (%) | Actual | 5.0 | 5.3 | 6.0 | 6.9 | 8.3 | 9.3 | 9.6 | 9.9 |
| CPI*** | No Policy | 212.8 | 215.5 | 218.8 | 213.7 | 212.1 | 212.8 | 211.3 | 209.7 |
| Annualized % change | 4.4 | 5.3 | 6.3 | -9.0 | -3.1 | 1.3 | -2.7 | -3.1 | |
| CPI*** | Actual | 212.8 | 215.5 | 218.9 | 213.9 | 212.4 | 213.5 | 215.3 | 217.0 |
| Annualized % change | 4.4 | 5.3 | 6.3 | -8.9 | -2.7 | 2.1 | 3.5 | 3.2 | |
| 2010 Q1 | 2010 Q2 | 2010 Q3 | 2010 Q4 | 2011 Q1 | 2011 Q2 | 2011 Q3 | ||
|---|---|---|---|---|---|---|---|---|
| Real GDP* | No Policy | 13,092.5 | 13,045.8 | 13,004.2 | 12,977.7 | 12,849.0 | 12,893.4 | 12,903.7 |
| Annualized % change | -4.6 | -1.4 | -1.3 | -0.8 | -3.9 | 1.4 | 0.3 | |
| Real GDP* | Actual | 14,605 | 14,746 | 14,846 | 14,939 | 14,881 | 14,990 | 15,021 |
| Annualized % change | 1.7 | 3.9 | 2.7 | 2.5 | -1.5 | 2.9 | 0.8 | |
| Payroll employment** | No Policy | 122.6 | 122.2 | 121.3 | 121.2 | 121.1 | 121.5 | 122.0 |
| Annualized % change | -4.5 | -1.3 | -2.9 | -0.4 | -0.1 | 1.3 | 1.5 | |
| Payroll employment** | Actual | 129.73 | 130.36 | 130.34 | 130.65 | 131.01 | 131.65 | 132.08 |
| Annualized % change | -0.5 | 2.0 | -0.1 | 1.0 | 1.1 | 2.0 | 1.3 | |
| Unemployment rate (%) | No Policy | 14.1 | 14.9 | 15.4 | 15.8 | 15.7 | 15.7 | 15.8 |
| Unemployment rate (%) | Actual | 9.8 | 9.6 | 9.5 | 9.5 | 9.1 | 9.1 | 9.0 |
| CPI*** | No Policy | 207.8 | 206.5 | 205.0 | 205.1 | 205.3 | 206.5 | 207.0 |
| Annualized % change | -3.4 | -2.5 | -2.9 | 0.2 | 0.4 | 2.4 | 1.0 | |
| CPI*** | Actual | 217.4 | 217.3 | 217.9 | 219.7 | 222.0 | 224.6 | 226.1 |
| Annualized % change | 0.6 | -0.1 | 1.2 | 3.3 | 4.3 | 4.7 | 2.6 |
| 2011 Q4 | 2012 Q1 | 2012 Q2 | 2012 Q3 | 2012 Q4 | 2013 Q1 | 2013 Q2 | 2013 Q3 | ||
|---|---|---|---|---|---|---|---|---|---|
| Real GDP* | No Policy | 13,033.4 | 13,129.1 | 13,214.2 | 13,268.1 | 13,334.6 | 13,509.8 | 13,697.7 | 13,972.8 |
| Annualized % change | 4.1 | 3.0 | 2.6 | 1.6 | 2.0 | 5.4 | 5.7 | 8.3 | |
| Real GDP* | Actual | 15,190 | 15,291 | 15,362 | 15,381 | 15,384 | 15,457 | 15,500 | 15,614 |
| Annualized % change | 4.6 | 2.7 | 1.9 | 0.5 | 0.1 | 1.9 | 1.1 | 3.0 | |
| Payroll employment** | No Policy | 122.5 | 123.5 | 123.8 | 124.4 | 125.2 | 126.3 | 127.4 | 128.7 |
| Annualized % change | 1.7 | 3.2 | 1.2 | 1.8 | 2.6 | 3.5 | 3.5 | 4.3 | |
| Payroll employment** | Actual | 132.63 | 133.45 | 133.85 | 134.26 | 134.84 | 135.54 | 136.1 | 136.64 |
| Annualized % change | 1.7 | 2.5 | 1.2 | 1.2 | 1.7 | 2.1 | 1.7 | 1.6 | |
| Unemployment rate (%) | No Policy | 15.6 | 15.1 | 14.9 | 14.7 | 14.3 | 13.9 | 13.4 | 12.3 |
| Unemployment rate (%) | Actual | 8.6 | 8.3 | 8.2 | 8.0 | 7.8 | 7.7 | 7.5 | 7.2 |
| CPI*** | No Policy | 207.2 | 207.8 | 207.9 | 208.5 | 209.8 | 210.4 | 210.3 | 211.5 |
| Annualized % change | 0.3 | 1.2 | 0.2 | 1.2 | 2.4 | 1.2 | -0.2 | 2.4 | |
| CPI*** | Actual | 227.0 | 228.3 | 228.9 | 229.9 | 231.4 | 232.2 | 232.1 | 233.4 |
| Annualized % change | 1.7 | 2.3 | 1.0 | 1.8 | 2.6 | 1.4 | -0.1 | 2.3 | |
| 2013 Q4 | 2014 Q1 | 2014 Q2 | 2014 Q3 | 2014 Q4 | 2015 Q1 | 2015 Q2 | ||
|---|---|---|---|---|---|---|---|---|
| Real GDP* | No Policy | 14,288.6 | 14,432.5 | 14,727.5 | 14,993.0 | 15,157.1 | 15,272.1 | 15,472.8 |
| Annualized % change | 9.4 | 4.1 | 8.4 | 7.4 | 4.5 | 3.1 | 5.4 | |
| Real GDP* | Actual | 15,762 | 15,725 | 15,902 | 16,069 | 16,151 | 16,177 | 16,270 |
| Annualized % change | 3.8 | -0.9 | 4.6 | 4.3 | 2.1 | 0.6 | 2.3 | |
| Payroll employment** | No Policy | 130.1 | 131.6 | 133.0 | 134.2 | 135.6 | 136.8 | 138.0 |
| Annualized % change | 4.3 | 4.6 | 4.5 | 3.6 | 4.2 | 3.6 | 3.4 | |
| Payroll employment** | Actual | 137.3 | 137.84 | 138.64 | 139.38 | 140.23 | 141.01 | 141.6 |
| Annualized % change | 1.9 | 1.6 | 2.3 | 2.2 | 2.5 | 2.2 | 1.7 | |
| Unemployment rate (%) | No Policy | 11.5 | 10.5 | 9.6 | 9.1 | 8.5 | 8.1 | 7.6 |
| Unemployment rate (%) | Actual | 7.0 | 6.6 | 6.2 | 6.1 | 5.7 | 5.6 | 5.4 |
| CPI*** | No Policy | 212.4 | 213.7 | 215.2 | 216.1 | 216.0 | 214.8 | 216.9 |
| Annualized % change | 1.6 | 2.4 | 2.9 | 1.7 | -0.1 | -2.2 | 3.9 | |
| CPI*** | Actual | 234.2 | 235.4 | 236.9 | 237.5 | 237.0 | 235.2 | 236.9 |
| Annualized % change | 1.4 | 2.1 | 2.4 | 1.2 | -0.9 | -3.1 | 3.0 |
| TABLE B2 | |||||||||
|---|---|---|---|---|---|---|---|---|---|
| Economic Impact of No Fiscal Stimulus | |||||||||
| 2008 Q1 | 2008 Q2 | 2008 Q3 | 2008 Q4 | 2009 Q1 | 2009 Q2 | 2009 Q3 | 2009 Q4 | ||
| Real GDP* | No Fiscal Stimulus | 14,890 | 14,907 | 14,809 | 14,530 | 14,320 | 14,198 | 14,121 | 14,110 |
| Annualized % change | -2.7 | 0.5 | -2.6 | -7.4 | -5.6 | -3.4 | -2.2 | -0.3 | |
| Real GDP* | Actual | 14,890 | 14,963 | 14,892 | 14,577 | 14,375 | 14,356 | 14,403 | 14,542 |
| Annualized % change | -2.7 | 2.0 | -1.9 | -8.2 | -5.4 | -0.5 | 1.3 | 3.9 | |
| Payroll employment** | No Fiscal Stimulus | 138.3 | 137.8 | 137.0 | 135.4 | 133.2 | 130.9 | 129.5 | 128.3 |
| Annualized % change | 0.1 | -1.5 | -2.1 | -4.6 | -6.5 | -6.7 | -4.1 | -3.7 | |
| Payroll employment** | Actual | 138.3 | 137.8 | 137.1 | 135.5 | 133.2 | 131.4 | 130.4 | 129.9 |
| Annualized % change | 0.1 | -1.4 | -2.0 | -4.6 | -6.5 | -5.5 | -2.9 | -1.6 | |
| Unemployment rate (%) | No Fiscal Stimulus | 5.0 | 5.3 | 6.0 | 6.9 | 8.3 | 9.4 | 10.0 | 10.6 |
| Unemployment rate (%) | Actual | 5.0 | 5.3 | 6.0 | 6.9 | 8.3 | 9.3 | 9.6 | 9.9 |
| CPI*** | No Fiscal Stimulus | 212.8 | 215.5 | 218.8 | 213.8 | 212.3 | 213.4 | 214.0 | 214.7 |
| Annualized % change | 4.4 | 5.3 | 6.3 | -8.9 | -2.8 | 2.1 | 1.3 | 1.3 | |
| CPI*** | Actual | 212.8 | 215.5 | 218.9 | 213.9 | 212.4 | 213.5 | 215.3 | 217.0 |
| Annualized % change | 4.4 | 5.3 | 6.3 | -8.9 | -2.7 | 2.1 | 3.5 | 3.2 | |
| 2010 Q1 | 2010 Q2 | 2010 Q3 | 2010 Q4 | 2011 Q1 | 2011 Q2 | 2011 Q3 | ||
|---|---|---|---|---|---|---|---|---|
| Real GDP* | No Fiscal Stimulus | 14,120 | 14,232 | 14,323 | 14,411 | 14,368 | 14,494 | 14,556 |
| Annualized % change | 0.3 | 3.2 | 2.6 | 2.5 | -1.2 | 3.6 | 1.7 | |
| Real GDP* | Actual | 14,605 | 14,746 | 14,846 | 14,939 | 14,881 | 14,990 | 15,021 |
| Annualized % change | 1.7 | 3.9 | 2.7 | 2.5 | -1.5 | 2.9 | 0.8 | |
| Payroll employment** | No Fiscal Stimulus | 127.5 | 127.8 | 127.4 | 127.7 | 128.0 | 128.8 | 129.6 |
| Annualized % change | -2.3 | 0.8 | -1.1 | 0.6 | 1.0 | 2.7 | 2.5 | |
| Payroll employment** | Actual | 129.7 | 130.4 | 130.3 | 130.7 | 131.0 | 131.7 | 132.1 |
| Annualized % change | -0.5 | 2.0 | -0.1 | 1.0 | 1.1 | 2.0 | 1.3 | |
| Unemployment rate (%) | No Fiscal Stimulus | 10.8 | 10.8 | 10.8 | 10.9 | 10.8 | 10.8 | 10.7 |
| Unemployment rate (%) | Actual | 9.8 | 9.6 | 9.5 | 9.5 | 9.1 | 9.1 | 9.0 |
| CPI*** | No Fiscal Stimulus | 214.5 | 214.2 | 214.3 | 215.6 | 217.2 | 219.4 | 220.6 |
| Annualized % change | -0.3 | -0.5 | 0.0 | 2.5 | 3.1 | 4.1 | 2.2 | |
| CPI*** | Actual | 217.4 | 217.3 | 217.9 | 219.7 | 222.0 | 224.6 | 226.1 |
| Annualized % change | 0.6 | -0.1 | 1.2 | 3.3 | 4.3 | 4.7 | 2.6 |
| 2011 Q4 | 2012 Q1 | 2012 Q2 | 2012 Q3 | 2012 Q4 | 2013 Q1 | 2013 Q2 | 2013 Q3 | ||
|---|---|---|---|---|---|---|---|---|---|
| Real GDP* | No Fiscal Stimulus | 14,728 | 14,837 | 14,925 | 14,962 | 14,985 | 15,098 | 15,196 | 15,367 |
| Annualized % change | 4.8 | 3.0 | 2.4 | 1.0 | 0.6 | 3.0 | 2.6 | 4.6 | |
| Real GDP* | Actual | 15,190 | 15,291 | 15,362 | 15,381 | 15,384 | 15,457 | 15,500 | 15,614 |
| Annualized % change | 4.6 | 2.7 | 1.9 | 0.5 | 0.1 | 1.9 | 1.1 | 3.0 | |
| Payroll employment** | No Fiscal Stimulus | 130.2 | 131.2 | 131.6 | 132.1 | 132.8 | 133.6 | 134.4 | 135.1 |
| Annualized % change | 1.8 | 3.1 | 1.3 | 1.4 | 2.0 | 2.6 | 2.3 | 2.3 | |
| Payroll employment** | Actual | 132.6 | 133.5 | 133.9 | 134.3 | 134.8 | 135.5 | 136.1 | 136.6 |
| Annualized % change | 1.7 | 2.5 | 1.2 | 1.2 | 1.7 | 2.1 | 1.7 | 1.6 | |
| Unemployment rate (%) | No Fiscal Stimulus | 10.3 | 9.8 | 9.6 | 9.4 | 9.2 | 9.0 | 8.7 | 8.2 |
| Unemployment rate (%) | Actual | 8.6 | 8.3 | 8.2 | 8.0 | 7.8 | 7.7 | 7.5 | 7.2 |
| CPI*** | No Fiscal Stimulus | 221.4 | 222.6 | 223.1 | 224.0 | 225.4 | 226.2 | 226.2 | 227.5 |
| Annualized % change | 1.5 | 2.1 | 0.9 | 1.7 | 2.6 | 1.4 | -0.1 | 2.4 | |
| CPI*** | Actual | 227.0 | 228.3 | 228.9 | 229.9 | 231.4 | 232.2 | 232.1 | 233.4 |
| Annualized % change | 1.7 | 2.3 | 1.0 | 1.8 | 2.6 | 1.4 | -0.1 | 2.3 | |
| 2013 Q4 | 2014 Q1 | 2014 Q2 | 2014 Q3 | 2014 Q4 | 2015 Q1 | 2015 Q2 | ||
|---|---|---|---|---|---|---|---|---|
| Real GDP* | No Fiscal Stimulus | 15,563 | 15,573 | 15,787 | 15,977 | 16,069 | 16,099 | 16,191 |
| Annualized % change | 5.2 | 0.3 | 5.6 | 4.9 | 2.3 | 0.7 | 2.3 | |
| Real GDP* | Actual | 15,762 | 15,725 | 15,902 | 16,069 | 16,151 | 16,177 | 16,270 |
| Annualized % change | 3.8 | -0.9 | 4.6 | 4.3 | 2.1 | 0.6 | 2.3 | |
| Payroll employment** | No Fiscal Stimulus | 136.0 | 136.8 | 137.8 | 138.8 | 139.8 | 140.7 | 141.3 |
| Annualized % change | 2.8 | 2.4 | 2.9 | 2.7 | 3.0 | 2.5 | 1.8 | |
| Payroll employment** | Actual | 137.3 | 137.8 | 138.6 | 139.4 | 140.2 | 141.0 | 141.6 |
| Annualized % change | 1.9 | 1.6 | 2.3 | 2.2 | 2.5 | 2.2 | 1.7 | |
| Unemployment rate (%) | No Fiscal Stimulus | 7.7 | 7.3 | 6.7 | 6.5 | 6.0 | 5.8 | 5.6 |
| Unemployment rate (%) | Actual | 7.0 | 6.6 | 6.2 | 6.1 | 5.7 | 5.6 | 5.4 |
| CPI*** | No Fiscal Stimulus | 228.4 | 229.7 | 231.2 | 232.1 | 231.8 | 230.2 | 232.2 |
| Annualized % change | 1.6 | 2.3 | 2.7 | 1.5 | -0.5 | -2.6 | 3.4 | |
| CPI*** | Actual | 234.2 | 235.4 | 236.9 | 237.5 | 237.0 | 235.2 | 236.9 |
| Annualized % change | 1.4 | 2.1 | 2.4 | 1.2 | -0.9 | -3.1 | 3.0 |
| TABLE B3 | |||||||||
|---|---|---|---|---|---|---|---|---|---|
| Estimated Impact of the American Recovery and Reinvestment Act | |||||||||
| Real GDP (%) | Employment (millions) | Unemployment Rate (percentage point) | |||||||
| CBO Low | CBO High | Moody’s | CBO Low | CBO High | Moody’s | CBO Low | CBO High | Moody’s | |
| 2009 | |||||||||
| Q1 | 0.0 | 0.1 | 0.0 | 0.0 | 0.0 | 0.0 | 0.0 | 0.0 | 0.0 |
| Q2 | 0.4 | 1.3 | 0.8 | 0.1 | 0.5 | 0.5 | -0.1 | -0.3 | -0.3 |
| Q3 | 0.6 | 2.4 | 1.6 | 0.3 | 1.1 | 0.9 | -0.2 | -0.6 | -0.5 |
| Q4 | 0.7 | 3.3 | 2.7 | 0.5 | 1.9 | 1.6 | -0.2 | -1.0 | -0.8 |
| 2010 | |||||||||
| Q1 | 0.9 | 4.3 | 3.2 | 0.6 | 2.7 | 2.2 | -0.3 | -1.5 | -1.1 |
| Q2 | 0.8 | 4.6 | 3.3 | 0.7 | 3.4 | 2.6 | -0.4 | -1.8 | -1.3 |
| Q3 | 0.7 | 4.1 | 3.4 | 0.7 | 3.6 | 2.9 | -0.4 | -2.0 | -1.5 |
| Q4 | 0.6 | 3.5 | 3.3 | 0.6 | 3.5 | 2.7 | -0.3 | -1.9 | -1.6 |
| 2011 | |||||||||
| Q1 | 0.6 | 3.2 | 3.0 | 0.6 | 3.3 | 2.6 | -0.3 | -1.8 | -1.6 |
| Q2 | 0.4 | 2.5 | 2.4 | 0.5 | 2.9 | 2.0 | -0.3 | -1.6 | -1.3 |
| Q3 | 0.3 | 2.0 | 1.6 | 0.4 | 2.4 | 1.2 | -0.2 | -1.3 | -0.8 |
| Q4 | 0.2 | 1.5 | 1.1 | 0.3 | 2.0 | 0.8 | -0.2 | -1.1 | -0.6 |
| 2012 | |||||||||
| Q1 | 0.1 | 1.0 | 0.8 | 0.2 | 1.5 | 0.6 | -0.1 | -0.8 | -0.5 |
| Q2 | 0.1 | 0.8 | 0.6 | 0.2 | 1.2 | 0.4 | -0.1 | -0.6 | -0.4 |
| Q3 | 0.1 | 0.7 | 0.4 | 0.2 | 0.9 | 0.3 | -0.1 | -0.5 | -0.3 |
| Q4 | 0.1 | 0.6 | 0.3 | 0.1 | 0.8 | 0.2 | -0.1 | -0.4 | -0.2 |
| 2013 | |||||||||
| Q1 | 0.1 | 0.5 | 0.2 | 0.1 | 0.6 | 0.2 | -0.1 | -0.3 | -0.1 |
| Q2 | 0.1 | 0.4 | 0.1 | 0.1 | 0.5 | 0.1 | 0.0 | -0.3 | -0.1 |
| Q3 | 0.1 | 0.4 | 0.1 | 0.1 | 0.5 | 0.1 | 0.0 | -0.3 | -0.1 |
| Q4 | 0.0 | 0.3 | 0.0 | 0.1 | 0.4 | 0.1 | 0.0 | -0.2 | 0.0 |
| 2014 | |||||||||
| Q1 | 0.0 | 0.3 | 0.0 | 0.1 | 0.4 | 0.0 | 0.0 | -0.2 | 0.0 |
| Q2 | 0.0 | 0.2 | 0.0 | 0.1 | 0.3 | 0.0 | 0.0 | -0.2 | 0.0 |
| Q3 | 0.0 | 0.2 | 0.0 | 0.0 | 0.3 | 0.0 | 0.0 | -0.1 | 0.0 |
| Q4 | 0.0 | 0.2 | 0.0 | 0.0 | 0.2 | 0.0 | 0.0 | -0.1 | 0.0 |
| TABLE B4 | |||||||||
|---|---|---|---|---|---|---|---|---|---|
| Economic Impact of No Financial Policy | |||||||||
| 2008 Q1 | 2008 Q2 | 2008 Q3 | 2008 Q4 | 2009 Q1 | 2009 Q2 | 2009 Q3 | 2009 Q4 | ||
| Real GDP* | No Financial Policy | 14,890 | 14,963 | 14,891 | 14,498 | 14,161 | 14,012 | 13,948 | 13,972 |
| Annualized % change | -2.7 | 2.0 | -1.9 | -10.2 | -9.0 | -4.2 | -1.8 | 0.7 | |
| Real GDP* | Actual | 14,890 | 14,963 | 14,892 | 14,577 | 14,375 | 14,356 | 14,403 | 14,542 |
| Annualized % change | -2.7 | 2.0 | -1.9 | -8.2 | -5.4 | -0.5 | 1.3 | 3.9 | |
| Payroll employment** | No Financial Policy | 138.3 | 137.8 | 137.1 | 135.3 | 132.3 | 129.7 | 127.8 | 126.6 |
| Annualized % change | 0.1 | -1.4 | -2.0 | -5.3 | -8.3 | -7.9 | -5.7 | -3.7 | |
| Payroll employment** | Actual | 138.3 | 137.8 | 137.1 | 135.5 | 133.2 | 131.4 | 130.4 | 129.9 |
| Annualized % change | 0.1 | -1.4 | -2.0 | -4.6 | -6.5 | -5.5 | -2.9 | -1.6 | |
| Unemployment rate (%) | No Financial Policy | 5.0 | 5.3 | 6.0 | 7.0 | 8.5 | 10.0 | 10.9 | 11.8 |
| Unemployment rate (%) | Actual | 5.0 | 5.3 | 6.0 | 6.9 | 8.3 | 9.3 | 9.6 | 9.9 |
| CPI*** | No Financial Policy | 212.8 | 215.5 | 218.9 | 213.8 | 212.2 | 213.1 | 213.5 | 213.6 |
| Annualized % change | 4.4 | 5.3 | 6.3 | -8.9 | -2.9 | 1.7 | 0.7 | 0.2 | |
| CPI*** | Actual | 212.8 | 215.5 | 218.9 | 213.9 | 212.4 | 213.5 | 215.3 | 217.0 |
| Annualized % change | 4.4 | 5.3 | 6.3 | -8.9 | -2.7 | 2.1 | 3.5 | 3.2 | |
| 2010 Q1 | 2010 Q2 | 2010 Q3 | 2010 Q4 | 2011 Q1 | 2011 Q2 | 2011 Q3 | ||
|---|---|---|---|---|---|---|---|---|
| Real GDP* | No Financial Policy | 13,933 | 13,982 | 14,021 | 14,087 | 14,015 | 14,106 | 14,128 |
| Annualized % change | -1.1 | 1.4 | 1.1 | 1.9 | -2.0 | 2.6 | 0.6 | |
| Real GDP* | Actual | 14,605 | 14,746 | 14,846 | 14,939 | 14,881 | 14,990 | 15,021 |
| Annualized % change | 1.7 | 3.9 | 2.7 | 2.5 | -1.5 | 2.9 | 0.8 | |
| Payroll employment** | No Financial Policy | 125.8 | 125.9 | 125.6 | 125.9 | 126.2 | 126.8 | 127.2 |
| Annualized % change | -2.3 | 0.2 | -1.0 | 0.9 | 1.0 | 1.9 | 1.3 | |
| Payroll employment** | Actual | 129.7 | 130.4 | 130.3 | 130.7 | 131.0 | 131.7 | 132.1 |
| Annualized % change | -0.5 | 2.0 | -0.1 | 1.0 | 1.1 | 2.0 | 1.3 | |
| Unemployment rate (%) | No Financial Policy | 12.0 | 12.4 | 12.3 | 12.4 | 12.0 | 12.0 | 11.9 |
| Unemployment rate (%) | Actual | 9.8 | 9.6 | 9.5 | 9.5 | 9.1 | 9.1 | 9.0 |
| CPI*** | No Financial Policy | 212.7 | 211.8 | 211.2 | 212.1 | 213.3 | 215.0 | 215.8 |
| Annualized % change | -1.6 | -1.7 | -1.1 | 1.6 | 2.3 | 3.3 | 1.5 | |
| CPI*** | Actual | 217.4 | 217.3 | 217.9 | 219.7 | 222.0 | 224.6 | 226.1 |
| Annualized % change | 0.6 | -0.1 | 1.2 | 3.3 | 4.3 | 4.7 | 2.6 |
| 2011 Q4 | 2012 Q1 | 2012 Q2 | 2012 Q3 | 2012 Q4 | 2013 Q1 | 2013 Q2 | 2013 Q3 | ||
|---|---|---|---|---|---|---|---|---|---|
| Real GDP* | No Financial Policy | 14,283 | 14,377 | 14,444 | 14,459 | 14,460 | 14,536 | 14,593 | 14,727 |
| Annualized % change | 4.5 | 2.7 | 1.9 | 0.4 | 0.0 | 2.1 | 1.6 | 3.7 | |
| Real GDP* | Actual | 15,190 | 15,291 | 15,362 | 15,381 | 15,384 | 15,457 | 15,500 | 15,614 |
| Annualized % change | 4.6 | 2.7 | 1.9 | 0.5 | 0.1 | 1.9 | 1.1 | 3.0 | |
| Payroll employment** | No Financial Policy | 127.7 | 128.5 | 128.9 | 129.4 | 129.9 | 130.7 | 131.4 | 132.0 |
| Annualized % change | 1.7 | 2.6 | 1.2 | 1.3 | 1.9 | 2.3 | 2.1 | 1.9 | |
| Payroll employment** | Actual | 132.6 | 133.5 | 133.9 | 134.3 | 134.8 | 135.5 | 136.1 | 136.6 |
| Annualized % change | 1.7 | 2.5 | 1.2 | 1.2 | 1.7 | 2.1 | 1.7 | 1.6 | |
| Unemployment rate (%) | No Financial Policy | 11.5 | 11.1 | 11.1 | 10.8 | 10.6 | 10.6 | 10.2 | 9.8 |
| Unemployment rate (%) | Actual | 8.6 | 8.3 | 8.2 | 8.0 | 7.8 | 7.7 | 7.5 | 7.2 |
| CPI*** | No Financial Policy | 216.2 | 216.9 | 217.1 | 217.8 | 219.1 | 219.7 | 219.6 | 220.8 |
| Annualized % change | 0.7 | 1.4 | 0.4 | 1.3 | 2.3 | 1.2 | -0.3 | 2.2 | |
| CPI*** | Actual | 227.0 | 228.3 | 228.9 | 229.9 | 231.4 | 232.2 | 232.1 | 233.4 |
| Annualized % change | 1.7 | 2.3 | 1.0 | 1.8 | 2.6 | 1.4 | -0.1 | 2.3 |
| 2013 Q4 | 2014 Q1 | 2014 Q2 | 2014 Q3 | 2014 Q4 | 2015 Q1 | 2015 Q2 | ||
|---|---|---|---|---|---|---|---|---|
| Real GDP* | No Financial Policy | 14,900 | 14,904 | 15,112 | 15,315 | 15,442 | 15,521 | 15,678 |
| Annualized % change | 4.8 | 0.1 | 5.7 | 5.5 | 3.4 | 2.1 | 4.1 | |
| Real GDP* | Actual | 15,762 | 15,725 | 15,902 | 16,069 | 16,151 | 16,177 | 16,270 |
| Annualized % change | 3.8 | -0.9 | 4.6 | 4.3 | 2.1 | 0.6 | 2.3 | |
| Payroll employment** | No Financial Policy | 132.8 | 133.5 | 134.6 | 135.4 | 136.5 | 137.5 | 138.4 |
| Annualized % change | 2.4 | 2.3 | 3.4 | 2.4 | 3.3 | 3.0 | 2.6 | |
| Payroll employment** | Actual | 137.3 | 137.8 | 138.6 | 139.4 | 140.2 | 141.0 | 141.6 |
| Annualized % change | 1.9 | 1.6 | 2.3 | 2.2 | 2.5 | 2.2 | 1.7 | |
| Unemployment rate (%) | No Financial Policy | 9.5 | 9.1 | 8.5 | 8.3 | 7.8 | 7.6 | 7.3 |
| Unemployment rate (%) | Actual | 7.0 | 6.6 | 6.2 | 6.1 | 5.7 | 5.6 | 5.4 |
| CPI*** | No Financial Policy | 221.5 | 222.7 | 224.1 | 224.8 | 224.4 | 222.7 | 224.4 |
| Annualized % change | 1.4 | 2.1 | 2.5 | 1.2 | -0.7 | -2.9 | 3.1 | |
| CPI*** | Actual | 234.2 | 235.4 | 236.9 | 237.5 | 237.0 | 235.2 | 236.9 |
| Annualized % change | 1.4 | 2.1 | 2.4 | 1.2 | -0.9 | -3.1 | 3.0 |
| TABLE B5 | |||||||||
|---|---|---|---|---|---|---|---|---|---|
| Economic Impact of No Bank Bailout | |||||||||
| 2008 Q1 | 2008 Q2 | 2008 Q3 | 2008 Q4 | 2009 Q1 | 2009 Q2 | 2009 Q3 | 2009 Q4 | ||
| Real GDP* | No Bank Bailout | 14,890 | 14,963 | 14,891 | 14,577 | 14,313 | 14,223 | 14,186 | 14,228 |
| Annualized % change | -2.7 | 2.0 | -1.9 | -8.2 | -7.1 | -2.5 | -1.0 | 1.2 | |
| Real GDP* | Actual | 14,890 | 14,963 | 14,892 | 14,577 | 14,375 | 14,356 | 14,403 | 14,542 |
| Annualized % change | -2.7 | 2.0 | -1.9 | -8.2 | -5.4 | -0.5 | 1.3 | 3.9 | |
| Payroll employment** | No Bank Bailout | 138.3 | 137.8 | 137.1 | 135.5 | 133.0 | 130.7 | 129.2 | 128.1 |
| Annualized % change | 0.1 | -1.4 | -2.0 | -4.6 | -7.2 | -6.6 | -4.7 | -3.3 | |
| Payroll employment** | Actual | 138.3 | 137.8 | 137.1 | 135.5 | 133.2 | 131.4 | 130.4 | 129.9 |
| Annualized % change | 0.1 | -1.4 | -2.0 | -4.6 | -6.5 | -5.5 | -2.9 | -1.6 | |
| Unemployment rate (%) | No Bank Bailout | 5.0 | 5.3 | 6.0 | 6.9 | 8.4 | 9.7 | 10.4 | 11.1 |
| Unemployment rate (%) | Actual | 5.0 | 5.3 | 6.0 | 6.9 | 8.3 | 9.3 | 9.6 | 9.9 |
| CPI*** | No Bank Bailout | 212.8 | 215.5 | 218.9 | 213.9 | 212.3 | 213.2 | 214.7 | 214.8 |
| Annualized % change | 4.4 | 5.3 | 6.3 | -8.9 | -2.9 | 1.7 | 2.9 | 0.2 | |
| CPI*** | Actual | 212.8 | 215.5 | 218.9 | 213.9 | 212.4 | 213.5 | 215.3 | 217.0 |
| Annualized % change | 4.4 | 5.3 | 6.3 | -8.9 | -2.7 | 2.1 | 3.5 | 3.2 | |
| 2010 Q1 | 2010 Q2 | 2010 Q3 | 2010 Q4 | 2011 Q1 | 2011 Q2 | 2011 Q3 | ||
|---|---|---|---|---|---|---|---|---|
| Real GDP* | No Bank Bailout | 14,199 | 14,272 | 14,323 | 14,378 | 14,296 | 14,385 | 14,407 |
| Annualized % change | -0.8 | 2.1 | 1.4 | 1.6 | -2.3 | 2.5 | 0.6 | |
| Real GDP* | Actual | 14,605 | 14,746 | 14,846 | 14,939 | 14,881 | 14,990 | 15,021 |
| Annualized % change | 1.7 | 3.9 | 2.7 | 2.5 | -1.5 | 2.9 | 0.8 | |
| Payroll employment** | No Bank Bailout | 127.4 | 127.6 | 127.3 | 127.5 | 127.7 | 128.3 | 128.7 |
| Annualized % change | -2.1 | 0.7 | -0.9 | 0.6 | 0.7 | 1.8 | 1.3 | |
| Payroll employment** | Actual | 129.7 | 130.4 | 130.3 | 130.7 | 131.0 | 131.7 | 132.1 |
| Annualized % change | -0.5 | 2.0 | -0.1 | 1.0 | 1.1 | 2.0 | 1.3 | |
| Unemployment rate (%) | No Bank Bailout | 11.4 | 11.4 | 11.4 | 11.6 | 11.2 | 11.3 | 11.2 |
| Unemployment rate (%) | Actual | 9.8 | 9.6 | 9.5 | 9.5 | 9.1 | 9.1 | 9.0 |
| CPI*** | No Bank Bailout | 213.6 | 212.4 | 212.3 | 213.0 | 214.6 | 216.1 | 216.9 |
| Annualized % change | -2.2 | -2.3 | -0.1 | 1.4 | 2.9 | 2.9 | 1.4 | |
| CPI*** | Actual | 217.4 | 217.3 | 217.9 | 219.7 | 222.0 | 224.6 | 226.1 |
| Annualized % change | 0.6 | -0.1 | 1.2 | 3.3 | 4.3 | 4.7 | 2.6 |
| 2011 Q4 | 2012 Q1 | 2012 Q2 | 2012 Q3 | 2012 Q4 | 2013 Q1 | 2013 Q2 | 2013 Q3 | ||
|---|---|---|---|---|---|---|---|---|---|
| Real GDP* | No Bank Bailout | 14,568 | 14,668 | 14,743 | 14,768 | 14,780 | 14,865 | 14,931 | 15,073 |
| Annualized % change | 4.6 | 2.8 | 2.1 | 0.7 | 0.3 | 2.3 | 1.8 | 3.9 | |
| Real GDP* | Actual | 15,190 | 15,291 | 15,362 | 15,381 | 15,384 | 15,457 | 15,500 | 15,614 |
| Annualized % change | 4.6 | 2.7 | 1.9 | 0.5 | 0.1 | 1.9 | 1.1 | 3.0 | |
| Payroll employment** | No Bank Bailout | 129.3 | 130.1 | 130.5 | 131.0 | 131.6 | 132.4 | 133.1 | 133.8 |
| Annualized % change | 1.7 | 2.6 | 1.3 | 1.5 | 2.0 | 2.4 | 2.2 | 2.1 | |
| Payroll employment** | Actual | 132.6 | 133.5 | 133.9 | 134.3 | 134.8 | 135.5 | 136.1 | 136.6 |
| Annualized % change | 1.7 | 2.5 | 1.2 | 1.2 | 1.7 | 2.1 | 1.7 | 1.6 | |
| Unemployment rate (%) | No Bank Bailout | 10.8 | 10.4 | 10.3 | 10.1 | 9.8 | 9.7 | 9.4 | 9.0 |
| Unemployment rate (%) | Actual | 8.6 | 8.3 | 8.2 | 8.0 | 7.8 | 7.7 | 7.5 | 7.2 |
| CPI*** | No Bank Bailout | 217.3 | 218.0 | 218.2 | 218.8 | 220.1 | 220.7 | 220.5 | 221.7 |
| Annualized % change | 0.8 | 1.3 | 0.3 | 1.3 | 2.2 | 1.1 | -0.3 | 2.2 | |
| CPI*** | Actual | 227.0 | 228.3 | 228.9 | 229.9 | 231.4 | 232.2 | 232.1 | 233.4 |
| Annualized % change | 1.7 | 2.3 | 1.0 | 1.8 | 2.6 | 1.4 | -0.1 | 2.3 |
| 2013 Q4 | 2014 Q1 | 2014 Q2 | 2014 Q3 | 2014 Q4 | 2015 Q1 | 2015 Q2 | ||
|---|---|---|---|---|---|---|---|---|
| Real GDP* | No Bank Bailout | 15,252 | 15,267 | 15,485 | 15,686 | 15,798 | 15,853 | 15,968 |
| Annualized % change | 4.9 | 0.4 | 5.8 | 5.3 | 2.9 | 1.4 | 2.9 | |
| Real GDP* | Actual | 15,762 | 15,725 | 15,902 | 16,069 | 16,151 | 16,177 | 16,270 |
| Annualized % change | 3.8 | -0.9 | 4.6 | 4.3 | 2.1 | 0.6 | 2.3 | |
| Payroll employment** | No Bank Bailout | 134.6 | 135.4 | 136.5 | 137.4 | 138.4 | 139.3 | 140.1 |
| Annualized % change | 2.5 | 2.4 | 3.1 | 2.8 | 2.9 | 2.7 | 2.1 | |
| Payroll employment** | Actual | 137.3 | 137.8 | 138.6 | 139.4 | 140.2 | 141.0 | 141.6 |
| Annualized % change | 1.9 | 1.6 | 2.3 | 2.2 | 2.5 | 2.2 | 1.7 | |
| Unemployment rate (%) | No Bank Bailout | 8.6 | 8.1 | 7.6 | 7.3 | 6.8 | 6.6 | 6.4 |
| Unemployment rate (%) | Actual | 7.0 | 6.6 | 6.2 | 6.1 | 5.7 | 5.6 | 5.4 |
| CPI*** | No Bank Bailout | 222.5 | 223.6 | 225.0 | 225.6 | 225.2 | 223.5 | 225.2 |
| Annualized % change | 1.4 | 2.1 | 2.5 | 1.2 | -0.8 | -3.0 | 3.1 | |
| CPI*** | Actual | 234.2 | 235.4 | 236.9 | 237.5 | 237.0 | 235.2 | 236.9 |
| Annualized % change | 1.4 | 2.1 | 2.4 | 1.2 | -0.9 | -3.1 | 3.0 |
References
Alan S. Blinder, After the Music Stopped: The Financial Crisis, the Response, and the Work Ahead (Penguin, 2013).
Alan S. Blinder and Mark Zandi, “How the Great Recession Was Brought to an End,” Moody’s Analytics White Paper, July 2010.
Ben S. Bernanke, Remarks at the Conference to Honor Milton Friedman, University of Chicago, Chicago, Illinois, November 8, 2002.
Ben S. Bernanke, “Monitoring the Financial System,” speech at the 49th Annual Conference on Bank Structure and Competition, Federal Reserve Bank of Chicago, May 10, 2013.
Gabriel Chodorow-Reich, Laura Feiveston, Zachary Liscow, and William Woolston, “Does State Fiscal Relief During Recessions Increase Employment? Evidence From the American Recovery and Reinvestment Act.” American Economic Journal: Economic Policy 4, no. 3 (2012), 118-145.
John F. Cogan and John B. Taylor, “What the Government Purchases Multiplier Actually Multiplied in the 2009 Stimulus Package,” NBER Working Paper 16505, 2011.
Timothy Conley and Bill Dupor, “The American Recovery and Reinvestment Act: Solely a Government Jobs Program?” Journal of Monetary Economics, 2013, 535-549.
Congressional Budget Office, “The Troubled Asset Relief Program: Report on Transactions Through December 31, 2008,” CBO Report, January 2009.
Congressional Budget Office, Estimated Impact of the American Recovery and Reinvestment Act on Employment and Economic Output from January 2010 Through March 2010, May 2010.
Congressional Budget Office, Estimated Impact of the American Recovery and Reinvestment Act on Employment and Economic Output in 2014, February 2015.
James Feyrer and Bruce Sacerdote, “Did the Stimulus Stimulate? Real Time Estimates of the Effects of the American Recovery and Reinvestment Act,” National Bureau of Economic Research Working Paper 16759, 2012.
Austan Goolsbee and Alan Krueger, “A Retrospective Look at Rescuing and Restructuring General Motors and Chrysler,” Journal of Economic Perspectives, Vol. 29, No. 2 (Spring 2015), 3-24.
Tony Hughes and Samuel Malone, “Systemic Risk Monitor 1.0: A Network Approach,” Moody’s Analytics White Paper, June 2005.
Allan Meltzer, “Policy Principles: Lessons from the Fed’s Past,” in J.D. Ciorciari and J.B. Taylor (eds.) The Road Ahead for the Fed (Hoover: 2009).
Steven Rattner, Overhaul: An Insider’s Account of the Obama Administration’s Emergency Rescue of the Auto Industry (Houghton Mifflin Harcourt: 2010).
Carmen Reinhart and Kenneth Rogoff, This Time is Different: Eight Centuries of Financial Folly (Princeton: 2009).
Christina Romer, “What Do We Know About the Effects of Fiscal Policy? Separating Evidence From Ideology,” Lecture delivered at Hamilton College, November 7, 2011.
Christina Romer and Jared Bernstein, “The Job Impact of the American Recovery and Reinvestment Act,” January 2009.
Han Tran, “Is That a Stimulus Package in Your Pocket?: The Impact of the American Recovery and Reinvestment Act on Aggregate Demand,” Princeton University senior thesis, April 2015.
John C. Williams, “Monetary Policy at the Zero Lower Bound: Putting Theory into Practice,” Brookings (Hutchins Center) Working Paper, January 2014.
Daniel Wilson, “Fiscal Spending Jobs Multipliers: Evidence from the 2009 American Recovery and Reinvestment Act,” American Economic Journal: Economic Policy 4, no. 3 (August 2012), 251-282.
Mark Zandi and Scott Hoyt, “Moody’s Analytics U.S. Macro Model Methodology,” Moody’s Analytics White Paper, April 2015.
Mark Zandi, “The State of the Domestic Auto Industry: Part II,” Testimony before the Senate Banking Committee, December 4, 2008.
Mark Zandi, Financial Shock: Global Panic and Government Bailouts—How We Got Here and What Must Be Done to Fix It (FT Press: 2009).
Mark Zandi, Paying the Price: Ending the Great Recession and Beginning a New American Century (FT Press: 2012).
End Notes
[1] See Blinder and Zandi (July 2010).
[2] See Zandi and Hoyt (April 2015).
[3] For far more detail, see Zandi (2009, 2012) or Blinder (2013).
[4] The three quotations in this paragraph come from company statements and can be found in Blinder (2013, p. 90).
[5] Real GDP grew by nearly 2% in 2007 and was essentially flat during the first half of 2008. The NBER dates the recession as starting in December 2007.
[6] This discussion focuses on the U.S. Similarly extraordinary responses took place in other countries.
[7] Reinhart and Rogoff (2009).
[8] The insurance limit was abolished altogether for business transaction accounts.
[9] By then, “depository institutions” had been defined to include the remaining giant investment banks, Goldman Sachs and Morgan Stanley.
[10] The Congressional Budget Office (2009, p. 1) initially estimated a 26% actuarial loss rate of TARP’s disbursements
to banks.
[11] See, for example, Bernanke (2013).
[12] For a good summary of the literature, see Williams (2014).
[13] While he was a Fed governor, Bernanke (2002) had famously pledged to Milton Friedman: “I would like to say to Milton and Anna [Schwartz]: Regarding the Great Depression. You’re right, we did it. We’re very sorry. But thanks to you, we won’t do it again.”
[14] Cash for clunkers, formally the Car Allowance Rebate System, in July-August 2009 also helped.
[15] See Rattner (2010) and Goolsbee and Krueger (2015).
[16] See CBO (February 2015).
[17] But actual job growth did not resume until a year later, in March 2010.
[18] See Romer and Bernstein (2009).
[19] Global economic growth and interest rates, the broad trade-weighted dollar, and oil and other commodity prices are determined in a model that is recursive to the Moody’s Analytics U.S. macro model. The simulation results from the U.S. macro model are used to drive the global and commodity market models, the results of which are then used in a second-round simulation of the U.S. macro model.
[20] See Zandi and Hoyt (April 2015).
[21] See Romer and Bernstein (2009).
[22] See Cogan and Taylor (2011).
[23] The VIX is used as a measure of financial stability by the Federal Reserve in its CCAR stress test scenarios. The macro model does not use the VIX index constructed by the Chicago Board Options Exchange, but rather a similar measure that Moody’s Analytics constructs.
[24] Potential is determined endogenously using a standard Solow growth model framework, with total factor productivity determined exogenously.
[25] There is also an “adverse” scenario which, while not as severe, moves some different economic variables. Banks must pass both.
[26] A financial institution’s expected default frequency is a measure of the probability that the firm will default within one year. Default is defined as failure to make scheduled principal or interest payments. A firm defaults when the market value of its assets (the value of the ongoing business) falls below its liabilities payable (the default point). See Hughes and Malone (2015) for more details on EDFs and how they are used to measure the degree of systemic risk in the financial system.
[27] The share of mortgage originations for government mortgage lenders the FHA and Department of Veterans Affairs has significantly declined from the peak immediately after the recession. Fannie Mae and Freddie Mac are also ramping up their credit risk sharing with private sources of capital.
[28] The estimates presented in Table 9 are different from, but quite close to, the ones we presented in Blinder and Zandi (2010). The differences stem mainly from changes to the model between 2010 and 2015.
[29] These effects are a bit larger than those presented in Blinder and Zandi in large part because of the additional fiscal stimulus provided by Congress after that paper was published. Changes to the macro model also contributed to the changed estimates.
[30] See CBO (2015)
[31] In our 2010 paper, the estimated effects on output and employment were a bit smaller, but the effect on the unemployment rate was slightly larger.
[32] QE likely also impacts the 10-year yield via global investors’ expectations regarding the future conduct of monetary policy and the path of the federal funds rate. This signaling effect was especially large for the first round of QE, but much less important by the time QE3 was rolled out. QE by other global central banks has likely also impacted 10-year Treasury yields as the Treasury bond market is a global market. The European Central Bank’s decision to begin QE in late 2014 has been especially important most recently. These effects are not explicitly captured in the macro model.
[33] Williams (2014, Table 1) presents a wide range of estimates for the effects of $600 billion worth of QE on long-term interest rates from 12 studies, mostly event studies. His range is 10 to 100 basis points. If we throw out the highest and the lowest, this huge range shrinks to a still-large 15 to 45 basis points. If we then blow up these estimates to the actual $1.425 trillion in QE in our Table, that range would translate to 36 to 107 basis points.
[34] See Zandi (2008) for a more thorough analysis of the auto bailout.
[35] The phrase “job-killing government spending” became a kind of mantra for House Speaker John Boehner (R-OH).
[36] See, for example, Cogan and Taylor (2011).
[37] For a breakdown, see Table 8.1, page 235, in Blinder (2013).
[38] As is well known, the Fed’s stated reason for not bailing out Lehman Brothers was that Lehman lacked sufficient collateral.
[39] See the results reported at a June 2015 Brookings Institution conference on this question at www.brookings.edu/events/2015/06/01-inequality-and-monetary-policy.
[40] Dodd-Frank provides for orderly liquidation.
[41] Economists used to speak of the “zero lower bound,” but we have now seen that nominal interest rates can actually go negative.
[42] Except for the subsequently greater interest burden.
[43] For example, it is well known that fiscal policies have larger multipliers if monetary policy accommodates them by preventing interest rates from rising.
More from the Authors

Alan S. Blinder, former Vice Chairman of the Federal Reserve Board, is Professor of Economics and Public Affairs at Princeton University, Vice Chairman of the Promontory Interfinancial Network, and a regular columnist for The Wall Street Journal.
Mark Zandi is Chief Economist of Moody’s Analytics, and he serves on the boards of Mortgage Guaranty Insurance Company and TRF, one of the nation’s largest community development financial institutions.