TANF Weakening as a Safety Net For Poor Families
Many policymakers continue to claim that the 1996 welfare reform law which created the Temporary Assistance for Needy Families (TANF) program was a major success. They see the TANF program's design and block grant structure as a model for the reform of other safety net programs.[1]
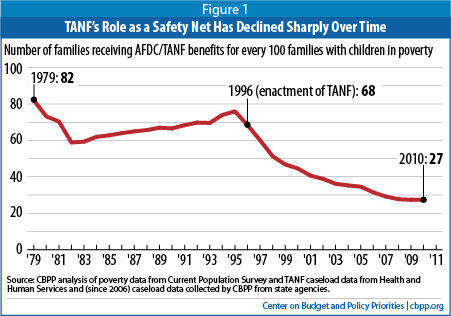
TANF's record over the last 15 years shows, however, that its role as a safety net has declined sharply over time. (See Figure 1). In 1996, for every 100 families with children living in poverty, TANF provided cash aid to 68 families. By 2010, it provided cash assistance to only 27 such families for every 100 in poverty. (We refer to this as the TANF-to-poverty ratio.)
- Sharply declining TANF caseloads are the main reason for the fall in the TANF-to-poverty ratio. The national TANF caseload declined by 58 percent between 1995 and 2010, from 4.7 million to 2.0 million. TANF caseloads declined by at least 27 percent in every state and by more than 50 percent in 36 states. Meanwhile, the number of families with children in poverty increased by 17 percent over this period, from 6.2 million to 7.3 million, and the number of poor children climbed by 12 percent, or by 1.7 million children.
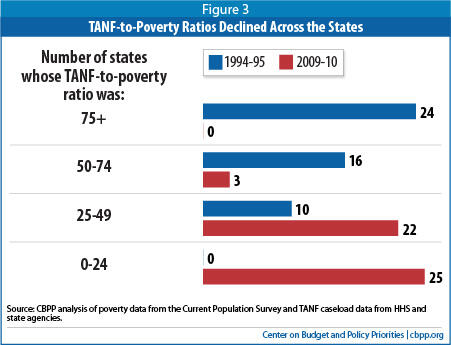
- The TANF-to-poverty ratio fell in all states but especially sharply in some. In 1994-95, almost half of the states had a ratio higher than 75 (in other words, in these states, more than 75 families with children received cash aid for every 100 living in poverty); in 2009-10, none did. In 1994-95, no state had a ratio lower than 25; in 2009-10, half of the states did.
States in the Northeast had the highest TANF-to-poverty ratios in both 1994-95 and 2009-10, while the states in the South had the lowest. However, the average ratios fell in all four regions. The average ratio fell from 97 to 44 in the Northeast, from 72 to 26 in the West, from 72 to 27 in the Midwest, and from 64 to 18 in the South. - TANF’s declining role as a safety net has far-reaching consequences. In 1995, TANF’s predecessor, Aid to Families with Dependent Children, lifted out of deep poverty 62 percent of the children who otherwise would have been below half of the poverty line; by 2005, this figure for TANF was just 21 percent[2]. TANF programs in states with a very low TANF-to-poverty ratio do little to protect children from deep poverty.
Evidence suggests that poverty among young children not only slows them in school but also shrinks their earnings as adults. Poverty researchers Greg J. Duncan of the University of California, Irvine and Katherine Magnuson of the University of Wisconsin found that among families with incomes below $25,000, children whose families received a $3,000 annual income boost when the children were under age 6 earned 17 percent more as adults, and worked 135 more hours per year after age 25, than otherwise-similar children whose families didn’t receive the income boost.[3] - Problems with TANF’s block grant structure, work participation rate, and Contingency Fund have weakened TANF’s effectiveness as a safety net for poor families. Since TANF’s inception, states have taken advantage of the block grant’s flexibility. When TANF caseloads declined in the late 1990s as the unemployment rate fell to 4 percent, they shifted TANF funds to other purposes. However, when the economy slowed and the need for cash assistance substantially increased, states were unable to reclaim those dollars to help the growing number of families that needed it; instead, they responded by cutting TANF benefits and tightening eligibility rules, often by shortening or tightening time limits. Also, because the TANF block grant is fixed at $16.6 billion a year, inflation has eroded its value by almost 30 percent since TANF’s creation in 1996.
States’ primary performance measure under TANF, the work participation rate, discourages states from assisting families in the greatest need. States are more likely to meet the rate if they assist families that already have some education, skills, and/or work experience and have the best chance of either securing employment or participating in a narrowly defined set of work activities. States can identify such families in various ways, and many states do so. As a result, the families that most need a safety net are the least likely to have access to it.
In establishing TANF in 1996, Congress created the Contingency Fund to give states additional federal funds to respond to increased needs during economic downturns. However, the Contingency Fund has never worked the way it was intended, for reasons such as insufficient funding and overly restrictive rules for when states can access the Fund. - Policymakers can strengthen TANF’s role as a safety net for very poor families. When Congress reauthorizes TANF — which could occur in 2012 — it should redesign the Contingency Fund so more states can make use of it in difficult economic times, establish a new performance measure that maintains TANF’s emphasis on work without rewarding states for simply removing families from the TANF caseload, and expand the types of work-preparation and work-promoting activities that states can count toward the work requirement, among other reforms.
This paper uses the TANF-to-poverty ratio — the ratio of families receiving TANF cash assistance to the number of families in poverty — to describe how TANF’s role in helping poor families has declined over time. The ratio is calculated by dividing the number of TANF cases (based on administrative data from the U.S. Department of Health and Human Services or, since 2006, data collected from states by CBPP) by the number of families with children in poverty from the Census Bureau’s Current Population Survey (CPS). We use two-year averages for our state-level calculations in order to improve the reliability of the data. (See the methodology appendix for further details. See the text box on the following page for a discussion of other measures of TANF’s effectiveness as a safety net.)
Sharp Decline in TANF-to-Poverty Ratios Shows Weakening of TANF’s Safety Net Role
The ratio of families on TANF to the number of families with children in poverty measures the extent to which TANF is available as a safety net for poor families; the lower the ratio, the more limited is TANF’s reach in helping families in poverty. Examination of state-by-state data allows us to identify states in which access to the program is especially weak and where significant changes in access have occurred over time.
The number of families that receive TANF reflects two factors: (1) whether families are eligible based on state policies; and (2) whether eligible families participate. The TANF-to-poverty ratio captures both, along with changes in the size of the poverty population, so it is a particularly good measure of TANF’s reach.
If TANF is responsive to changes in the economy, the TANF-to-poverty ratio will remain fairly constant regardless of the state of the economy because both elements of the ratio — TANF caseloads and poverty — will decline during periods of economic growth and increase during recessions. Instead, it has plummeted over time, from 68 families receiving TANF for every 100 in poverty in 1996 before TANF began, to 27 for every 100 in 2010. (The same finding would hold if we used the pre-recession year 2007 as our endpoint.)
Advantages of TANF-to-Poverty Ratio Over Other Measures of TANF’s Reach
In addition to the TANF-to-poverty ratio, two other measures could be used to assess TANF’s effectiveness as a safety net: the share of eligible families that receive TANF benefits and the share of poor families that receive TANF benefits. While the trends for all three measures are similar over time, we prefer the TANF-to-poverty ratio for several reasons.
The share of eligible families receiving TANF measures how well states reach the families they have deemed eligible for assistance. Restrictive eligibility policies, however, such as short time limits and low earnings thresholds, shrink the pool of eligible families, so a state that has very restrictive policies but does a decent job of serving the narrow group of families it makes eligible would score highly on this measure despite reaching few poor families.
Also, because states have very different policies in place, state-to-state comparisons are especially problematic under such a measure, because it is impossible to disentangle what the differences mean. Comparisons over time are also problematic because a state’s eligibility rules, and hence the pool of eligible families, may change over time.
The share of poor families receiving TANFis more closely related to the TANF-to-poverty ratio, but it is not identical. The share of poor families receiving TANF measures the percentage of families with annual income below the poverty line that received TANF over the course of the year, while the TANF-to-poverty ratio simply looks at the relationship between the number of families that receive TANF and the number of poor families. Some families that receive TANF for part of the year may not be poor when their income for the year as a whole is considered, such as families that receive TANF assistance for a few months and then find a decent-paying job or families that receive a small supplemental grant while they are working.
To determine the share of poor families receiving TANF, one must know which families are poor and which poor families receive cash assistance. Because the readily available Census data under-report receipt of TANF, corrections for under-reporting are needed to estimate this measure accurately. The Urban Institute provides such estimates through its TRIM microsimulation model, but there is often a considerable lag before those estimates become available. (For example, data are currently available only through 2008.) The TANF-to-poverty ratio, in contrast, can be calculated using reliable data that are readily available, making it possible to assess TANF’s reach without such a long lag.
Caseload Decline Is Major Driver of 15-Year Decline in TANF-to-Poverty Ratio
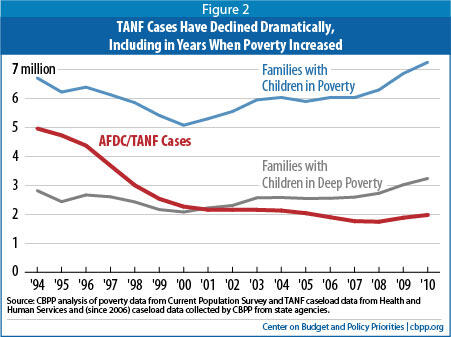
The relationship between TANF caseloads and deep poverty further illustrates TANF’s declining role in helping families in need. The number of families with children in deep poverty increased by 33 percent between 1995 and 2010, from 2.4 million to 3.2 million. But TANF failed to respond to the increase in need: between 1995 and 2010, the number of families that received TANF declined by 58 percent.
Ratios Fell in All States But Especially Sharply in Some
TANF-to-poverty ratios have declined dramatically in all states since the mid-1990s. In 1994-95, almost half of the states had a ratio higher than 75; in 2009-10, none did. In 1994-95, no state had a ratio lower than 25; in 2009-10, half of the states did (see Figure 3).
Large TANF caseload declines were the main driver of the decline in the TANF-to-poverty ratios in individual states (as well as nationally). From 1994-95 to 2009-10, caseloads declined by at least 27 percent in every state and by over 50 percent in 36 states. During that same period, the number of families with children in poverty increased by at least 10 percent in 27 states, declined by at least 10 percent in 9 states, and changed by less than 10 percent in the remaining 14 states.
Although declines in TANF caseloads were the main driver of lower TANF-to-poverty ratios, changes in poverty also played a role in some states. For example, Colorado and Connecticut experienced TANF caseload declines of 67 and 68 percent, respectively, from 1994-95 to 2009-10, but because the number of families with children in poverty declined by 35 percent during that period in Connecticut while increasing by 89 percent in Colorado, Connecticut’s TANF-to-poverty ratio declined from 86 to 42 while Colorado’s declined from 72 all the way to 13. (See Table 1.)
| Table 1: Colorado's TANF-to-Poverty Ratio Dropped More than Connecticut's Due to Different Poverty Trends |
||||||
| Colorado | Connecticut | |||||
| Families with children: | 1994-95 | 2009-10 | Year to Year Change |
1994-95 | 2009-10 | Year to Year Change |
| ...on AFDC/TANF | 39,300 | 12,900 | -67% | 60,200 | 19,000 | -68% |
| ...in Poverty | 55,000 | 103,000 | +89% | 70,000 | 45,000 | -35% |
| TANF-to-Poverty Ratio | 72 | 13 | -60 | 86 | 42 | -44 |
| Source: CBPP analysis of poverty data from Current Population Survey and TANF caseload data from Health and Human Services and (since 2006) caseload data collected by CBPP from state agencies. Year to year changes and TANF-to-poverty ratios were calculated using unrounded numbers | ||||||
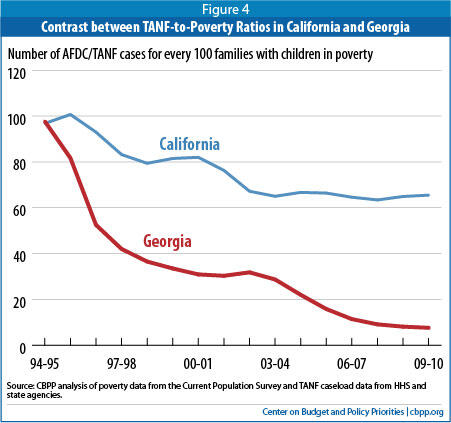
The 1996 welfare law gave states broad flexibility over how to design their TANF programs and allocate state and federal TANF funds. This is one reason why the decline in TANF-to-poverty ratios was much more pronounced in some states than others — some states adopted very restrictive policies and made it difficult for families to initially receive or to continue receiving assistance. For example, Georgia and California had similar ratios in 1994-95 (98 and 97, respectively) but very dissimilar ratios by 2009-10 (8 and 66, respectively) as shown in Figure 4. Georgia’s ratio fell so dramatically because TANF caseloads declined by 85 percent even as the number of families with children in poverty grew by 92 percent. In contrast, California’s TANF caseload declined by 39 percent and the number of families with children in poverty declined by 10 percent. Georgia's dramatic TANF caseload decline was largely due to a mix of policies that Georgia implemented to make it harder for families to receive TANF and easier to sanction families off the program.
Given the dramatic decline in TANF-to-poverty ratios nationwide, what it means to have a high ratio in comparison to other states has changed dramatically. In 1994-95, a state had to have a ratio higher than 85 to be among the top 20 states. In 2009-10, a state only needed a ratio higher than 32 to be in the top 20. TANF-to-poverty ratios may still be declining in many states even though they are already very low — 22 states had their lowest ratio in 2009-10, the last year measured.
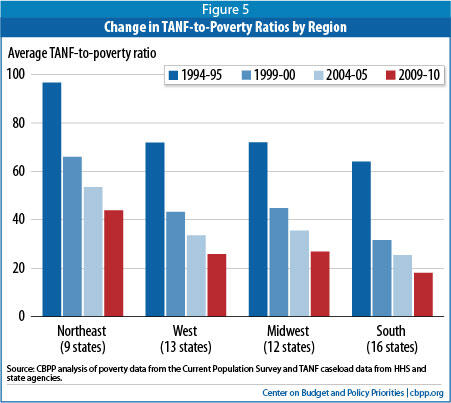
Decline Was Large in All Regions
As a group, states in the Northeast had the highest TANF-to-poverty ratios in both 1994-95 and 2009-10, while states in the South had the lowest. However, the average ratios fell in all four regions. The average ratio fell from 97 to 44 in the Northeast, from 72 to 26 in the West, from 72 to 27 in the Midwest, and from 64 to 18 in the South. (See Figure 5.)
Sharply declining TANF caseloads are the main reason for the drop in the TANF-to-poverty ratios across all the regions, although caseloads fell the most in the South. States in the South averaged a TANF caseload decline of 68 percent, compared to 57 percent in midwestern states, 56 percent in western states, and 55 percent in northeastern states.
TANF's Declining Role as Safety Net Has Far-Reaching Consequences
A low TANF-to-poverty ratio indicates that TANF is reaching only a small share of families with children in need. Aid to Families with Dependent Children (AFDC), which TANF replaced, played a significant role in reducing deep poverty. However, an analysis we conducted of deep poverty using data for the 1995-2005 period and a comprehensive poverty measure showed that deep poverty among children rose during that decade, primarily due to a weakening of the safety net, particularly TANF. In 1995, AFDC lifted out of deep poverty 62 percent of children who would otherwise have been below half of the poverty line; by 2005, this figure for TANF was just 21 percent.[4] TANF programs in states with a very low TANF-to-poverty ratio do little to protect children from deep poverty.
Two well-known poverty researchers, Greg J. Duncan and Katherine Magnuson, have shown why this trend is so troubling, providing evidence that poverty among young children not only slows them in school but also shrinks their earnings as adults.[5] Welfare-to-work programs and other anti-poverty experiments “suggest that income plays a causal role in boosting younger children’s achievement” in preschool and elementary school, they note. (TANF is often a critical source of income for the most vulnerable families with young children.) They also found that among families with incomes below $25,000, children whose families received a $3,000 annual income boost when the children were under age 6 earned 17 percent more as adults, and worked 135 more hours per year after age 25, than otherwise-similar children whose families didn’t receive the income boost. The same effect was not found among families making over $25,000, for whom a $3,000 boost in income increased young children’s later earnings by only 2 percent.
Duncan and Magnuson have urged policymakers to ensure that sanctions and other TANF regulations do not deny benefits to families with very young children: “Not only do young children appear to be most vulnerable to the consequences of deep poverty, but mothers with very young children are also least able to support themselves through employment in the labor market.” This research suggests that other potential policy changes within TANF, such as establishing harsher time limits or significantly reducing benefits, could also harm young children.
Features of TANF That Limit Its Effectiveness as a Safety Net
TANF was designed to serve two explicit functions: to help move adult cash-assistance recipients into the paid labor market and to provide a safety net for families when they cannot work. The recession has exposed serious weaknesses in TANF’s ability to perform both functions, but especially in its ability to provide a safety net when work is not available or feasible. Moreover, as our analysis of the TANF-to-poverty ratio over time shows, TANF’s role in providing a safety net for very poor families weakened significantly even before the start of the Great Recession.
Two key aspects of TANF’s design — its block grant structure and work participation rate requirements — discourage states from providing cash assistance to families in need. In addition, the Contingency Fund, which Congress created as a permanent part of TANF to deal with hard economic times, has been largely ineffective in encouraging or helping states to meet increased need during the Great Recession.
Weaknesses of the Block Grant Structure
A key premise underlying the TANF block grant was that states, in exchange for accepting a fixed level of federal funding, would receive considerable flexibility over their use of the funds. The recession has shown the limits — and the dangers — of such broad flexibility when funding is fixed, program purposes are broad, and federal authority is very limited.
Almost since TANF’s inception, states have taken full advantage of the block grant’s flexibility. When TANF caseloads declined amidst the hot economy of the late 1990s, states shifted TANF funds to other purposes, including child care, state earned income tax credits for working families, and child welfare and other services, in some cases replacing state dollars previously used for these purposes. But when the need for cash assistance increased, states generally were unable or unwilling to reclaim those dollars to aid the growing number of families that needed assistance; instead, they responded by cutting TANF benefits and tightening eligibility rules, often by shortening time limits or making them more severe in other ways. [6]
In addition, because the TANF block grant is fixed at $16.6 billion a year, inflation has eroded its value by almost 30 percent since TANF’s creation. That means that even if their needs had not increased, states would be less able to assist families today than when the block grant was created. An already weak safety net is growing weaker with each passing year.
Weaknesses of the Work Participation Rate
States’ primary performance measure under TANF, the work participation rate (WPR), is another key program feature that discourages states from assisting families in need. In order to avoid a financial penalty equal to as much as 5 percent of their TANF block grant, states must meet a WPR of 50 percent for all families.
States can offset the 50 percent WPR, however, with a “caseload reduction credit” — a one-percentage-point reduction in a state’s WPR for every percentage point by which the state’s TANF caseload has declined since 2005. Since the credit applies regardless of recipients’ employment status when they leave TANF, states have little incentive to ensure that families have jobs before they exit or are pushed out of the program.
TANF caseloads were already quite low in 2005. So, in order to benefit from the caseload reduction credit, states must provide cash assistance to very few families. They must serve fewer families today at a time when the unemployment rate exceeds 8 percent than in 2005, when the unemployment rate averaged just over 5 percent and the U.S. population was smaller than it is today. If caseloads climb above the 2005 level, states must meet the full 50 percent WPR by engaging recipients in work activities — something only a few states have ever achieved — or else face a loss of federal funds.
States are more likely to meet the WPR if they assist those families that have the best chance of securing employment or participating in a narrowly defined set of work activities for 30 hours per week (20 hours for families with a child under age 6). These tend to be families that already have a decent level of education, skills, and/or work experience and don’t face serious employment barriers. Many states impose stringent job search requirements as a condition of eligibility to identify such families. As a result, the families that most need a safety net often are the least likely to have access to it.
Weaknesses of the Contingency Fund
As noted, Congress’ goal in establishing the TANF Contingency Fund when TANF was created in 1996 was to give states additional federal funds to respond to increased needs during economic downturns. However, this fund has never worked the way it was intended. Reasons for its failure include:
- Many of the states hardest hit by the recession have not been able to access the fund because they do not meet its maintenance-of-effort (MOE) requirement, which is more stringent than TANF’s regular MOE requirement.
- States that receive these funds have no obligation to spend the funds to address increased need related to the weak economy, and some essentially use the funds for other purposes.
- There is insufficient money in the fund to meet the needs of all states. When TANF was created, $2 billion was allocated for the fund, all of which was exhausted a few months into fiscal year 2010. A total of $612 million is currently allocated per year, but that amount has been insufficient for eligible states to receive the full amount the law allows. The TANF Emergency Fund, a separate fund established by the 2009 Recovery Act, provided states with additional funding during 2009 and 2010 to cover the increased costs of providing basic cash assistance to families during the economic downturn, as well as providing emergency aid for purposes such as preventing evictions and homelessness and creating subsidized jobs for low-income families and youth. (In fact, 41 states mounted subsidized jobs programs and placed over 250,000 individuals in subsidized jobs with these funds.) The Emergency Fund was specifically designed so it would not be weighed down by the problematic features that have impeded the Contingency Fund’s effectiveness, and every state except Wyoming used the Emergency Fund for at least one of these purposes. The Emergency Fund expired, however, on September 30, 2010. The Obama administration requested extending it, but Congress failed to act.
Strengthening TANF's Role as a Safety Net for Very Poor Families
Although major changes in TANF’s structure are unlikely in the near future, policymakers should consider certain improvements during reauthorization of the program that would reduce states’ incentive to serve as few people as possible in their TANF programs. These improvements include:
- Redesign the Contingency Fund. A redesigned Contingency Fund should incorporate several features that helped make the TANF Emergency Fund effective. States should be able to receive additional federal funding during difficult economic periods and they should be required to use those funds to help families meet their basic needs (such as through basic assistance or subsidized employment programs), and, if funds are sufficient, for other supports for families facing hard times such as one-time emergency assistance to pay utility bills or avert homelessness. Funds should be allocated among states based on some measure of economic hardship, such as a state’s share of the number of children in poverty nationally or its share of single parents who are unemployed. States should qualify for the funds based on a measure of economic need (such as the state’s unemployment rate); once a state qualifies, it should remain eligible to receive funds for a long enough period (e.g., three or four quarters) to allow the state economy to recover.
- Establish a new performance measure. The work participation rate has proven an ineffective performance measure for TANF. In addition, the caseload reduction credit discourages states from serving the families most in need of assistance. A better approach would be to identify a new performance measure that rewards states for positive outcomes such as increasing employment or earnings or improving recipients’ education and skills. Such a measure would maintain the program’s emphasis on work without rewarding states for simply removing needy families from the TANF caseload or barring their entry into it. Also, the performance measure should adjust automatically to reflect the availability of jobs; states cannot be expected to meet the same employment-related outcomes when unemployment is high as when it is low.
- Systematically assess TANF’s effectiveness as a safety net for poor children. TANF’s effectiveness as a safety net for very poor families with children has declined sharply since its creation. To begin to reverse this trend, the Department of Health and Human Services should begin tracking and reporting on multiple measures of the program’s effectiveness as a safety net on a state-by-state basis, including its responsiveness during economic downturns and its contribution to reducing the depth of poverty. These measures should focus on assessing the extent to which a state’s TANF program serves children or families in poverty or deep poverty. The TANF-to-poverty ratios provided in this report could be a starting point — the data for calculating this measure are readily available, and it provides valid comparisons across states and over time.
- Expand the types of activities that states can count toward their work requirements in order to encourage states to serve more families with significant barriers to employment. The current work participation rate structure drives state TANF programs to use very narrowly defined pathways to work for program recipients and to keep the families with the most serious employment barriers out of the program. If policymakers choose to retain that structure, they should at least broaden the activities that count toward the work participation rate to encourage states to create programs that support alternative pathways to work for families who need more than limited job search assistance. These families have the most to gain from receiving employment assistance, but under the current structure, states have no incentive to implement strategies that have the best chance of improving their employment prospects.
- Require states to spend a minimum share of their block grant on direct assistance for poor families. The current block structure allows states to use TANF block grant and MOE funds for many different purposes. One way to strike a balance between maintaining broad state flexibility and encouraging states to provide adequate assistance to families would be to require states to spend a specific share of their TANF block grant and MOE funds to provide assistance directly to families in need. This assistance could be provided to families through cash grants or by providing subsidized employment opportunities for unemployed parents.
- Methodology and Source Notes
Appendix B - Data Tables
TANF-to-Poverty Ratios - Data File in Excel Spreadsheet
End Notes
[1] Chairman Paul Ryan's budget that the House adopted last year and proposals put forth by various presidential candidates would use TANF as a model for sweeping changes to other safety net programs such as Medicaid and SNAP and convert both programs to block grants at substantially reduced funding levels.
[2] Arloc Sherman, “Safety Net Effective at Fighting Poverty But Has Weakened For The Very Poorest,” Center on Budget and Policy Priorities, July 6, 2009, https://www.cbpp.org/cms/index.cfm?fa=view&id=2859.
[3] Greg J. Duncan and Katherine Magnuson, “The Long Reach of Early Childhood Poverty,” Pathways, Winter 2011, http://www.stanford.edu/group/scspi/_media/pdf/pathways/winter_2011/PathwaysWinter11_Duncan.pdf
[4] Arloc Sherman, “Safety Net Effective at Fighting Poverty But Has Weakened For The Very Poorest,” Center on Budget and Policy Priorities, July 6, 2009, https://www.cbpp.org/cms/index.cfm?fa=view&id=2859.
[5] Greg J. Duncan and Katherine Magnuson, “The Long Reach of Early Childhood Poverty,” Pathways, Winter 2011, http://www.stanford.edu/group/scspi/_media/pdf/pathways/winter_2011/PathwaysWinter11_Duncan.pdf.
[6] Liz Schott and LaDonna Pavetti, “Many States Cutting TANF Benefits Harshly Despite High Unemployment and Unprecedented Need,” Center on Budget and Policy Priorities, October 3, 2011, https://www.cbpp.org/cms/index.cfm?fa=view&id=3498.
More from the Authors

Areas of Expertise