Revised Trump Tax Plan Heavily Tilted Toward Wealthiest, Tax Policy Center Analysis Shows
Low- and Middle-Income People Likely Net Losers If Tax Cut Is Offset by Budget Cuts
Under Donald Trump’s revised tax cut plan, the top 0.8 percent of Americans — those who make over $1 million a year — as a group would ultimately receive nearly three times as much in tax cuts as the bottom 80 percent of Americans, today’s new Tax Policy Center (TPC) analysis finds. In addition, those at the top would receive average tax cuts that, as a percentage of their incomes and in dollar terms, would vastly exceed the average tax cuts for low- and middle-income households, TPC estimates.[1] (These and other estimates generally come either from the TPC analysis or from simply multiplying TPC’s estimates of the share of tax cuts for each income group by TPC’s estimate of the tax cut’s total size.)
The Trump campaign has said that his tax cuts would be paid for so that they wouldn’t increase the deficit. If policymakers paid for the tax cuts with offsetting budget cuts, low- and middle-income households overall would likely face net losses because they receive the bulk of the benefits that federal programs provide.
Who Would Gain from the Tax Cuts
TPC estimated the impacts of the Trump tax plan in 2017 and 2025 on people at different income levels. We focus here on 2025 because it better reflects the permanent effects of the tax cuts. TPC’s estimates show that, in 2025:[2]
- The tax cuts would raise after-tax income for those with annual incomes of over $1 million by 14.3 percent.The tax cuts would raise after-tax income for the top 0.8 percent of Americans — those with annual incomes of over $1 million — by 14.3 percent, with those households receiving average tax cuts of $310,000.
- Moreover, the tax cuts would raise after-tax income for the top 0.1 percent of Americans — with annual incomes of over $4.8 million — by a similar 14.0 percent, with those households receiving average tax cuts of $1.2 million.
- By contrast, the tax cuts would raise after-tax income for those in the middle fifth of the income scale — with annual incomes from $52,300 to $89,300[3] — by just 1.5 percent, with those households receiving average tax cuts of $900.
- Moreover, the tax cuts would raise after-tax income for those in the bottom fifth — with annual incomes up to $26,900 — by just 0.7 percent, with those households receiving average tax cuts of $100.
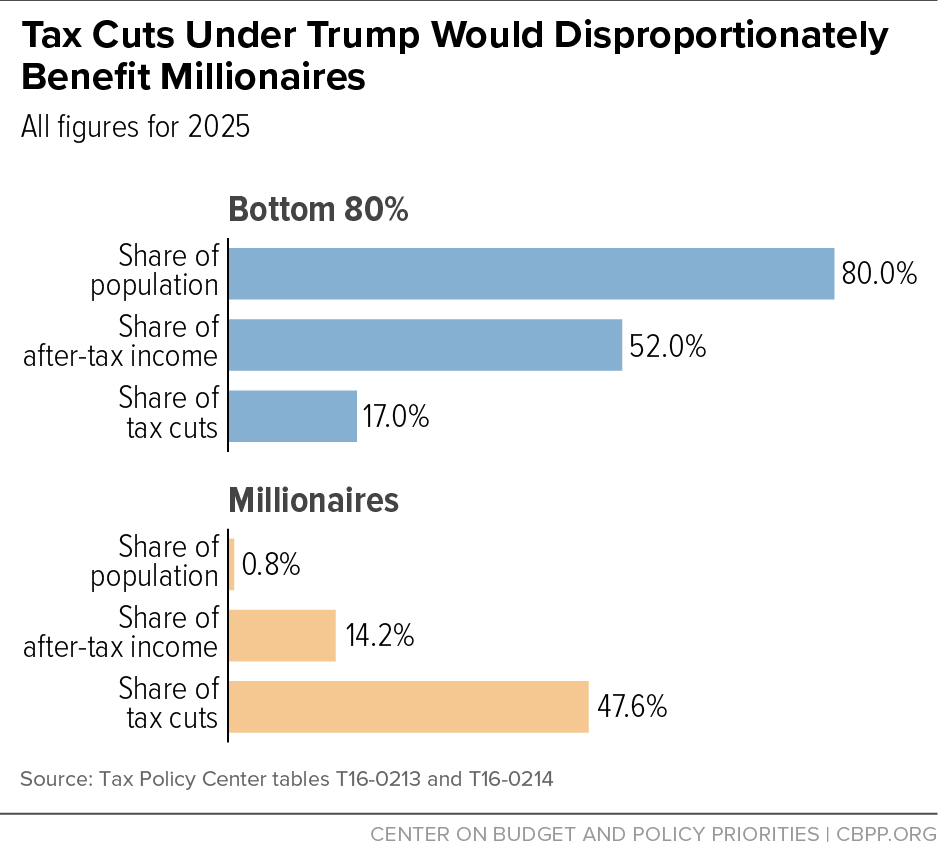
As a result, the TPC analysis shows, the top 0.8 percent, who make over $1 million a year — that is, 920,000 households with about 2.7 million people — would receive 48 percent of the tax cut in 2025. The rest of the top 20 percent of the population would receive 35 percent of the tax cut. And the bottom 80 percent, numbering an estimated 280 million people, would receive the remaining 17 percent of the total tax cut — that is, only a little more than one-third of what the top 0.8 percent would receive. (See Figure 1.)
In fact, even the top 0.1 percent of Americans — numbering about 350,000 people — would receive substantially more in tax cuts than the bottom 280 million people.
Over the decade, we estimate, based on the TPC data, that those who make over $1 million a year would receive $2.8 trillion of the $6.2 trillion in total tax cuts, or 45 percent of the total.[4]
The revised Trump plan, while less costly than his original tax plan, actually is more tilted to those at the top. In an earlier analysis, TPC found that millionaires would receive 38 percent of the tax cuts in 2025 under the original Trump plan, compared to the 48 percent they would secure under the revised plan.
Some Households Would Face Tax Increases, and High-income People Would Have New Opportunities for Tax Avoidance
While people in all income categories would receive a tax cut on average, the TPC analysis indicates that some households would face tax increases. “Repealing personal exemptions and the head of household filing status,” as the revised Trump tax plan would do, “would cause many large families and single parents to face tax increases,” the analysis notes. The TPC estimates show that individual filers with dependents (mostly single parents with children) with cash incomes between $20,000 and $200,000 would on average face net tax increases that reduce their after-tax income by almost 1 percent ($460).[5] Other analyses indicate that the number of people in households facing tax increases could run into the tens of millions.[6]
Also, the revised Trump plan would offer substantial new opportunities for businesses and high-income households to avoid taxes. Its proposal to sharply cut the top tax rate on certain “pass-through” income (business income claimed on individual tax returns) to 15 percent would cost $1.5 trillion in lost federal revenue over ten years, TPC estimates — and $649 billion of that cost would come from high-income earners using tax avoidance strategies to report their wage and salary income as “business” income in order to claim the 15 percent rate (rather than the 33 percent top tax rate they would otherwise face on wage and salary income under the Trump plan).[7] In addition, as TPC notes, the plan’s provision to allow certain businesses to deduct the full cost of certain investments in the year they are made (rather than over time, as the new plants or equipment lose value) would likely lead some firms to engage in complex avoidance arrangements to take advantage of this provision.[8]
Low- and Middle-Income Families Would Likely Be Net Losers, Due to Offsetting Budget Cuts
As noted, the Trump campaign has said that his tax cut plan would be paid for so that it doesn’t increase the deficit. Assuming at least a substantial share of the offsets came through federal spending cuts (rather than tax increases), low- and middle-income households would likely face net losses as they’d likely lose significantly more from the budget cuts than they would gain from the tax cuts. Only a very small fraction of spending cuts could come from program spending that benefits millionaire households, given how few such households there are.
Mr. Trump has proposed one specific spending cut to help offset the tax cuts: to cut total funding for non-defense programs funded through the annual appropriations process by 1 percent each year below the prior year’s level. While only offsetting $900 billion of the Trump tax plan, this proposal would reduce non-defense discretionary funding by 2026 by 29 percent, after adjusting for inflation. This category of spending — which covers a wide range of services such as veterans’ medical care, scientific and medical research, education, child care, environmental protection, and infrastructure — has been the hardest-hit part of the budget in recent years. These additional cuts would shrink non-defense discretionary spending to 2.0 percent of gross domestic product by 2026, which would be one-third below the lowest level on record, with data back to 1962.[9]
| TABLE 1 | |||
|---|---|---|---|
| Distribution of Federal Tax Change Under Trump Tax Plan, 2025 | |||
| Expanded cash income* percentile | Percent change in after-tax income |
Share of total federal tax change |
Average federal tax change (in 2016$)** |
| Lowest quintile | 0.7% | 0.8% | -$100 |
| Second quintile | 0.9 | 2.2 | -320 |
| Middle quintile | 1.5 | 5.4 | -880 |
| Fourth quintile | 1.8 | 8.6 | -1,710 |
| Top quintile | 7.3 | 82.8 | -19,740 |
| All | 4.3 | 100.0 | -3,250 |
| Addendum | |||
| 80-90 | 1.9 | 6.0 | -2,730 |
| 90-95 | 2.9 | 5.9 | -5,790 |
| 95-99 | 8.0 | 20.1 | -25,540 |
| Top 1 percent | 14.1 | 50.8 | -256,170 |
| Top 0.8 percent (millionaires) | 14.3 | 47.6 | -313,130 |
| Top 0.1 percent | 14.0 | 24.5 | -1,179,250 |
End Notes
[1] Jim Nunns, Len Burman, Jeff Rohaly, and Joe Rosenberg, “An Analysis of Donald Trump’s Revised Tax Plan,” Tax Policy Center, October 11, 2016, http://www.taxpolicycenter.org/resources/updated-presidential-tax-plans and associated TPC tables, http://www.taxpolicycenter.org/simulations/donald-trumps-revised-tax-plan-oct-2016.
[2] All of these average tax cut figures are expressed in 2016 dollars, as are all of the income figures that delineate the various income groups noted here. Note that TPC’s Table T16-0213 provides its average tax cut figures in nominal dollars, indicating, for instance, that millionaires would receive an average tax cut of $387,600 in 2025. We deflate that figure to its 2016 value, which we round to $310,000.
[3] Each quintile, or income “fifth,” in the TPC data includes one-fifth of the U.S. population, rather than one-fifth of households.
[4] TPC estimates the distribution of the tax cuts in 2017 and 2025. To estimate the tax cuts that households with incomes over $1 million would receive over the decade, we average the share of the tax cuts they would receive in 2017 and 2025, and multiply the result by $6.2 trillion (TPC’s ten-year estimate of the plan’s total tax cuts). TPC found that millionaires would receive 42.2 percent of the tax cuts in 2017 and 47.6 percent in 2025, yielding an average of 44.9 percent. Multiplying that figure by $6.2 trillion produces a total tax reduction for millionaires of $2.8 trillion.
[5] TPC table T16-0213 (“HOH” tab). TPC also finds that individual filers with dependents in the bottom four quintiles would face tax increases, on average; see T16-0214.
[6] Dylan Matthews, “Study: Donald Trump would raise taxes on millions of middle-class families,” Vox, September 26, 2016, http://www.vox.com/2016/9/26/12991790/donald-trump-tax-hike-middle-class. The Vox story discusses analyses from NYU Professor Lily Batchelder, the Tax Foundation, and Citizens for Tax Justice, all of which find that the Trump plan would raise taxes on a significant number of families.
[7] TPC noted in its analysis of the original Trump tax plan, which also had a lower rate for pass-through businesses, that even strict rules to prevent this gaming would not be entirely effective. “Congress could impose strict rules in an attempt to limit such changes in worker status,” TPC noted, “but the boundary is quite difficult to enforce under current law and would be even harder to police if the Trump proposal were enacted.” James R. Nunns, Leonard E. Burman, Jeffrey Rohaly, and Joseph Rosenberg, “Analysis of Donald Trump’s Tax Plan,” Tax Policy Center, December 22, 2015, http://www.taxpolicycenter.org/publications/analysis-donald-trumps-tax-plan/full.
[8] TPC’s estimate of the cost of the Trump plan does not include an estimate of the costs of any new avoidance behavior in response to the business-deduction provision.
[9] Richard Kogan and David Reich, “Trump ‘Penny Plan’ Would Mean Large Cut in Non-Defense Spending,” Center on Budget and Policy Priorities, September 15, 2016, https://www.cbpp.org/research/federal-budget/trump-penny-plan-would-mean-large-cut-in-non-defense-spending.
More from the Authors