Realizing the Housing Voucher Program’s Potential to Enable Families to Move to Better Neighborhoods
Housing Choice Vouchers help families afford decent, stable housing, avoid homelessness, and make ends meet. They also enable children to grow up in better neighborhoods and thereby enhance their chances of long-term health and success. When African American and Hispanic families use housing vouchers, for example, their children are nearly twice as likely as other poor minority children to grow up in low-poverty neighborhoods and somewhat less likely to grow up in extremely poor areas. Still, 343,000 children in families using vouchers lived in extremely poor neighborhoods in 2014. Vouchers could do much more to help these and other children grow up in safer, low-poverty neighborhoods with good schools.
Public housing agencies have flexibility under current Housing Choice Voucher (HCV) program rules to implement strategies to improve location outcomes, and state and local governments could facilitate these efforts. But without changes in federal policy to encourage state and local agencies to take such steps and to modify counter-productive policies — and reliable funding to maintain the number of families receiving HCV assistance and to administer the program effectively — there is little reason to expect better results.
Federal, state, and local agencies can make four sets of interrelated policy changes to help families in the HCV program live in better locations:
- Create strong incentives for state and local housing agencies to achieve better location outcomes;
- Modify policies that discourage families from living in lower-poverty communities;
- Minimize jurisdictional barriers to families’ ability to live in high-opportunity communities; and
- Assist families in using vouchers to rent in high-opportunity areas.
Evidence Shows That Neighborhoods Affect Children’s Well-Being and Long-Term Success
Where families live largely determines the quality of children’s schools, the safety of children’s playgrounds, and neighbors’ education, employment, and affluence. Location also can affect adults’ access to jobs, the cost of getting to work, the ease of obtaining fresh and reasonably priced food and other basic goods and services, and the feasibility of balancing child-care responsibilities with work schedules.[1]
A strong body of research shows that growing up in safe, low-poverty neighborhoods with good schools improves children’s academic achievement and long-term chances of success, and may reduce inter-generational poverty. Studies have also consistently found that living in segregated neighborhoods with low-quality schools and high rates of poverty and violent crime diminishes families’ well-being and children’s long-term outcomes.[2]
New Rigorous Studies Find Persuasive Evidence of Neighborhoods’ Influence
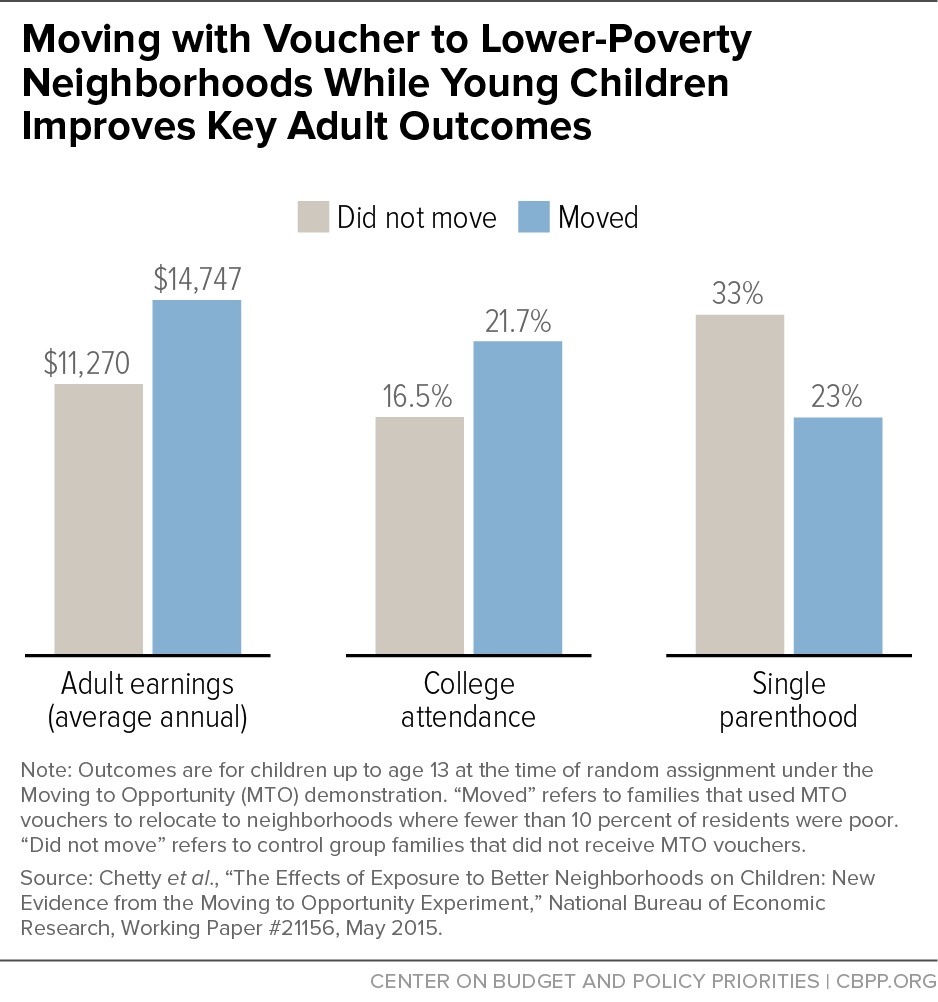
A recent groundbreaking study by Harvard economists Raj Chetty, Nathaniel Hendren, and Lawrence Katz found that young children in families that used housing vouchers to move to better neighborhoods fared much better as young adults than similar children who remained in extremely poor neighborhoods.[3] The study provided the first look at adult outcomes for children who were younger than 13 when their families entered the Moving to Opportunity (MTO) demonstration, a rigorous, random-assignment, multi-decade comparison of low-income families who used housing vouchers to relocate to low-poverty neighborhoods to similar families that remained in public housing developments in extremely poor neighborhoods.
The Chetty study found that young boys and girls in families that used a voucher to move to lower-poverty neighborhoods were 32 percent more likely to attend college and earned 31 percent more — nearly $3,500 a year — as young adults than their counterparts in families that did not receive an MTO voucher. Girls in families that moved to lower-poverty neighborhoods were also 30 percent less likely to be single parents as adults (see Figure 1). MTO’s design imparts confidence to the conclusion that neighborhood differences are responsible for these striking outcomes.[4]
Earlier MTO studies also revealed that living in safer, low-poverty neighborhoods had strong positive effects on adults’ mental and physical health. Adults in families that used an MTO housing voucher to move to lower-poverty neighborhoods reported 33 percent fewer instances of major depression, compared to those who did not receive MTO vouchers, and higher scores on measures of subjective well-being, such as happiness. Adults who moved with MTO vouchers also had much lower rates of extreme obesity and diabetes.[5] Parental depression can negatively affect children’s well-being as well as be debilitating for the adults themselves. It is well documented that parental depression (and other stress-related problems, as explained below) is associated with poor social development and poor physical, psychological, behavioral, and mental health for children, particularly young children.
The MTO studies reinforce the conclusions of earlier research. In a study of low-income children living in public housing and attending elementary schools in Montgomery County (a Maryland suburb bordering the District of Columbia), RAND researcher Heather Schwartz found that low-income students who lived in low-poverty neighborhoods and attended low-poverty schools made large gains in reading and math scores over a period of seven years, compared with similar students living in public housing and attending moderate- or moderately high-poverty schools.[6]
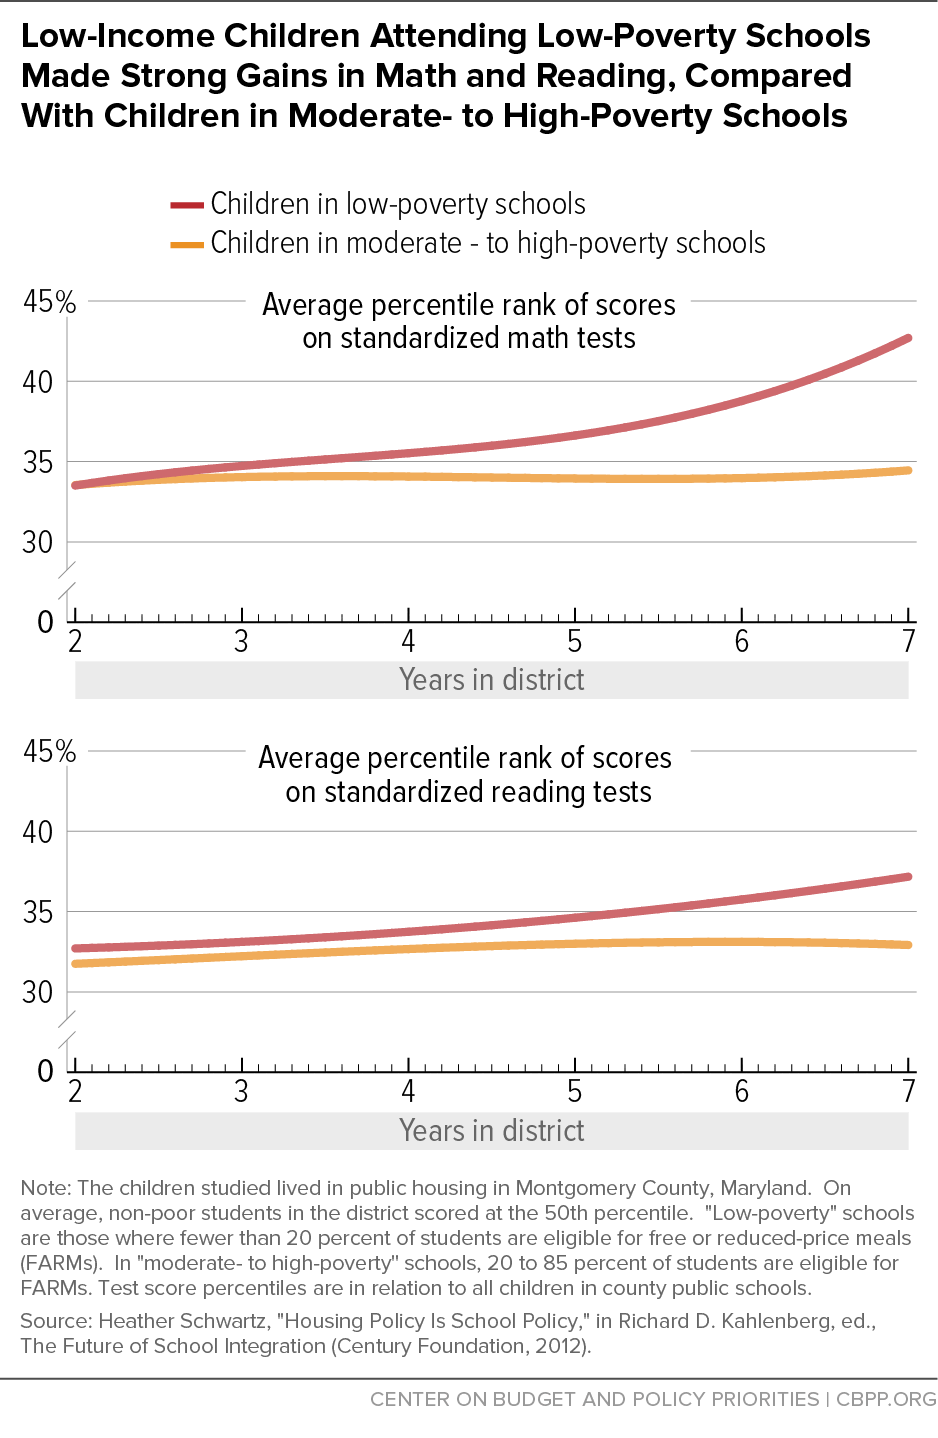
At the end of seven years, the test scores of the public housing children in low-poverty schools had risen by 8 percentile points in math and 4 percentile points in reading (see Figure 2), closing half of the achievement gap between those students and non-poor students in the district in math and one-third of the gap in reading. Those are large gains by educational standards; students living in the lowest-poverty neighborhoods made the largest gains.[7]
Studies Connect Exposure to Violence and Extreme Poverty to Worse Outcomes for Children
The studies discussed above build on a large body of research showing strong correlations between neighborhood (and school) poverty and poor student academic performance.[8] Recent studies by Robert J. Sampson and Patrick Sharkey find consistent evidence that living in neighborhoods of concentrated disadvantage — particularly those where families are exposed to violent crime — adversely affects children’s academic performance.
A seminal study by Sampson, Sharkey, and Stephen Raudenbusch tracked 6- to 12-year-old African American children in Chicago as they moved into and out of neighborhoods of concentrated disadvantage. Isolating the effects of neighborhoods from other factors such as parents’ income and marital status, they found that children living in neighborhoods of concentrated disadvantage had reduced verbal ability — which research shows is a major predictor of educational, employment, and other important life outcomes — by a magnitude equal to one to two years of schooling. Equally striking, the harmful effects became stronger the longer that children were exposed to such environments and lingered even after children had left the neighborhoods.[9]
In another series of studies, Sharkey and his colleagues examined the impact of neighborhood violence on children’s cognitive and academic performance. One study found that when preschool children were assessed within a week of a homicide occurring near their home, they were less able to control their impulses and pay attention, and they scored lower on pre-academic vocabulary and math tests.[10]
Another study comparing the standardized test performance of New York City students in the week before a violent crime occurred on their block with that of students in the week after such crimes found that such exposure significantly reduced students’ performance on English language assessments, particularly for African American students. Among African American students, the effect on scores was equivalent to 13 percent of the black-white gap in test scores and reduced students’ passing rates by 3 percentage points. While the study directly examines only the short-term effects of neighborhood violence, it has implications for students’ longer-term success, particularly if they are exposed to repeated incidents of violence, Sharkey and his colleagues note.[11]
Toxic Stress Research Explains Some Links Between Neighborhoods and Child Well-Being
These findings dovetail with the growing research about the harmful effects of toxic stress. “Toxic stress” describes the activation of the body’s stress response system that occurs when a child experiences frequent, persistent, or excessive fear or anxiety as a result of being exposed to abuse, neglect, violence, or severe hardship, particularly when the child does not receive adequate adult support in coping with the stress. While much of the research has focused on the effects of child abuse and family dysfunction, exposure to neighborhoods of concentrated disadvantage — particularly those where violent crime is more common — is also a contributing factor.
Toxic stress affects brain development, early learning, and the body’s stress response system in ways that can have a long-term effect on young children’s cognitive development and physical health.[12] Research shows, for example, that toxic stress affects brain development in the areas that regulate emotion and executive function, the latter of which includes the ability to create and follow plans, focus attention, inhibit impulses, and incorporate new information –– abilities essential to children’s success in school. Toxic stress has also been linked to physical changes that increase the risk of long-term health problems such as heart disease.[13]
Indeed, the research on toxic stress is so compelling that the American Academy of Pediatrics has adopted a formal policy statement urging policymakers to reshape policy and the provision of services in ways that reduce the causes and effects of toxic stress for young children.[14] The policy statement explicitly cites “community-level” (or neighborhood) factors such as violence as a specific risk factor for toxic stress.
The research outlined above provides powerful evidence that neighborhoods have a substantial impact on families’ well-being and children’s long-term health and success.
Increasing the Housing Choice Voucher Program’s Effectiveness at Enabling Children to Grow Up in Higher-Opportunity Neighborhoods
The Housing Choice Voucher (HCV) program is federally funded and run by a network of more than 2,200 state and local housing agencies. The program helps nearly 2.2 million low-income households pay for modestly priced, decent-quality homes in the private market. Nearly half of the households that use housing vouchers have minor children in the home.[15] The HCV program assists more families with children than public housing and Project-Based Rental Assistance, the other two major rental assistance programs, combined.[16]
This assistance helps these families to afford decent, stable housing, avoid homelessness, and make ends meet.[17] Its impact on the neighborhoods in which families live has been limited, however, and it has fallen well short of the program’s potential in this regard.[18] Even so, the HCV program has performed substantially better than HUD’s project-based rental assistance programs in enabling more low-income families with children — and particularly more African American and Latino families — to live in lower-poverty neighborhoods and avoid extreme-poverty areas.[19]
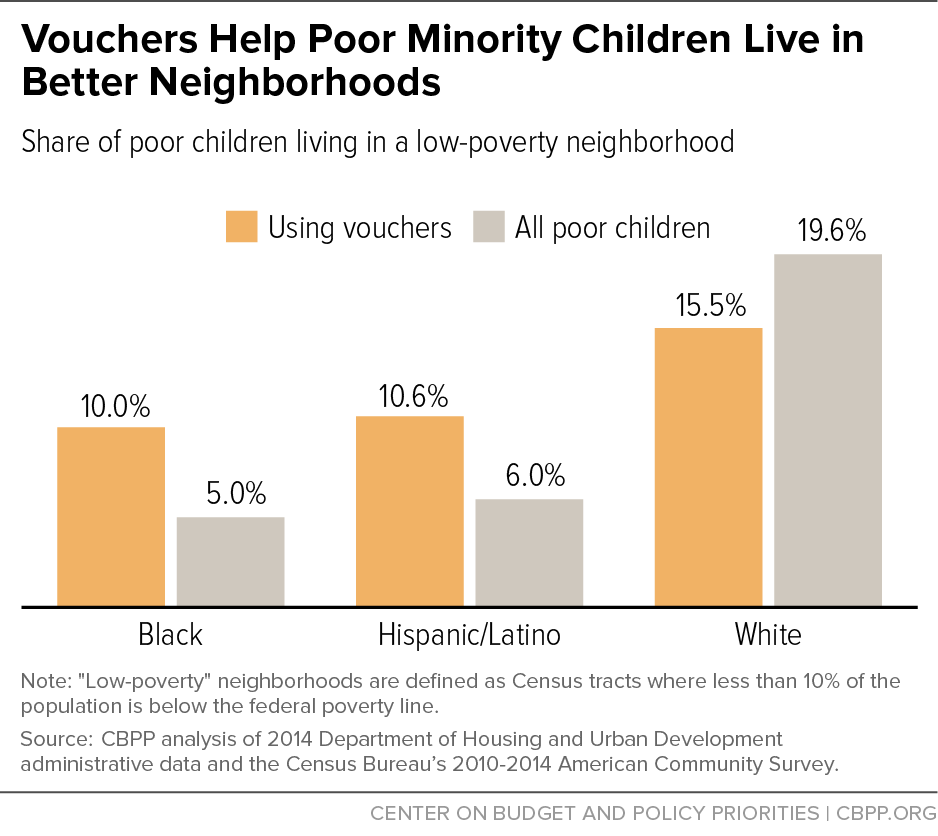
In 2014, one in eight (12.9 percent) families with children participating in the HCV program used their vouchers to live in a low-poverty area, where fewer than 10 percent of residents are poor.[20] The HCV program has enabled significantly more African American and Latino families to live in lower-poverty neighborhoods. Among families using vouchers, twice the share of poor black children, and close to twice the share of poor Hispanic children, lived in neighborhoods with less than 10 percent poverty in 2014, compared with poor black and Hispanic children generally. In contrast, poor white children in families with vouchers were less likely to live in low-poverty neighborhoods than poor white children overall. (See Figure 3.)
Having a housing voucher also reduces the likelihood that poor African American and Hispanic families will live in an extreme-poverty neighborhood, where 40 percent or more of residents are poor. In 2014, 18.2 percent of poor black families with children using a voucher lived in extreme-poverty neighborhoods, a third less than the share of all poor black children who live in extreme-poverty neighborhoods. For poor Hispanic families, having a voucher provides similar protection against living in the poorest neighborhoods, while poor white families with children are more likely to live in an extreme-poverty neighborhood if they have a voucher than if they don’t receive housing assistance.[21] (See Appendix Tables A-3 and A-4.)
As now administered, however, the HCV program does not deliver adequately on its potential to expand children’s access to good schools in safe neighborhoods that encourage upward mobility.[22] The number of poor children living in extreme-poverty neighborhoods has risen dramatically in recent years, part of a national increase in concentrated poverty.[23] As noted, 343,000 children in the HCV program live in extreme-poverty neighborhoods despite the better options that a voucher should make available to them. The program can do better.
Recommendations to Realize the Housing Choice Voucher Program’s Location Potential
That more families do not use their vouchers to reside in low-poverty neighborhoods reflects, at least in part, the constraints families face in using vouchers to access neighborhoods that provide greater opportunities.[24] Some families want the stability of remaining in their current neighborhoods or close to support networks and current jobs. But many families are largely unaware of opportunities in unfamiliar neighborhoods and might make different choices if they had more information.[25] Many also need assistance from program administrators to identify landlords who are willing to accept vouchers in communities where vouchers are infrequently used and rental vacancies are low. In addition, voucher subsidy caps are often too low to enable families to afford units in high-opportunity areas, and other program policies can limit voucher holders’ available choices.
Current federal policy essentially assumes that having a housing voucher opens up the choice of units to rent just like added income would and that poor families are aware of the housing options that a voucher makes available. But as researchers Stefanie DeLuca, Philip Garboden, and Peter Rosenblatt concluded, “the ‘free market choice’ assumptions behind the HCV program do not hold in reality.”[26] It is up to administering agencies to decide whether and how to address families’ needs for assistance in the search process.[27] Agencies that ignore the need for housing search assistance or have ineffective or counter-productive policies are at virtually no risk of HUD sanction.[28]
A limited supply of moderately priced rental units in low-poverty, non-racially concentrated neighborhoods is a significant constraint in some cities and counties.[29] But most metro areas have a sufficient supply of rental units to enable a much larger share of families to use their vouchers to rent units in areas that would likely be better for their children, if they could overcome knowledge and access barriers. One-third of all metropolitan rental units — and more than a quarter of all metropolitan units with rental charges below HUD’s Fair Market Rents — are located in neighborhoods with a poverty rate of less than 10 percent.[30]
Public housing agencies have flexibility under current federal requirements to implement strategies in their Housing Choice Voucher programs to improve location outcomes, and state and local governments could facilitate these efforts.[31] But without changes in federal policy to encourage state and local agencies to take such steps and to modify counter-productive policies — and reliable funding to maintain the number of families receiving HCV assistance and to administer the program effectively — there is little reason to expect better results.[32]
We can make substantial progress toward providing greater opportunities for families to choose affordable housing outside of extreme-poverty neighborhoods and particularly in low-poverty, safe communities with better-performing schools in the next few years, even in the current fiscally constrained environment and even without congressional action or more funding.
Federal, state, and local agencies can make four sets of interrelated policy changes that can help more families in the HCV program to live in better locations.
- Create strong incentives for local and state housing agencies to achieve better location outcomes. Federal policy should provide incentives for agencies to reduce the share of families using vouchers in extreme-poverty areas and increase the share residing in low-poverty, high-opportunity areas. HUD could do this in three ways: by giving added weight to location outcomes in measuring agency performance, reinforcing these changes with effective implementation of the new fair housing rule, and rewarding agencies that help families move to high-opportunity areas by paying these agencies additional administrative fees.
- Modify policies that discourage families from living in lower-poverty communities. Various HCV program policies impede families from moving to low-poverty areas and thereby unintentionally encourage families to use their vouchers in poor neighborhoods that often are highly racially concentrated. (Most extremely poor neighborhoods are predominantly African American and/or Latino.) HUD should set its caps on rental subsidy amounts for smaller geographic areas than it now does, and require agencies to identify available units in higher-opportunity communities with less poverty and extend the search period for families seeking to make such moves.
- Minimize jurisdictional barriers to families’ ability to choose to live in high-opportunity communities. HUD should modify the HCV program’s administrative geography to substantially reduce the extent to which the boundaries of housing agencies’ service areas impede the program’s ability to promote access to higher-opportunity neighborhoods. HUD could substantially lessen these barriers by encouraging agencies in the same metropolitan area to unify their program operations and by reducing financial disincentives for agencies to encourage “portability” moves.
- Assist families in using vouchers to live in high-opportunity areas. To expand housing choices in safe, low-poverty neighborhoods with well-performing schools, state and local governments and housing agencies should adopt policies — such as tax incentives and laws prohibiting discrimination against voucher holders — to expand participation by landlords in these neighborhoods in the HCV program and to encourage interested families to use their vouchers in these areas. Such assistance for families could include financial incentives to offset the additional costs of moving to high-opportunity areas, mobility counseling, and programs to expand access to cars and other transportation to and from these areas.
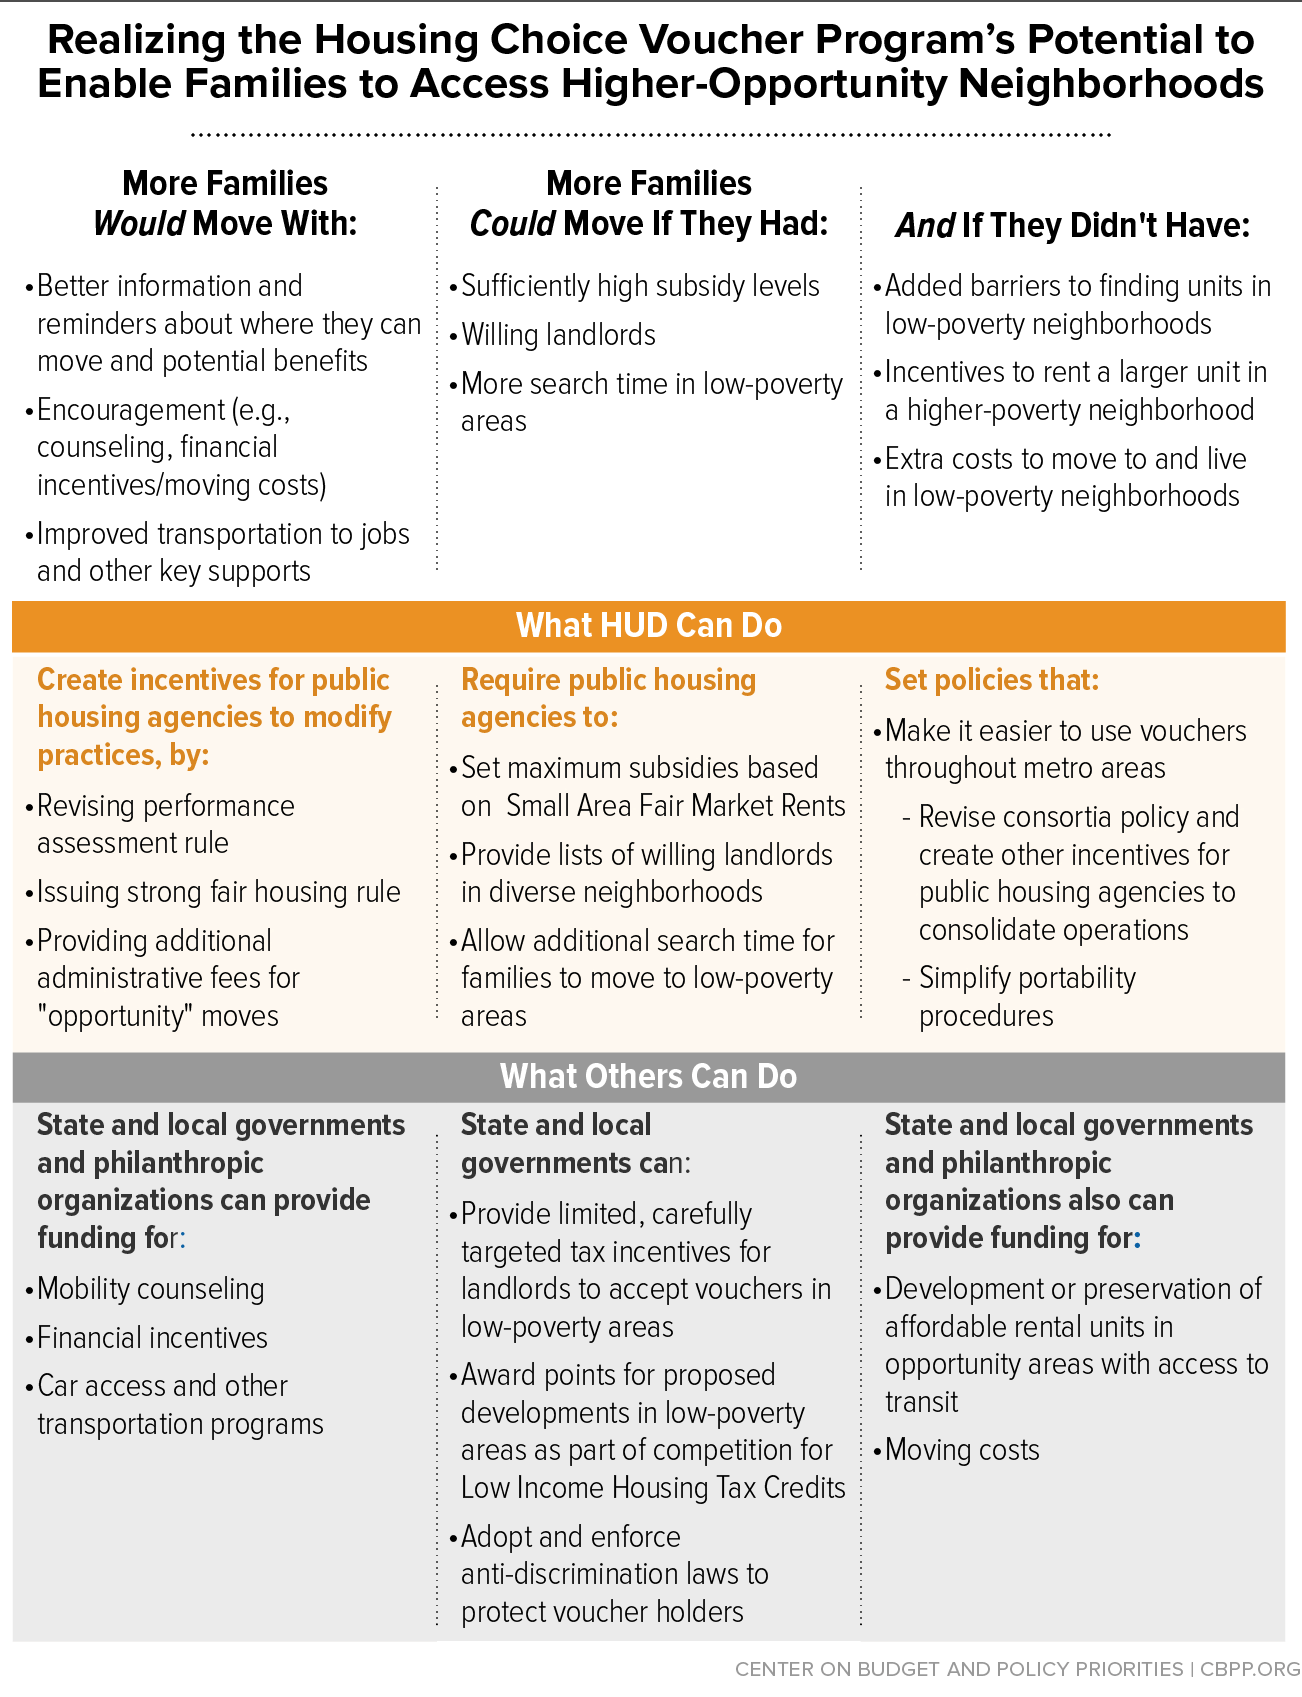
This focus on enhancing families’ ability to choose to move to areas with more opportunities for their children (or to remain in affordable housing in lower-poverty, high-opportunity neighborhoods) does not imply that policymakers should not pursue broader strategies to increase incomes, enhance safety, and improve educational performance in very poor areas. Many families prefer to remain in familiar areas, and there are not nearly enough housing vouchers available for all of those who want to move to higher-opportunity areas to afford to do so. But the unfortunate reality is that we know relatively little about what types of interventions are effective on a substantial scale at transforming extremely poor, disadvantaged neighborhoods.[33] Moreover, broader economic development and revitalization strategies often take many years to implement and can be costly.[34] Improving the HCV program’s performance in helping families live in better neighborhoods is a more attainable near-term goal. (See Figure 4.)
Create Strong Incentives for Housing Agencies to Achieve Better Location Outcomes
By creating strong incentives for local and state housing agencies to reduce the share of families using vouchers in extreme-poverty areas and increase the share of families living in high-opportunity areas, HUD can encourage the development of local policies and strategies that respond best to varying local conditions.
-
Give increased weight to location outcomes in measuring agency performance. HUD’s most powerful tool to induce state and local housing agencies to change their administrative practices is how it measures the effectiveness of agencies’ management of the HCV program. HUD should revise its measurement tool, called the Section 8 Management Assessment Program (SEMAP), which was first issued in 1998 and is largely unchanged, to give more significant weight to the types of neighborhoods in which voucher holders live. SEMAP scores are important to housing agencies because they can affect whether agencies qualify for additional HUD funds or administrative flexibility, and some local agencies take these scores into account in managers’ performance reviews and pay determinations. Agencies that perform particularly poorly on any single indicator or overall are subject to corrective action procedures, and they can lose their HCV contract with HUD if they do not remedy the problems.
Currently, less than 4 percent of the total points available under SEMAP are based on agencies’ use of administrative practices that “expand housing opportunities.” A similar number of bonus points are available to agencies in metropolitan areas that increase by at least 2 percent the share of HCV families with children living in “low-poverty” areas, but only a small share of agencies claim those bonus points.[35] In addition to revising the performance measure to give more weight to location outcomes, HUD also should refine the particular location measures it uses.[36]
To persuade more landlords in higher-opportunity areas to do business with them, agencies will also have to administer their voucher programs competently, such as by making prompt payments to owners and conducting inspections efficiently.[37] As a result, basing the measurement of agencies’ performance in significant part on their success in enabling more families to live in these areas also should encourage improved overall program management.
-
Reinforce performance measures by effectively implementing the new fair housing rule. All public housing agencies administering the HCV program (as well as HUD) have an affirmative obligation to further the purposes of the Fair Housing Act, known as the “AFFH” duty. In 2015, some 47 years after Congress established this obligation, HUD finally issued a rule to indicate what steps agencies must take to meet their AFFH obligation.[38] The rule requires public housing agencies as well as states and localities that receive HUD funds to identify the factors that primarily contribute to segregation and restriction of housing choice in their regions and programs, and to establish priorities and goals that will guide their planning and investment decisions. Grantees’ initial assessments of fair housing will be due over the next five to seven years.[39] The Administration significantly strengthened the provisions of the final rule in a number of respects, including clarifying its applicability to the HCV program, highlighting “enhancing mobility strategies” as a key type of action to include in grantees’ assessments of fair housing, and encouraging regional strategies. Effective implementation of the AFFH rule, including specification of the consequences of inadequate HCV-related actions by public housing agencies, would complement a revised and strengthened performance measurement system that emphasizes increasing access to higher-opportunity areas; black or Hispanic families make up most of the assisted families in extreme-poverty areas and are less likely than white assisted families to live in low-poverty areas.[40] It also could help PHAs receive assistance from other agencies in achieving these goals (see further discussion of this point below).
-
Pay agencies additional administrative fees when families use their vouchers in high-opportunity areas. A federal policy that financially rewards agencies when families use their vouchers in high-opportunity areas is particularly important in the case of families for which such moves can be especially challenging, such as families coming from communities that are highly segregated by income and race or ethnicity. HUD recently completed a major analysis of the costs of running a well-administered voucher program; based on that analysis, it plans to propose a new policy for determining how to allocate administrative fees to agencies. Location-based payments could be incorporated either as a component of the new formula or as a bonus or supplemental fee payment.[41]
Modify Policies That Discourage Families From Living in Lower-Poverty Communities
Many HCV program policies at both the federal and local levels — such as metropolitan-wide maximum rental subsidy levels and limits on the time to find a rental unit — unintentionally encourage families to use their vouchers in poor and often racially concentrated neighborhoods. Combined with effective enforcement of the final rule on PHAs’ obligation to affirmatively further fair housing, revising the federal policies as outlined below could encourage PHAs to adopt payment standards and search-time policies, and to maintain diverse landlord lists, that would facilitate families moving to higher-opportunity areas.
-
Set subsidy caps for smaller geographic areas. HCV rental subsidies are capped by a payment standard that the local housing agency sets, which generally can vary by only 10 percent from the Fair Market Rent (FMR) that HUD establishes based on the cost of modest housing over an entire metropolitan area. Payment standards based on metro-wide FMRs are often too low to rent units in neighborhoods with low poverty, low crime, and strong schools unless families pay out of pocket the extra rent above the payment standard — a difficult burden for many families that already must pay 30 percent of their limited incomes for rent.[42] At the same time, metropolitan FMRs often result in payment standards that are higher than necessary in areas of concentrated poverty, allowing families to rent larger units in those neighborhoods and potentially allowing owners to charge above-market rents (unless agencies strictly enforce rules requiring that rents be reasonable in the local market).[43] As a result, metropolitan-wide FMRs likely encourage the use of vouchers — and their acceptance by owners — in poor, unsafe neighborhoods with low-quality schools. [44]
Since 2001, HUD has set FMRs at the 50thpercentile of market rents, rather than the 40th percentile, in large metropolitan areas where voucher holders and affordable rental units are concentrated in a limited number of census tracts. The 50thpercentile FMR policy was intended to help voucher holders rent in a wider range of neighborhoods, but evidence suggests that it has not been effective, and that its main effect has been to raise costs without improving the quality of the housing where voucher holders live.[45] HUD is currently testing, through a limited number of local housing agencies, “Small Area Fair Market Rents” (SAFMRs), which are based on market rents in individual zip codes rather than rents over an entire metro area. Early results suggest that SAFMRs more adequately enable voucher holders to rent units in neighborhoods with better schools, more college graduates, and less violent crime, poverty, and unemployment — and do so without raising program costs.[46] By being more responsive to local price trends, SAFMRs also may help families rent better-quality units and remain in improving neighborhoods as rents rise. In June 2015, HUD announced plans to expand the use of SAFMRs to help families with Housing Choice Vouchers move to higher-opportunity areas.[47] HUD should move promptly to scale up the use of SAFMRs, starting by requiring their use in metropolitan areas where voucher holders are disproportionately concentrated in high-poverty neighborhoods.[48]
-
Provide voucher holders with information on units in high-opportunity neighborhoods. Many housing agencies influence families’ neighborhood choices through the lists they give families of landlords willing to rent to voucher holders. (HUD requires agencies to provide a list of willing landlords or other resources, such as online search tools, in the information packet they provide to new families that are issued vouchers.) But unless the agency makes an intentional and potentially time-consuming effort to solicit listings from landlords in lower-poverty areas, it is likely that many of the landlords who reach out to the agency will list units that are otherwise difficult for them to rent, particularly units in very poor neighborhoods where families often have trouble paying rent on time each month unless they have a rental subsidy.[49] HUD recently modified its rules to require housing agencies to ensure that such lists or other resources include units in areas “outside of poverty or minority concentration.”[50] This is a positive step. HUD guidance should encourage agencies to include units in low-poverty areas that don’t have a high concentration of voucher holders or other assisted housing.[51] To help “change the default” for families that come from segregated, high-poverty areas, HUD could require agencies to list most prominently the available units in high-opportunity areas.[52] Achieving compliance with the new requirement may depend on aggressive HUD monitoring, as well as efforts to get the major online search tools to meet the new standard.
-
Extend search periods when families need more time to find units in high-opportunity neighborhoods. Inflexible limitations on the amount of time that a family given a voucher has to find a unit meeting program requirements can also discourage families from searching for housing in neighborhoods that are harder for them to get to and/or where fewer landlords accept vouchers.[53] While federal rules require agencies to give households 60 days to lease a unit with their voucher, they permit (but do not require) agencies to allow additional time, except when families use “portability” procedures (see below).[54] HUD could provide more guidance or could modify its rule on the amount of additional time that families have to search with a voucher by requiring PHAs to extend the search time if a family requests an extension to find a unit in a low-poverty area. HUD should also consider requiring such extensions when minority families are seeking to move to an area where their race does not predominate. In these cases, this would “affirmatively further” fair housing.
Minimize Jurisdictional Barriers to Families’ Ability to Choose to Live in High-Opportunity Communities
HUD should modify the administrative geography of the HCV program to substantially reduce the extent to which agencies’ service areas (or “jurisdictions”) impede the program’s ability to promote access to higher-opportunity neighborhoods. In most metropolitan areas, one agency administers the HCV program in the central city and one or more different agencies serve suburban cities and towns. This pattern is the case in 96 of the 100 largest metro areas, where 70 percent of households in the HCV program lived in 2013. In 44 of the 100 largest metro areas, voucher administration is divided among ten or more agencies. This is the case even in mid-size areas such as Providence, Rhode Island, and Albany, New York, which have 38 and 36 agencies, respectively, administering the HCV program.[55]
Rental units in safe neighborhoods with good schools may be more plentiful in suburban areas than in the central cities, which are more likely to have higher-poverty neighborhoods with failing schools, but the balkanization of metro-area HCV programs among numerous agencies often impedes greater use of vouchers in the higher-opportunity areas.[56] Agency staff may be unfamiliar with housing opportunities outside of their jurisdiction and are unlikely to assist families to make such moves. Some landlords may be reluctant to do business with an unfamiliar housing agency.
Overcoming these administrative divisions is challenging, and the difficulties are exacerbated by cumbersome federal policies that make it more difficult for families coming from the central city or poor suburban areas to use their vouchers to lease housing in low-poverty suburban areas with better schools, as well as by financial disincentives for housing agencies to encourage such moves. HUD could substantially lessen these barriers by encouraging (or in limited circumstances requiring) agencies administering the HCV program in the same metro area to unify their voucher program operations, as well as by reducing the financial disincentives for agencies to promote the option to use vouchers in another agency’s jurisdiction.
- Encourage agencies to form consortia or consolidate. If PHAs in a metro area could at least form a consortium in which they each retain their local board but together have a single voucher funding contract with HUD, families would be able to use their vouchers to move seamlessly within the cities and towns in the consortium.[57] This change has taken on added importance now that HUD has declined to eliminate some of the key hurdles to families using their vouchers to rent housing in an area served by a different agency than the one that issued the voucher.[58] Under HUD’s current rules, however, agencies have little incentive to form consortia, and when they do, they still don’t have a single funding contract with HUD.[59] In July 2014, HUD proposed to revise its consortia rule to allow all HCV agencies in a consortium to have a single funding contract with HUD.[60] HUD should finalize this policy change promptly and include funds to assist agencies in forming consortia in its budget.
- Strengthen HUD’s performance assessment tools and its use of certain remedies in response to poor performance. HUD has the authority to require consolidation when an agency is not administering the HCV program effectively, even if a state or local law limits the geographic area of agency operation.[61]
- Reduce financial disincentives for agencies to promote “portability” moves. When a family uses a voucher in a different jurisdiction than the one that issued the voucher, both agencies involved usually receive lower fees (due to the requirement to split the administrative payments) and typically incur higher costs (due to the transfer of paperwork and funds between the agencies).[62] HUD recently made modest changes in the “portability” procedures that likely will reduce some of the added costs for PHAs. But agencies likely will continue to lose financially when families move to another jurisdiction, creating disincentives for agencies to encourage such moves. HUD’s revised administrative fee policy should remove the financial disincentives for agencies to continually make families aware of their right to use their vouchers in another agency’s jurisdiction, and for agencies in higher-opportunity areas to welcome families and assist them in finding new homes.[63]
Assist Families in Using Vouchers in High-Opportunity Areas
The various policy changes described above, which are within the control of HUD and the state and local housing agencies that administer the HCV program, would likely make a significant difference in expanding families’ ability to use vouchers to access safer neighborhoods that provide better opportunities. But additional help may be needed from state and local governments and private funding sources to overcome some of the most serious barriers to families using their vouchers to access high-opportunity neighborhoods.[64] This is most likely to be the case in areas where efforts to recruit landlords in such neighborhoods to participate in the program are unsuccessful or where too few rental options exist. In addition, experience from a number of local housing mobility programs indicates that more black and Hispanic families will succeed in moving from low-income, racially segregated areas to high-opportunity, predominantly white neighborhoods if they receive intensive assistance.[65] Key strategies include the following initiatives:
-
State and local governments should adopt policies to encourage landlords in low-poverty areas to accept housing vouchers. For example, to encourage more landlords in low-poverty areas to rent to families with housing vouchers, Illinois enacted a property tax abatement in 2003 for landlords that rent units in low-poverty areas within prosperous communities to voucher holders.[66] States also could encourage developers to build in high-opportunity communities with a scarcity of moderately priced rental housing and to rent a share of the units to voucher holders, by giving such properties extra points in the highly competitive process to receive Low-Income Housing Tax Credit (LIHTC) awards.[67] (See box, below, for more examples of how LIHTC policy could increase the availability of high-opportunity housing choices for voucher holders.)
-
Enact state or local laws prohibiting discrimination against voucher holders. Such laws may make more rentals in lower-poverty and less racially segregated neighborhoods available to voucher holders. Thirteen states and numerous cities and counties have enacted such laws, usually as part of legislation that also prohibits landlords from discriminating against people who rely on TANF or Supplemental Security Income benefits to pay the rent. Recent studies found that such laws increased the percentage of people who successfully lease a unit with a voucher by between 5 and 12 percentage points and made a modest improvement in location outcomes compared with adjacent areas without an anti-discrimination law.[68]
-
Provide mobility counseling to help families move to and remain in high-opportunity neighborhoods. There have been efforts in some metro areas to provide intensive “mobility counseling” to families that want to move to lower-poverty neighborhoods.[69] (Some of these programs originated from fair housing lawsuits and require that destination neighborhoods be predominantly white.) Programs in the Baltimore and Dallas areas have reported significant success in moving substantial numbers of families to much lower-poverty, predominantly non-minority communities.
These initiatives provide families with assistance in locating available units, higher rental subsidy levels, payments for security deposits and other moving costs, and counseling to help them adjust to such neighborhoods. They provide similar services to families for at least one subsequent move to help them remain in designated opportunity areas.[70] These programs operate on a regional basis covering at least the central city and many suburban areas, thereby avoiding the barriers created by separate agency service areas.[71]
It appears that a larger share of families that have moved to high-opportunity areas as a result of these initiatives have chosen to remain in lower-poverty, racially integrated neighborhoods than was the case for families that participated in HUD’s Moving to Opportunity (MTO) demonstration. In a Baltimore program that includes mobility counseling, for example, the average poverty rate for the neighborhoods in which the families whom the program aided lived over the ten years following their initial move was 14.6 percent, compared with 30.2 percent pre-move. In contrast, the comparable average neighborhood poverty rate over a ten-year period for MTO families that initially moved to low-poverty areas, weighted based on the length of families’ residence, was 21 percent.[72]
Qualitative research on a sample of families that moved to suburban areas through the Baltimore program highlights the change in families’ location-related priorities after they moved, including placing a higher value on high-quality schools.[73] Longer stays in low-poverty neighborhoods are associated with improved educational results for children and better employment results for mothers, and better outcomes for adults who moved to low-poverty neighborhoods as young children.[74]
Unfortunately, there has been no rigorous evaluation of the impact or cost-benefit ratio of particular features of mobility-promoting programs.[75] One study now underway in the Chicago area is testing the impact of mobility counseling coupled with a $500 incentive payment if a family moves to a designated opportunity area, compared to just the incentive payment and to neither intensive services nor an incentive, with results due in 2015.[76] It is important to learn more about what types of incentives and services have the greatest effect under varying local conditions. HUD should encourage such knowledge-building, and could include funding in its 2017 budget request for a federal pilot to support and evaluate state and local housing mobility assistance programs.
In addition, if recent federal underfunding of housing agencies’ costs of administering the HCV program continues, agencies will likely need supplemental funds if they are to provide meaningful mobility counseling services. Some HUD funds that go to states and localities, including Community Development Block Grant funds, as well as limited federal housing counseling and fair housing funds that are available on a competitive basis to non-profit agencies, could be used for this purpose.[77] States and localities also could use other funds they control to assist housing agencies in providing these services. Philanthropy (through such mechanisms as community foundations) also could play a significant role in helping to provide initial funding for mobility programs and in supporting the research necessary to build knowledge about the most cost-effective strategies. The results of such research might also help agencies obtain subsequent funding from state or local governments by providing a greater knowledge base on what works and is most cost efficient.
- Expand access to cars to help families use vouchers in low-poverty areas. Access to a functional car or having a driver’s license appears to help families use vouchers in low-poverty, safer neighborhoods initially and for longer periods of time. Cars make the search for housing easier, particularly in neighborhoods not well served by efficient public transit. Having a car also facilitates access to jobs — either in the old neighborhood or near the new one — and makes it easier to maintain connections to social networks in families’ former neighborhoods. For all of these reasons, families with reliable access to cars may be more willing and able to use housing vouchers to move to and remain in low-poverty neighborhoods. Programs to help families own cars or use short-term rental car services that are targeted specifically on families with housing vouchers, or that help low-income families generally, could be a useful adjunct to the housing-focused policies discussed in this article.[78]
Low-Income Housing Tax Credit Could Do More to Provide Access to High-Opportunity Areas
The Low-Income Housing Tax Credit (LIHTC), the nation’s main program to develop affordable housing, is a potentially powerful tool to provide poor families access to high-opportunity areas. But LIHTC has performed inadequately in this respect. On average, LIHTC units large enough for families with children are near schools that score at the 31st percentile on standardized tests.a This is better than the average for schools near the homes of poor families or voucher holders with children, but leaves much room for improvement, given that the majority of LIHTC residents (in states with available data) have incomes above the poverty line.b (Families are eligible for LIHTC units if their income is below 60 percent of the median income for the area, which is about 200 percent of the federal poverty line.)
While some of the state agencies that allocate LIHTC credits encourage development in high-opportunity areas, states could do substantially more. For example, states can establish selection preferences for projects in low-poverty areas or near high-performing schools and can limit preferences for high-poverty areas to those where a comprehensive revitalization effort is underway. States can also eliminate barriers to using LIHTC in high-opportunity areas, such as rigid cost caps that block projects when land costs are high (as well as requirements that local officials or state legislators approve the award of credits to build a property in a particular location).c
The federal government should ensure that non-discrimination requirements — including the obligation of recipients of federal funds to “affirmatively further” fair housing and the obligation of LIHTC properties not to discriminate against families with Housing Choice Vouchers — are applied to LIHTC and strictly enforced. HUD can also influence the location of LIHTC developments through its authority to designate Difficult Development Areas (DDAs), areas with high land and construction costs where projects are eligible for added credits. Today, HUD designates a small number of metropolitan areas as DDAs, including both low- and high-cost neighborhoods within those areas. But beginning in 2016, HUD will set DDAs at the zip code level, a promising measure that will provide added credits in high-cost (and often high-opportunity) neighborhoods in most major metropolitan areas.
HUD and state agencies also should move promptly to make data on the income, race, and family composition of tenants in each LIHTC development available so policymakers and the public can better assess LIHTC’s effectiveness in furthering key goals, including providing poor families with children access to high-opportunity neighborhoods. There are no national data available on the families assisted by LIHTC, a striking omission for a low-income program that has operated for 27 years and helps develop about 100,000 units each year. In 2008, Congress directed state agencies to submit data on LIHTC tenants and HUD to publish the data annually. HUD and state agencies have worked to develop a data collection system but have only released partial data.
a Ellen & Horn (2012).
b Hollar (2014).
c Khadduri (2013b).
Conclusion
An expanding body of evidence suggests that children benefit from living in safe, low-poverty neighborhoods with good schools, while growing up in extremely poor neighborhoods with low-performing schools and high levels of crime and violence can undermine their development and well-being over the short and long terms. Yet, the Housing Choice Voucher program – the largest federal rental assistance program – does not fulfill its potential to help low-income families avoid high-poverty neighborhoods and access healthier communities with better opportunities.
Federal, state, and local policymakers and program administrators can make substantial progress in the next few years toward the goal of improving opportunities for assisted families, by making four interrelated sets of policy changes that will help more families in the Housing Choice Voucher program to live in better locations.
Technical Appendix
| TABLE A-1 | ||||||||
|---|---|---|---|---|---|---|---|---|
| Where Assisted Families with Children Live by Neighborhood Poverty | ||||||||
| Housing Choice Vouchers | Public Housing | Project-Based Section 8 |
Total | |||||
| Census Tract Poverty | Number | Percent | Number | Percent | Number | Percent | Number | Percent |
| Less than 10% | 136,369 | 13.8% | 15,475 | 4.0% | 20,286 | 6.2% | 172,130 | 10.1% |
| 10%-19.9% | 278,907 | 28.3% | 59,230 | 15.2% | 71,630 | 21.8% | 409,767 | 24.0% |
| 20-29.9% | 253,655 | 25.7% | 80,515 | 20.7% | 80,584 | 24.5% | 414,754 | 24.3% |
| 30-39.9% | 179,579 | 18.2% | 88,719 | 22.8% | 68,091 | 20.7% | 336,389 | 19.7% |
| 40% or higher | 137,993 | 14.0% | 145,837 | 37.4% | 87,730 | 26.7% | 371,560 | 21.8% |
| Median poverty rate | 22.8% | 34.2% | 28.8% | 26.3% | ||||
| Total | 986,503 | 389,776 | 328,321 | 1,704,600 | ||||
| TABLE A-2 | ||||||
|---|---|---|---|---|---|---|
| Race/Ethnicity of Assisted Families with Children By Program and Neighborhood Poverty | ||||||
| Neighborhood Poverty | Program | All Families | Black | Hispanic | White | All Other |
| All Neighborhoods | Vouchers | 993,189 | 57.0% | 16.1% | 23.3% | 3.5% |
| Public Housing | 389,946 | 54.9% | 21.7% | 19.8% | 3.7% | |
| PBRA | 320,518 | 53.3% | 17.3% | 25.4% | 3.9% | |
| Low-Poverty Neighborhoods | Vouchers | 136,306 | 47.8% | 14.8% | 32.6% | 4.7% |
| Public Housing | 15,454 | 38.7% | 17.8% | 36.7% | 6.8% | |
| PBRA | 19,564 | 32.3% | 14.6% | 47.3% | 5.8% | |
| Extreme-Poverty Neighborhoods | Vouchers | 137,924 | 66.8% | 16.3% | 14.6% | 2.2% |
| Public Housing | 145,749 | 66.4% | 23.0% | 7.6% | 3.0% | |
| PBRA | 85,885 | 71.7% | 17.3% | 8.2% | 2.8% | |
| TABLE A-3 | ||||||||||
|---|---|---|---|---|---|---|---|---|---|---|
| Where Poor Children Using Vouchers Live by Neighborhood Poverty and Race/Ethnicity | ||||||||||
| Census Tract Poverty | All | Black | Hispanic | White | Other Races | |||||
| Number | Percent | Number | Percent | Number | Percent | Number | Percent | Number | Percent | |
| Less than 10% | 206,383 | 11.6% | 101,902 | 10.0% | 30,140 | 10.6% | 64,184 | 15.5% | 10,040 | 16.3% |
| 10%-19.9% | 478,930 | 26.8% | 250,753 | 24.5% | 73,542 | 25.9% | 134,270 | 32.4% | 20,026 | 32.5% |
| 20-29.9% | 450,198 | 25.2% | 259,571 | 25.4% | 76,581 | 26.9% | 98,432 | 23.7% | 15,341 | 24.9% |
| 30-39.9% | 352,528 | 19.7% | 224,839 | 22.0% | 58,409 | 20.5% | 58,964 | 14.2% | 10,119 | 16.4% |
| 40% or higher | 297,308 | 16.7% | 186,674 | 18.2% | 45,618 | 16.0% | 58,783 | 14.2% | 6,060 | 9.8% |
| Median poverty rate | 24.3% | 25.9% | 24.9% | 20.6% | 20.4% | |||||
| Total | 1,785,347 | 1,023,739 | 284,290 | 414,633 | 61,586 | |||||
| TABLE A-4 | ||||||||||
|---|---|---|---|---|---|---|---|---|---|---|
| Where Poor Children Live by Neighborhood Poverty and Race/Ethnicity | ||||||||||
| Census Tract Poverty | All Poor Children | Black | Hispanic | White | Other Races | |||||
| Number | Percent | Number | Percent | Number | Percent | Number | Percent | Number | Percent | |
| Less than 10% | 1,757,373 | 10.7% | 200,415 | 5.0% | 367,134 | 6.0% | 988,388 | 19.6% | 115,023 | 15.6% |
| 10%-19.9% | 4,569,582 | 27.9% | 767,757 | 19.1% | 1,353,887 | 22.1% | 2,049,366 | 40.7% | 210,701 | 28.5% |
| 20-29.9% | 4,139,102 | 25.3% | 981,985 | 24.4% | 1,652,119 | 27.0% | 1,220,592 | 24.2% | 167,207 | 22.6% |
| 30-39.9% | 2,973,458 | 18.2% | 958,481 | 23.8% | 1,331,377 | 21.7% | 491,568 | 9.8% | 134,375 | 18.2% |
| 40% or higher | 2,941,491 | 18.0% | 1,110,389 | 27.6% | 1,418,345 | 23.2% | 288,141 | 5.7% | 111,122 | 15.0% |
| Median poverty rate | 24.3% | 30.4% | 28.0% | 17.2% | 26.6% | |||||
| Total | 16,381,006 | 4,019,027 | 6,122,862 | 5,038,055 | 738,428 | |||||
Data Sources and Methodology
Assisted Households
This analysis uses a non-public dataset from U.S. Department of Housing and Urban Development’s Office of Policy Development and Research (available through a research agreement) to analyze demographic characteristics of households that participated in the Section 8 Housing Choice Voucher (HCV), Public Housing, and Section 8 Project-Based Rental Assistance (PBRA) programs during calendar year 2014. HUD collects demographic information on recipients through Form 50058, Form 50059, and the Tenant Rental Assistance Certification System. Our analysis excludes households located in U.S. territories. It also excludes about 4,000 units that house families with children under other HUD programs.
Households with Children
The HUD administrative data report the presence and number of minor children in each household using rental assistance. We considered a household to have children if there was at least one household member under the age of 18, regardless of their relationship to the household head. We identified 1.7 million assisted households with 3.65 million minor children in the three major rental assistance programs.
Race and Ethnicity
We categorized assisted households using the head of household’s race and ethnicity. Due to data limitations, we assumed children in the household were the same race or ethnicity as the household head. The black and white racial categories exclude household heads who identify as Hispanic ethnicity; consequently, the Hispanic category may contain household heads of any race. Our analysis excludes 9,110 households with children missing race and ethnicity data. Two-thirds of these households were in the PBRA program.
Neighborhood Poverty
We used Census tract data to determine whether a child or assisted household lived in a neighborhood of concentrated poverty. We assumed that Census tract boundaries are roughly equivalent to actual neighborhood boundaries. Poverty rate data by Census tract is available from the U.S. Census Bureau’s American Community Survey (ACS). We used 2010-2014 ACS estimates from Table S1701, Poverty Status in the Last 12 Months, available from http://factfinder2.census.gov. We consider a neighborhood “low poverty” if less than 10 percent of the people living in that Census tract have incomes below the poverty line. We consider a neighborhood “extreme poverty” if 40 percent or more of the people living in that Census tract have incomes below the poverty line.
We determined the neighborhood poverty concentration for assisted households with children; poor assisted households with children; and all children living in poverty. We used 2014 HUD administrative data to determine the Census tract number of each assisted family with children in the three major rental programs and 2010-2014 ACS estimates from Table B17001, “Poverty Status in the Last 12 Months By Sex and Age,” to determine the number of poor children in each Census tract (excluding U.S. territories). To determine whether an assisted household or poor child lived in concentrated poverty, we matched each household’s tract number to their Census tract’s poverty rate reported in the ACS data. We compare poor assisted households with children to all children in poverty because it is not possible to identify poor children without housing assistance in the ACS data.
References
Abravanel, M.D., Pindus, N.M., & Theodos, B. (2010). Evaluating community and economic development programs. Washington, D.C.: Urban Institute. http://www.urban.org/UploadedPDF/412271-New-Markets-Tax-Credit-Program.pdf
American Academy of Pediatrics. (2012). Early childhood adversity, toxic stress and the role of the pediatrician: Translating developmental science into lifelong health. http://cirge.stanford.edu/Papers/2012/Garner/PEDIATRICS%202012%20Garner.pdf
Basolo, V. (2003). Local response to federal changes in the Housing Voucher Program: A case study of intraregional cooperation. Housing Policy Debate, 14(1), 143–68.
Berube, A. (2008). Concentrated poverty in America: An overview. In D. Erickson, C. Reid, L. Nelson, A. O’Shaughnessy, & A. Berube (Eds.) The Enduring Challenge of Concentrated Poverty in America (3-15). Washington, D.C.: Federal Reserve System and Brookings Institution. http://www.frbsf.org/community-development/files/cp_fullreport.pdf
Bipartisan Policy Center. (2013). Housing America’s future: New directions for national policy. Washington, D.C.: Bipartisan Policy Center. http://bipartisanpolicy.org/library/housing-americas-future-new-directions-national-policy/
Bostic, R. W. (2014). CDBG at 40: Opportunities and Obstacles. Housing Policy Debate, 24(1), 297-302.
Briggs, X. (2005a). The geography of opportunity: Race and housing choice in metropolitan America. Washington, D.C.: Brookings Institution Press.
Briggs, X. (2005b). More Pluribus, Less Unum? The changing geography of race and opportunity. In X. Briggs (Ed.) The geography of opportunity: Race and housing choice in metropolitan America (63-87). Washington, D.C.: Brookings Institution Press.
Briggs, X., Comey, J., & Weismann, G. (2010). Struggling to stay out of high-poverty neighborhoods: housing choice and locations in Moving to Opportunity’s first decade. Housing Policy Debate, 20(3), 383-427.
Briggs, X., Popkin, S. J., & Goering, J. (2010). Moving to Opportunity: The story of an American experiment to fight ghetto poverty. New York: Oxford University Press.
Burdick-Will, J., Ludwig, J., Raudenbush, S. W., Sampson, R. J., Sanbonmatsu, L., & Sharkey, P. (2011). Converging evidence for neighborhood effects on children’s test scores: An experimental, quasi-experimental, and observational comparison. In G.J. Duncan & R.J. Murnane (Eds.) Whither Opportunity: Rising Inequality, Schools, and Children’s Life Chances (255-276). New York: Russell Sage Foundation.
Center on Budget and Policy Priorities. (2015). Policy Basics: The Housing Choice Voucher Program. Washington, D.C.: Center on Budget and Policy Priorities. https://www.cbpp.org/files/PolicyBasics-housing-1-25-13vouch.pdf
Centers for Disease Control and Prevention. (2014). Child maltreatment: risk and protective factors. http://www.cdc.gov/violenceprevention/childmaltreatment/riskprotectivefactors.html
Chetty, R., & Hendren, N. (2015). The Impacts of Neighborhoods on Intergenerational Mobility: Childhood Exposure Effects and County-Level Estimates. Cambridge, M.A.: Harvard University and National Bureau of Economic Research. http://www.equality-of-opportunity.org/images/nbhds_paper.pdf
Chetty, R., Hendren, N., & Katz, L.F. (2015). The Effects of Exposure to Better Neighborhoods on Children: New Evidence from the Moving to Opportunity Experiment. Cambridge, M.A.: Harvard University and National Bureau of Economic Research. http://www.equality-of-opportunity.org/images/mto_paper.pdf
Collinson, R., & Ganong, P. (2013). Incidence and price discrimination: Evidence from housing vouchers. Social Science Research Network, 2255799. http://papers.ssrn.com/sol3/papers.cfm?abstract_id=2255799
Collingson, R., & Ganong, P. (2015). The Incidence of Housing Voucher Generosity. Social Science Research Network, 2255799. http://papers.ssrn.com/sol3/Papers.cfm?abstract_id=2255799
Comey, J., Briggs, X.D.S., & Weismann, G. (2008). Struggling to stay out of high-poverty neighborhoods: Lessons from the moving to opportunity experiment. Washington, D.C.: Urban Institute. http://www.urban.org/UploadedPDF/411635_high-poverty_neighborhoods.pdf
Covington, K., Freeman, L., & Stoll, M. (2011). The suburbanization of housing choice voucher recipients. Washington, D.C.: Brookings Institution. http://164.67.163.139/Documents/areas/ctr/ziman/2012-13WP.pdf
Cunningham, M., Scott, M., Narducci, C., Hall, S., Stanczyk, A., O’Neil, J. & Galvez, M. (2010). Improving neighborhood location outcomes in the Housing Choice Voucher Program: A scan of the mobility assistance programs. What Works Collaborative. http://www.urban.org/UploadedPDF/412230-Improving-Neighborhood-Location.pdf
Darrah, J., & DeLuca, S. (2014). “Living here has changed my whole perspective”: How escaping inner‐city poverty shapes neighborhood and housing choice. Journal of Policy Analysis and Management, 33(2), 350-384.
DeLuca, S., & Dayton, E. (2009). Switching Social Contexts: The Effects of Housing Mobility and School Choice Programs on Youth Outcomes. Annual Review of Sociology, 35, 457–491.
DeLuca, S., Duncan, G. J., Keels, M., & Mendenhall, R. (2012). The notable and the null: Using mixed methods to understand the diverse impacts of residential mobility programs. In M. van Ham, D. Manley, N. Bailey, L. Simpson & D. Maclennan (Eds.) Neighbourhood Effects Research: New Perspectives (195-223). Netherlands: Springer.
DeLuca, S., Garboden, P. M., & Rosenblatt, P. (2013). Segregating shelter: How housing policies shape the residential locations of low-income minority families. The ANNALS of the American Academy of Political and Social Science, 647(1), 268-299.
DeLuca, S. & Rosenblatt, P. (2011). Increasing access to high performing schools in the assisted housing voucher program. In P. Tegeler (Ed.) Finding Common Ground: Coordinating Housing and Education Policy. Washington, D.C.: Poverty and Race Action Council. http://prrac.org/pdf/HousingEducationReport-October2011.pdf
DeLuca, S. & Rosenblatt, P. (2013). Sandtown-Winchester – Baltimore’s daring experiment in urban renewal: 20 years later, what are the lessons learned? The Abell Report, 26(8), 1-12. http://www.abell.org/sites/default/files/publications/arn1113.pdf
Edin, K., DeLuca, S., & Owens, A. (2012). Constrained compliance: Solving the puzzle of MTO’s lease-up rates and why mobility matters. Cityscape 14(2), 181-194.
Ellen, I.G., & Horn, K.M. (2012). Do federally assisted households have access to high performing public schools? Washington, D.C.: Poverty & Race Research Action Council. http://files.eric.ed.gov/fulltext/ED538399.pdf
Ellen, I.G., & Turner, M.A. (1997). Does Neighborhood Matter? Assessing Recent Evidence. Housing Policy Debate 8(4), 833-866.
Engdahl, L. (2009). New homes, new neighborhoods, new schools: A progress report on the Baltimore Housing Mobility Program. Poverty and Race Research Action Council. http://www.prrac.org/pdf/BaltimoreMobilityReport.pdf
Fischer, W. (2015a). Research shows housing vouchers reduce hardship and provide platform for long-term gains among children. Washington, D.C.: Center on Budget and Policy Priorities. https://www.cbpp.org/files/3-10-14hous.pdf
Fischer, W. (2015b). Neighborhood-Based Subsidy Caps Can Make Housing Vouchers More Efficient and Effective. Washington, D.C.: Center on Budget and Policy Priorities. https://www.cbpp.org/sites/default/files/atoms/files/6-10-15hous.pdf
Fischer, W. (2015c). Streamlining Federal Assistance: Testimony of Will Fischer, Senior Policy Analyst, Before the House Financial Services Subcommittee on Housing and Insurance. Washington, D.C.: Center on Budget and Policy Priorities. https://www.cbpp.org/housing/streamlining-federal-rental-assistance
Freeman, L. (2012). The impact of source of income laws on voucher utilization. Housing Policy Debate, 22(2), 297-318.
Freeman, L. & Li, Y. (2014). Do Source of Income (SOI) Anti-Discrimination Laws Facilitate Access to Better Neighborhoods? Housing Studies, 29(1), 88-107.
Galster, G.C. (2013). US assisted housing programs and poverty deconcentration: A critical geographic review. In D. Manley, M. van Ham, N. Bailey, L. Simpson, & D. Maclennan (Eds.) Neighbourhood Effects or Neighbourhood Based Problems? (215-249). Netherlands: Springer.
Galvez, M.M. (2010). Do we know about Housing Choice Voucher Program location outcomes? A recent review of the literature. What Works Collaborative. Washington D.C.: Urban Institute. http://www.urban.org/UploadedPDF/412218-housing-choice-voucher.pdf
Gubits, D.B., Khadduri, J., & Turnham, J. (2009). Housing patterns of low income families with children: Further analysis of data from the study of the effects of housing vouchers on welfare families. Joint Center for Housing Studies. Cambridge, MA: Harvard University. http://www.jchs.harvard.edu/sites/jchs.harvard.edu/files/w09-7.pdf
Hollar, M. (2014). Understanding Whom the LIHTC Program Serves: Tenants in LIHTC Units as of December 31, 2012. Washington, D.C.: HUD Office of Policy Development. http://www.huduser.org/portal/publications/hsgfin/understanding_LIHTC.html
Inclusive Communities Project. (2013). Mobility Works. Inclusive Communities Project. http://www.inclusivecommunities.net/MobilityWorks.pdf
Jargowsky, P.A. (2015). “Architecture of Segregation: Civil Unrest, the Concentration of Poverty, and Public Policy,” The Century Foundation, http://apps.tcf.org/architecture-of-segregation.
Jargowsky, P.A., & El Komi, M. (2009). Before or after the bell? School context and neighborhood effects on student achievement. Neighborhood and life chances: how place matters in modern America, 50-72. http://www.urban.org/uploadedpdf/1001430-student-achievement.pdf
Jencks, C. & Mayer, S.E. (1990). The Social Consequences of Growing Up in a Poor Neighborhood. In L.E. Lynn, Jr. and M. McGeary (Eds.) Inner City Poverty in the United States (111-118). Washington, D.C.: National Academy Press.
Katz, B. & Turner, M. (2013). Invest but reform: Streamline administration of Housing Choice Voucher Program. Washington, D.C.: Brookings Institution. http://www.brookings.edu/research/papers/2013/09/30-housing-choice-voucher-katz-turner
Kawachi, I. & Berkman, L.F. (2003). Neighborhoods and Health. New York City: Oxford University Press.
Khadduri, J. (2013a). Commentary: Crime as a dimension of neighborhood quality. Cityscape, 15(3), 159-163.
Khadduri, J. (2013b). Creating balance in the location of LIHTC developments: The role of qualified allocation plans. Washington, D.C.: Poverty & Race Research Action Council and Abt Associates Inc., pp. 1-27. http://www.prrac.org/pdf/Balance_in_the_Locations_of_LIHTC_Developments.pdf
Kubisch, A.C. (2010). Structures, strategies, action and results from community change efforts. In A.C. Kubisch, P. Asupos, P. Brown & T. Dewar (Eds.), Voices from the Field III: Lessons and Challenges from Two Decades of Community Change Efforts (15-50). Washington, D.C.: Aspen Institute. http://www.aspeninstitute.org/sites/default/files/content/docs/pubs/VoicesIII_FINAL_0.pdf
Ludwig, J. (2012). Guest Editor’s Introduction. Cityscape, 14(2), pp. 1-28. http://www.huduser.org/portal/periodicals/cityscpe/vol14num2/Cityscape_July2012_guest_introduction.pdf
Ludwig, J., Duncan, G.J., Gennetian L.A., Katz L.F., Kessler, R.C., Kling, J.R., & Sanbonmatsu, L. (2013). Long-term neighborhood effects on low-income families: Evidence from moving to opportunity. The American Economic Review 103(3), 226-231.
Massey, D.S., Albright, L., & Casciano, R. (2013). Climbing Mount Laurel: The Struggle for Affordable Housing and Social Mobility in an American Suburb. Princeton, N.J.: Princeton University Press.
McClure, K. (2013). Which metropolitan areas work best for poverty deconcentration with Housing Choice Vouchers? Cityscape, 15(3), 209-236.
McClure, K., Schwartz, A.F., & Taghavi, L.B. (2014). Housing Choice Voucher location patterns a decade later. Housing Policy Debate. DOI: 10.1080/10511482.2014.921223 http://dx.doi.org/10.1080/10511482.2014.921223
Metzger, M.W. (2014). The reconcentration of poverty: Patterns of housing voucher use, 2000 to 2008. Housing Policy Debate. DOI: 10.1080/10511482.2013.876437 http://dx.doi.org/10.1080/10511482.2013.876437
Mickelson, R.A. (2011). Exploring the school-housing nexus: A synthesis of social science evidence. In P.T. Tegeler (Ed.) Finding Common Ground: Coordinating Housing and Education Policy to Promote Integration. Washington, D.C.: Poverty and Race Research Action Council. http://prrac.org/pdf/HousingEducationReport-October2011.pdf
Mills, G., Gubits, D., Orr, L., Long, D., Feins, J., Kaul, B., & Wood, M. (2006). Effects of housing vouchers on welfare families. Report prepared for U.S. Department of Housing and Urban Development.
National Scientific Council on the Developing Child. (2009). Maternal depression can undermine the development of young children. http://developingchild.harvard.edu/index.php/download_file/-/view/582/
National Scientific Council on the Developing Child (2010). Persistent fear and anxiety can affect young children’s learning and development. http://developingchild.harvard.edu/index.php/download_file/-/view/622/
National Scientific Council on the Developing Child (2014). Excessive stress disrupts the architecture of the developing brain. http://developingchild.harvard.edu/index.php/download_file/-/view/469/
O’Neil, J.L. (2009). Housing mobility counseling: What’s missing? In M.A. Turner, S.J. Popkin, & L. Rawlings (Eds.) Public Housing and a Legacy of Segregation (115-125). Washington, D.C.: Urban Institute.
Pendall, R., Hayes, C., George, A., McDade, Z., Dawkins, C., Jeon, J.S., Knapp, E., Blumenberg, E. Pierce, G., & Smart, M. (2014). Driving to opportunity: Understanding the links among transportation access, residential outcomes, and economic opportunity for housing voucher recipients. Washington, D.C.: Urban Institute. http://www.urban.org/UploadedPDF/413078-Driving-to-Opportunity.pdf
Pendall, R., Hayes, C., George, A., McDade, Z., Dawkins, C., Jeon, J.S., Knapp, E., Blumenberg, E. Pierce, G., & Smart, M. (2015). Driving to Opportunities: Voucher Users, Cars, and Movement to Sustainable Neighborhoods. Cityscape 17(2). 57-87. http://www.huduser.gov/periodicals/cityscpe/vol17num2/ch2.pdf
Popkin, S.J. & Cunningham, M. (2009). Has HOPE VI transformed residents’ lives? In H.G. Cisneros & L. Enddohls (Eds.) From Despair to Hope: HOPE VI and the New Promise of Public Housing in America’s Cities (191-204). Washington, D.C.: Brookings Institution Press. http://www.huduser.org/publications/pdf/hsgvouchers_1_2011.pdf
Poverty and Race Research Action Council. (2015). Constraining Choice: The Role of Online Apartment Listing Services in the Housing Choice Voucher Program. Washington, D.C.: Poverty and Race Research Action Council. http://prrac.org/pdf/ConstrainingChoice.pdf
Rosen, E. (2014). Selection, matching, and the rules of the game: Landlords and the geographic sorting of low-income renters. Joint Center for Housing Studies. http://www.jchs.harvard.edu/sites/jchs.harvard.edu/files/w14-11_rosen_0.pdf
Rosenbaum, J.E. (1995). Changing the Geography of Opportunity by Expanding Residential Choice: Lessons from the Gautreaux Program. Housing Policy Debate 6(1), 231-269.
Rosenbaum, J.E., & Zuberi, A. (2010). Comparing residential mobility programs: design elements, neighborhood placements, and outcomes in MTO and Gautreaux. Housing Policy Debate, 20(1), 27-41.
Sard, B., & Rice, D. (2014). Creating Opportunity for Children: How Housing Location Can Make a Difference. Washington, D.C.: Center on Budget and Policy Priorities. https://www.cbpp.org/research/creating-opportunity-for-children.
Sampson, R.J. (2012). Great American City: Chicago and the Enduring Neighborhood Effect. Chicago: University of Chicago Press.
Sampson, R.J., Morenoff, J.D., & Gannon-Rowley, T. (2002). Assessing “Neighborhood Effects”: Social Processes and New Directions in Research. Annual Review of Sociology, (28), 443-478.
Sampson, R.J., Raudenbush, S., & Earls, F. (1997). Neighborhoods and Violent Crime: A Multilevel Study of Collective Efficacy, Science, 277, 918-924.
Sampson, R.J., Sharkey, P., & Raudenbusch, S.W. (2008). Durable effects of concentrated disadvantage on verbal ability among African-American children. Proceedings of the National Academy of Sciences, 105(3), 845-852.
Schwartz, H. (2012). Housing policy is school policy: Economically integrative housing promotes academic success in Montgomery County, Maryland, in R.D. Kahlenberg (Ed.), The Future of School Integration (New York City: The Century Foundation).
Scott, M.M., Cunningham, M., Biess, J., O’Neil, J.L., Tegeler, P., Gayles, E., & Sard, B. (2013). Expanding Choice: Practical Strategies for Building a Successful Housing Mobility Program. Washington D.C.: Urban Institute and Poverty & Race Research Action Council. http://www.urban.org/UploadedPDF/412745-Expanding-Choice.pdf
Sharkey, P. (2013). Stuck in Place: Urban Neighborhoods and the End of Progress toward Racial Equality. Chicago: University of Chicago Press.
Sharkey, P.T., Tirado-Strayer, N., Papachristos, A.V., & Raver, C.C. (2012). The effect of local violence on children’s attention and impulse control. American Journal of Public Health, 102(12), 2287-2293.
Sharkey, P., Schwartz, A.E., Ellen, I.G., & Lacoe, J. (2014). High stakes in the classroom, high stakes on the street: The effects of community violence on students’ standardized test performance. Sociological Science, 1, 199-220.
Shonkoff, J.P., Boyce, W.T., & McEwen, B.S. (2009). Neuroscience, molecular biology, and the childhood roots of health disparities: building a new framework for health promotion and disease prevention. JAMA, 301(21), 2252-2259. http://www.brooklyn.cuny.edu/pub/departments/childrensstudies/conference/pdf/Shonkoff-Boyce-McEwen_JAMA.pdf
Shonkoff, J.P., Garner, A.S., Siegel, B.S., Dobbins, M.I., Earls, M.F., McGuinn, L., ... & Wood, D. L. (2012). The lifelong effects of early childhood adversity and toxic stress. Pediatrics, 129(1), 232-246. http://pediatrics.aappublications.org/content/129/1/e232.full.pdf
Thaler, R. & Sunstein, C. (2008). Nudge: Improving decisions about health, wealth, and happiness. New Haven: Yale University Press.
Turner, M.A., Edelman, P., Poethig, E., Aron, L. (2014). Tackling persistent poverty in distressed urban neighborhoods: History principles, and strategies for philanthropic investment. Washington D.C.: Urban Institute. http://www.urban.org/UploadedPDF/413179-Tackling-Persistent-Poverty-in-Distressed-Urban-Neighborhoods.pdf
Turner, M.A. & Kaye, D.R. (2006). How does family well-being vary across different types of neighborhoods? Washington, D.C.: Urban Institute. http://www.urban.org/UploadedPDF/311322_family_wellbeing.pdf
Turner, M.A., Nichols, A., Comey, J., Franks, K., & Price, D. (2012). Benefits of living in high-opportunity neighborhoods: Insights from the Moving to Opportunity demonstration. Washington, D.C.: Urban Institute. http://www.urban.org/UploadedPDF/412648-Benefits-of-Living-in-High-Opportunity-Neighborhoods.pdf
Turner, M.A., Popkin, S.J., & Rawlings, L. (2009a). Building healthy mixed-income developments: Barriers to neighborhood health and sustainability. In M.A. Turner, S.J. Popkin, & L. Rawlings (Eds.) Public Housing and a Legacy of Segregation (18-23). Washington, D.C.: Urban Institute.
Turner, M.A., Popkin, S.J. & Rawlings, L. (2009b). Moving to neighborhoods of opportunity: Overcoming segregation and discrimination in today’s housing markets. In M.A. Turner, S.J. Popkin, & L. Rawlings (Eds.) Public Housing and a Legacy of Segregation (79-98). Washington, D.C.: Urban Institute.
U.S. Department of Housing and Urban Development. (2015). Housing Choice Voucher Program Administrative Fee Study. Washington, D.C.: Abt Associates Inc., RSG, and Phineas Consulting. http://www.huduser.org/portal/Publications/pdf/choice_neighborhoods_interim_rpt.pdf
U.S. General Accountability Office. (2012, Februa Limited Information on the Use and Effectiveness of Tax Expenditures Could be Mitigated through Congressional Attention (GAO-12-262). http://www.gao.gov/assets/590/588978.pdf
Varady, D., & Kleinhans, R. (2013). Relocation counselling and supportive services as tools to prevent negative spillover effects: A review. Housing Studies, 28(2), 317-337.
Wodtke, G.T., Harding, D.J., & Elwert, F. (2011). Neighborhood effects in temporal perspective: The impact of long-term exposure to concentrated disadvantage on high school graduation. American Sociological Review 76(5), 713–736.
Wogan, J.B. (2014, March 25). Is there a better model for housing vouchers? Governing. http://www.governing.com/topics/health-human-services/better-model-affordable-housing-vouchers.html
End Notes
[1] See Briggs (2005a).
[2] For a synthesis of some of this research, see Sard and Rice (2014); Sharkey (2013).
[3] Chetty, Hendren, & Katz (2015). The results of this study are broadly consistent with the impressive outcomes found in the quasi-experimental Gautreaux studies, which tracked the outcomes of low-income families who used housing vouchers to move from segregated public housing developments in Chicago to middle-class, mostly-white suburbs. See Rosenbaum (1995) and DeLuca and Dayton (2009).
[4] A companion study by Chetty and Hendren tracked more than 5 million lower-income families who moved across county lines, comparing outcomes of children who moved to better neighborhoods to those who did not. Consistent with the findings of their MTO analysis, the researchers found greater college attendance, less teenage pregnancy, and higher incomes as young adults for the children in families that moved to better areas. The longer the children lived in better areas, the stronger these positive effects. In addition, the study identified five location characteristics that had the greatest influence on the long-term outcomes of low-income children: segregation by race and income (including the concentration of poverty), income inequality, school quality, the preponderance of two-parent families, and the rate of violent crime. Chetty and Hendren (2015).
[5] Jens Ludwig et al. (2013).
[6] Schwartz’s study took advantage of a natural experiment made possible by the county’s housing policies. Applicants for public housing assistance were randomly assigned to public housing developments across the county. Because of the county’s zoning policies, most of these developments are located in low-poverty neighborhoods (with poverty rates of less than 10 percent), while the others are located in neighborhoods with moderate or high poverty rates (up to 32 percent). This enabled Schwartz to compare educational outcomes for students living in neighborhoods and attending schools that differed significantly with respect to poverty and related characteristics.
[7] Heather Schwartz (2012), “Housing policy is school policy: Economically integrative housing promotes academic success in Montgomery County, Maryland,” in R.D. Kahlenberg (ed.), The Future of School Integration (New York City: The Century Foundation). Other important quasi-experimental studies include the Gautreaux studies (cited above) and Douglas Massey’s studies of families in Mt. Laurel; see Massey et al. (2013).
[8] Jencks & Mayer (1990), Ellen & Turner (1997), Sampson, Raudenbush, & Earls (1997), Sampson et al. (2002), Kawachi & Berkman (2003), Turner & Kaye (2006), Berube (2008), Jargowsky & El Komi (2009), DeLuca & Dayton (2009), Burdick-Will et al. (2011), and Sampson (2012).
[9] Sampson et al. (2008). Building on the work of Sampson and others, Wodtke et al. (2011) also found that sustained exposure to neighborhoods of concentrated disadvantage had a long-term impact on children’s educational achievement. Analyzing data, including neighborhood changes, for more than 4,000 students from across the country over a 17-year period, they found a 20 percentage-point difference in high-school graduation rates for black children with the greatest exposure to neighborhood disadvantage, relative to comparable black children with the least exposure.
[10] Sharkey et al. (2012). Researchers also found elevated levels of stress among the parents, which suggests that parental stress may be a causal pathway by which violence influences children’s performance, a hypothesis that is consistent with the research on toxic stress discussed below.
[11] Sharkey et al. (2014).
[12] National Scientific Council on the Developing Child (2014); National Scientific Council on the Developing Child (2010); Shonkoff et al. (2009); Shonkoff et al. (2012).
[13] Centers for Disease Control and Prevention (2014). Nurturing support from parents and other adults can mitigate the effects of stress on children. Yet poor parents living in high-poverty neighborhoods experience hardships, stresses, and stress-related problems — such as depression — to a degree that can hinder their ability to provide nurturing support for their children (and may engender or exacerbate negative outcomes among children). NSCDC (2009).
[14] American Academy of Pediatrics (2012).
[15] Center on Budget and Policy Priorities, “Policy Basics: The Housing Choice Voucher Program,” July 7, 2015, https://www.cbpp.org/research/housing/policy-basics-the-housing-choice-voucher-program .
[16] Sard and Rice (2014).
[17] Fischer (2015a).
[18] CBPP analysis of Department of Housing and Urban Development (HUD) 2014 administrative data finds that poor families with children used vouchers to live in neighborhoods with a median poverty rate of 24.3 percent, based on the 2010-2014 American Community Survey (ACS) data, identical to the poverty tract rate of the median poor child during that time period. This is a change from our findings using 2010 HUD administrative data and 2005-2009 ACS data, as well as earlier studies of particular groups of voucher holders, which found that families with vouchers lived in significantly lower-poverty areas than comparable families. See Sard and Rice (2014). It is also a change from our original analysis in this paper, which compared where families used vouchers in 2014 to neighborhood poverty rates under the 2009-2013 ACS, and found that the median poverty rate for voucher families was slightly lower (22.8 percent) than for poor families overall.
[19] See Appendix for detailed tables on the location of families with children on rental assistance.
[20] Among poor families with children using vouchers, 11.6 percent lived in low-poverty neighborhoods in 2014, compared with 10.7 percent of all poor children, according to CBPP analysis of 2014 HUD administrative data and 2010-2014 American Community Survey data. See Appendix Tables A-3 and A-4.
[21] CBPP’s analysis of 2014 HUD administrative data and the 2010-2014 American Community Survey. Among poor Hispanic families with children, 16.0 percent of those using vouchers lived in extreme-poverty neighborhoods in 2014 compared to 23.2 percent of all poor Hispanic children in such neighborhoods. Among poor white families with children using vouchers, 14.2 percent lived in extreme-poverty neighborhoods in 2014, more than double the 5.7 percent of all poor white children in such neighborhoods. See Appendix Tables A-3 and A-4. The number of voucher families with children living in extreme-poverty neighborhoods has grown by about 40 percent since 2010, as the number of people living in such neighborhoods increased substantially. See Sard and Rice (2014) and Jargowsky (2015).
[22] See Sard and Rice (2014), pp. 40-43.
[23] The number of poor children living in extreme-poverty neighborhoods increased by a third in the 2010-2014 period, compared with 2005-2009, according to CBPP’s analysis of the American Community Survey for these two time periods.
[24] DeLuca, Garboden, & Rosenblatt (2013); Galster (2013).
[25] See Darrah & DeLuca (2014).
[26] DeLuca, Garboden, & Rosenblatt (2013), p. 271.
[27] HUD rules require agencies to provide information to families when they first receive a voucher about their choices of where to live, and if they live in a high-poverty census tract, to explain the advantages of moving to an area that does not have a high concentration of poor families. See 24 C.F.R. §982.301. But there is no requirement that agencies provide actual assistance to families to find a suitable unit, though HUD’s Housing Choice Voucher Program Guidebook includes some reasons why housing agencies may find it in their interest to provide assistance to families to locate units. HUD Handbook 7420.10G, chapters 2-9.
[28] HUD measures the performance of agencies in administering the HCV program through the Section 8 Management Assistance Program, known as SEMAP. As discussed below, only a very small share of the points available under SEMAP relate to housing location, and the measures are weakly defined.
[29] Briggs, Comey, & Weismann (2010). McClure (2013). Metropolitan areas differ greatly in the share of vouchers used in the suburbs relative to the share of units renting below the Fair Market Rent that are located in the suburbs. (Covington, Freeman, & Stoll, 2011).
[30] McClure (2013), p. 216, using 2005-2009 ACS data.
[31] Scott et al. (2013).
[32] Congress increased funding significantly in 2014 for both voucher subsidies (by more than $1 billion) and public housing agencies’ administrative costs (by $227 million), compared with the funding that PHAs received in 2013, when sequestration was in effect. For 2015, Congress increased voucher funding modestly.
[33] Bostic (2014); U.S. General Accountability Office (2012); Abravanel, Pindus, & Theodos, (2010); DeLuca & Rosenblatt (2013); Kubisch (2010).
[34] Turner, Popkin, & Rawlings (2009a); Popkin & Cunningham (2009).
[35] Under SEMAP, only five out of the 135 points that agencies in metropolitan areas are eligible to receive concern adoption and implementation of policies to “expand housing opportunities,” which HUD defines as encouraging participation of landlords located outside areas of poverty or minority concentration and providing information to voucher holders about such opportunities. 24 C.F.R. § 985.3(g). (Metropolitan agencies required to operate a Family Self-Sufficiency program may earn a total of 145 points.)
Agencies can earn an additional five points if half or more of HCV families with children live in “low-poverty” census tracts or the share of families living in such areas increases by 2 percent or more. HUD defines “low poverty” for this purpose as a poverty rate of 10 percent or less, or the average poverty rate in the agency’s primary service area, whichever is higher (see 24 C.F.R. §985.3(h)). As of 2012, only 166 of the 1,403 agencies operating in metropolitan areas claimed these additional five points (CBPP calculation of HUD SEMAP data).
[36] Experience in the Moving to Opportunity program indicates that measuring location performance solely on the basis of the neighborhood poverty rate is insufficient, because that does not necessarily correspond to reliable access to well-performing schools. See Turner, Popkin, & Rawlings (2009b) pp. 85-86, for a discussion of the challenges in objectively defining opportunity areas. The recent report of the Bipartisan Policy Center’s Housing Commission recommended that HUD adopt outcome-based performance measures, including measures that promote the deconcentration of poverty and access to neighborhoods of opportunity (Bipartisan Policy Center, 2013, p. 99).
[37] O’Neil (2009).
[38] HUD, Affirmatively Furthering Fair Housing Final Rule, 80 Fed. Reg. 42272 (July 16, 2015).
[39] Deadlines for submission of grantees’ assessments of fair housing are generally pegged to when their next five-year plan is due to HUD. Except for smaller entities, these deadlines will begin in 2016 for cities and counties, and PHAs that join with them, and extend over a five-year period. Due dates for PHAs that administer more than 550 vouchers and public housing units and submit their own assessments (or join only with other PHAs or the state) will begin in 2017 and also extend over five years. See https://www.hudexchange.info/resources/documents/AFFH-FAQs.pdf.
[40] To assist grantees in implementing the final AFFH rule, HUD plans to provide agencies with neighborhood-level data on location of assisted housing, education quality, transit access, levels of poverty and employment, exposure to environmental health hazards, and the availability of other community assets in order to help agencies assess levels of opportunity in particular neighborhoods. See the updated draft of the AFFH Assessment Tool and draft tables of the accompanying data that HUD published on July 16, 2015, http://www.huduser.org/portal/affht_pt.html#affhassess-tab.
[41] U.S. Department of Housing and Urban Development, “Housing Choice Voucher Program Administrative Fee Study Final Report,” August 2015, http://www.huduser.org/portal/publications/pdf/AdminFeeStudy_2015.pdf. HUD has authority under its current rule (24 C.F.R. §982.152(a)(iii)(C)) to provide supplemental fees for “extraordinary costs,” which HUD uses to provide a $200 bonus to a housing agency for each family that buys a home while participating in the HCV program. HUD could also use this authority to provide a bonus to agencies that assist families to use vouchers successfully to move to high-opportunity areas. PHAs primarily earn fees based on the number of vouchers in use. Leasing units in high-opportunity areas typically takes longer than leasing in neighborhoods where vouchers are commonly accepted. A fee incentive would help balance PHAs’ current financial interest in having families locate units as quickly as possible.
[42] Generally, families pay at least 30 percent of their adjusted income for rent and any tenant-paid utilities, and the HCV subsidy covers the rest of the cost up to the agency-set payment standard, which varies by family size. If the cost of rent and utilities is above the payment standard, the family pays 100 percent of the additional cost, but families are not permitted to move into a unit that costs them more than 40 percent of their income. Agencies may vary their payment standards for different neighborhoods, but few do so, and they cannot set a payment standard outside of the “basic range” of 90-110 percent of the Fair Market Rent for the area without HUD approval.
[43] The share of vouchers that families with children use to rent larger units — that is, units with more bedrooms than their subsidy level is based on — increases slightly with the poverty rate of the census tract in which families live, rising from 18 percent of the vouchers used by families with children in low-poverty census tracts to 23 percent of such vouchers in tracts where 30 percent or more of residents are poor. In tracts where the poverty level is 10 percent or greater, a majority of these larger units are in zip codes where the zip-code-based FMR is below the metro-wide FMR. In extreme-poverty census tracts, 73 percent of voucher-holder families with children live in zip codes where the zip-code-based FMR is below the metro-wide FMR. (CBPP analysis of HUD 2012 administrative data for agencies not participating in the Moving to Work demonstration, compared with 2013 HUD FMRs.) Rosen (2014) describes, based on ethnographic research with Baltimore landlords renting to HCV holders, the motivations of landlords and families with HCVs that lead to families renting larger (or nicer) units in racially concentrated, very poor, “rough” neighborhoods.
[44] Edin, DeLuca, & Owens (2012); Collinson & Ganong (2013); Khadduri (2013a).
[45] See Fischer (2015b); Collinson & Ganong (2015).
[46] Collinson & Ganong, id; Fischer (2015b).
[47] U.S. Department of Housing and Urban Development, “Establishing a More Effective Fair Market Rent (FMR) System; Using Small Area Fair Market Rents (SAFMRs) in Housing Choice Voucher Program Instead of the Current 50th Percentile FMRs; Advance Notice of Proposed Rulemaking,” 80 Federal Register 31332, June 2, 2015, http://www.gpo.gov/fdsys/pkg/FR-2015-06-02/pdf/2015-13430.pdf.
[48] Even without this policy change, individual housing agencies could request HUD approval for “exception payment standards” that are based on the SAFMRs and are set more than 10 percent above or below the metropolitan FMR, without the need to conduct a costly survey of market rents. See Final Fair Market Rents for the Housing Choice Voucher Program and the Moderate Rehabilitation Single Room Occupancy Program fiscal year 2015, 79 Fed. Reg. 59786, 59787 (Oct. 3, 2014).
[49] DeLuca, Garboden, & Rosenblatt (2013), pp. 280-281; PRRAC (2015). Several studies found that families relocating from public housing that was being demolished or rehabilitated relied most heavily on the agency-provided list of units (see Galvez (2010) p. 11). Rosen (2014) describes similar problems when a housing agency relies on a privately compiled website (e.g., GoSection8.com).
[50] 24 C.F.R. § 982.301(b)(11), effective September 21, 2015. 80 Fed. Reg. 50564, 50573 (August 20, 2015).
[51] Varady and Kleinhans (2013) emphasize the potential importance of avoiding the concentration of voucher holders in neighborhoods that are becoming increasingly poor, in order to prevent negative “spillover” effects from housing assistance programs. They also emphasize the role of targeted landlord outreach and post-move counseling (discussed below) in achieving broader dispersal.
[52] Briggs, Popkin, & Goering (2010), p. 233, emphasize the importance of strategies that would “change the default” of families staying in familiar neighborhoods, citing Richard Thaler and Cass Sunstein (2008).
[53] DeLuca, Garboden, & Rosenblatt (2013), pp. 275-280. In most areas of the country, landlords may legally refuse to accept HCVs unless that can be proven to be a proxy for discrimination based on race, national origin, disability, or family status that is prohibited by the Fair Housing Act.
[54] See 24 C.F.R. §982.303. Extensions are required as a reasonable accommodation to people with disabilities. HUD’s recent final rule on “Streamlining the Portability Process” requires agencies to give a minimum 30 days of additional search time when families seek to use a voucher in another jurisdiction. 24 C.F.R. § 982.355(c)(13), effective September 21, 2015. 80 Fed. Reg. 50564, 50574 (August 20, 2015).
[55] CBPP analysis of HUD’s 2013 Picture of Subsidized Households data and 2013 metropolitan core-based statistical area boundaries. The United States Office of Management and Budget (OMB) defines a Metropolitan Statistical Area (MSA) as one or more adjacent counties or county equivalents that have at least one urban core area of at least 50,000 population, plus adjacent territory that has a high degree of social and economic integration with the core as measured by commuting ties. For more information on metropolitan area definitions, see http://www.census.gov/population/metro. We ranked the 100 largest metro areas by population. Population estimates in metropolitan areas are from U.S. Census Bureau, American Community Survey, 2012 1-Year Estimates, Table DP04, generated using American Fact Finder, http://factfinder.census.gov. In 272 out of all 381 metro areas, two or more PHAs administered HCV programs; a single agency served only a little more than one-fourth of metro areas.
[56] For a discussion of the interrelationship between low-income and racially segregated neighborhoods and lower-quality schools in central cities and some older suburbs, see Briggs (2005b) and Mickelson (2011, p. 5).
[57] Consolidation of separate housing agencies to form a single metro-wide PHA would potentially have greater benefits but also faces greater political hurdles; for many PHAs, the ability to retain their independent identity is a paramount concern. This makes it more likely that PHAs would join a consortium to achieve administrative economies of scale than to formally consolidate with other agencies. Urban policy experts Bruce Katz of the Brookings Institution and Margery Austin Turner of the Urban Institute recently issued a paper recommending regional voucher administration (See Katz & Turner, 2013).
[58] HUD had proposed to require agencies with excess unutilized funds to “absorb” families moving to another jurisdiction into their own HCV programs, rather than billing the agencies that issued the families’ vouchers for the related funding. HUD did not include this proposal in the final portability rule. HUD also declined to alter the policy that allows “receiving” agencies to require families to go through repetitive procedures to affirm their eligibility. These extra steps may result in rejection by the new agency despite the initial agency’s approval and the family’s participation in the program. 80 Fed. Reg. 50564 (August 20, 2015).
[59] According to HUD, there currently are only eight consortia involving 35 PHAs that administer the HCV program. HUD, Streamlining Requirements Applicable to Formation of Consortia by Public Housing Agencies, Proposed Rule, 79 Federal Register 40019, July 11, 2014.
[60] Id. HUD plans to issue a new proposed rule before the end of 2015 that will streamline the consortia process for public housing administration as well as HCVs. HUD did not have the authority to enter into a single funding contract with a consortium of PHAs regarding public housing until Congress amended the law in January 2014. See P.L. 113-76, Division L, Title II, § 212.
[61] U.S. Housing Act of 1937, 42 U.S.C. § 1437a(6)(B)(iii) (2006).
[62] Fee-splitting and ongoing transfers of funds and records between the agencies that issued the vouchers and the agencies that serve the areas where families lease housing are required unless the “receiving” agencies “absorb” the families into their own HCV program, by giving the families vouchers they have available instead of serving families on their waiting lists.
[63] Research in Southern California has identified the portability process as a barrier for families and a disincentive for PHAs to inform families of their right to move to other jurisdictions (Basolo, 2003). In the final portability rule, HUD declined to require PHAs to remind families about portability after the briefing when they first receive a voucher, stating that “HUD finds this initial briefing to be sufficient.” 80 Fed. Reg. 50570, August 20, 2015. It is not clear on what basis HUD made such a finding. Few families will remember details from the initial briefing that are not of immediate importance to them.
[64] In their analysis of how philanthropic investments can help tackle poverty in distressed urban neighborhoods, Turner, Edelman, Poethig, and Aron (2014) discuss assisted housing mobility strategies and support for car access as two promising initiatives to expand residents’ choices.
[65] See, e.g., O’Neil (2009). Many of the efforts to help voucher holders move to higher-opportunity communities have focused on former public housing residents, often because the efforts were the result of litigation concerning public housing segregation. The Moving to Opportunity Demonstration, as well, involved public housing residents. O’Neil points out the greater barriers such families may face compared with families who have a history of renting in the private market and are familiar with how the HCV program works. Whether families need direct assistance and how much assistance they may require may depend on their background as well as local market characteristics.
[66] The Housing Opportunity Area Tax Incentive is in Section 18-173 of the Illinois Property Tax Code. The program is limited to townships with relatively high real estate evaluations within counties with at least 200,000 residents. “Low poverty” is defined as census tracts where less than 10 percent of residents are poor, except in the city of Chicago, where the measure is less than 12 percent poor. Public housing agencies are responsible for much of the administration of the abatement program.
[67] Rep. Blaine Leutkemeyer (R-MO), chair of the House Financial Services Subcommittee on Housing and Insurance, recently filed the Housing Opportunities through Modernization Act, H.R. 3700, that would help expand voucher holders’ access to high-opportunity neighborhoods by making it easier for agencies to make long-term commitments to support vouchers attached to properties (“project-basing”) in low-poverty areas where tenant-based vouchers are difficult to use and by streamlining the voucher housing quality inspection process (which sometimes makes it difficult for voucher holders to rent in high-opportunity neighborhoods where owners can easily rent to families without vouchers). Enactment of these provisions would give state and local housing agencies additional cost-free tools to encourage landlords in low-poverty areas to accept vouchers. See Will Fischer’s testimony on the bill for further details (Fischer 2015c).
[68] Freeman (2012); Freeman & Li (2014). These studies covered only some of the areas with laws prohibiting discrimination against voucher holders. It is important to note that few if any areas have rigorous enforcement of voucher anti-discrimination laws. The Poverty & Race Research Action Council maintains a list of anti-discrimination laws that apply to housing vouchers; see Poverty & Race Research Action Council (2015), http://www.prrac.org/pdf/AppendixB.pdf. Except for properties that receive particular types of federal assistance or tax credits, there is no federal requirement not to discriminate against voucher holders, although the Fair Housing Act prohibits discrimination against protected classes of people, including refusal to accept housing vouchers as a pretext for discriminating against those groups of people.
[69] Cunningham et al. (2010).
[70] Qualitative research with families that moved to low-poverty areas as part of the Moving to Opportunity demonstration identified the difficulty of finding new landlords who would accept vouchers in the same or similar communities as a major reason that many families moved back to higher poverty neighborhoods when their initial lease terminated (Comey, Briggs, & Weismann, 2008; Edin, DeLuca, & Owens, 2012).
[71] Family participation in these programs is voluntary. In Baltimore, vouchers issued as part of the Thompson court settlement must be used initially in a census tract that has less than 10 percent poverty and a population that is less than 30 percent African American and less than 5 percent subsidized housing residents. The program is administered by a non-profit that operates throughout the Baltimore area. In Dallas, the Inclusive Communities Project provides mobility counseling to families with special vouchers issued as part of the settlement of the Walker case, and since 2011 to any families issued regular vouchers by the Dallas Housing Authority who are interested in living in a high opportunity area. The Walker vouchers have to be used first in an area with no public housing units and a lower black population and poverty rate than the city of Dallas. Under the Walker decree, the Dallas Housing Authority can administer all of the vouchers it issues, not just the special vouchers, in any of the seven counties the decree covers. Both the Baltimore and Dallas programs allow families more time to find a unit to rent and provide additional financial assistance to help with moving costs for families that lease in areas that meet these restrictions or otherwise qualify as high-opportunity areas. In addition, vouchers used in such areas can pay a higher subsidy than HUD rules usually allow. For Baltimore, see Engdahl (2009) and Darrah and DeLuca (2014). For Dallas, see Inclusive Communities Project (2013).
[72] Preliminary analyses that DeLuca, Garboden, and Rosenblatt conducted show that the duration-weighted neighborhood poverty rate for families in the Baltimore program who moved between two and ten years earlier was 11.4 percent in 2013. Families’ average neighborhood poverty rate over the five years following their initial move was 12.2 percent; the rate was 14.6 percent over the ten years after the families’ initial move. (Personal communication, June and August 2014). For data on the original and first-move neighborhoods of these families, see DeLuca and Rosenblatt (2011). Comparable data on duration of stay in low-poverty areas are not available for the Dallas program, though administrative data indicate that the 2,087 families with Walker vouchers (see note above) have lived in their current home in an area that meets program requirements for an average of four years. (Personal communication from Elizabeth Julian, President of the Inclusive Communities Project, April 2014.) For similar analysis of MTO families, see Ludwig (2012).
[73] Darrah & DeLuca (2014). See also Wogan (2014, March 25). The Baltimore area program has added an education component to its mobility counseling to help parents understand better what different schools offer and to help students adjust to their new schools (DeLuca et al., 2012). Other research has suggested that families’ values and their interest in remaining in a different type of neighborhood than they had experienced previously were likely to be influenced by the extent of “social integration” that family members achieved with their new neighbors (e.g., Varady & Kleinhans, 2013).
[74] Turner et al. (2012); Chetty, Hendren & Katz (2015).
[75]Cunningham et al. (2010); Galvez (2010); Rosenbaum & Zuberi (2010).
[76] HUD provided funding for the counseling services and financial incentives; the MacArthur Foundation has funded the research. One of the authors of this paper, Barbara Sard, chairs the Technical Advisors Panel for the Chicago Regional Housing Choice Initiative.
[77] Scott et al. (2013), p. 64-68.
[78] Pendall et al. (2014). This study used data from the MTO demonstration as well as the Welfare to Work Voucher program. It found that families with access to a car spent a larger share of the time during the study living in a neighborhood that was less than 10 percent poor than families without access to a vehicle, regardless of what group they were assigned to as part of either demonstration (a 4.9-percentage-point-larger share of the time for MTO participants and a 5.7-point-larger share for WTW participants). For MTO families, vehicle access mattered almost as much as receiving a geographically restricted voucher for lengthening the duration of stay in a low-poverty neighborhood, and significantly lowered the rate of re-entry into higher poverty neighborhoods. The authors acknowledge, however, that families with cars may have differed in unobserved ways from families without cars, such as perseverance, as car access was not a factor in the selection of treatment and control groups in either study. See also Pendall et al. (2015). According to the National Consumer Law Center, there are more than 120 nonprofit organizations across the country that help low-wage working families obtain a car. See http://www.workingcarsforworkingfamilies.org/find-a-program
More from the Authors

Areas of Expertise