House Tax Credits Would Make Health Insurance Far Less Affordable in High-Cost States
In 11 States, Tax Credits Would Be Cut More Than in Half
President Trump has promised to replace the Affordable Care Act (ACA) with something that provides “good coverage at much less cost.”[1] The ACA repeal plan being considered by House Committees this week violates that pledge for millions of Americans who currently get health coverage through the ACA marketplaces. The House Republican health plan would give consumers in the health insurance marketplace nationally an average of $1,700 less help with premiums in 2020, compared to the ACA’s premium tax credits, according to the Kaiser Family Foundation.[2]Consumers’ costs would probably increase even more than tax credits would fall, since the House plan would likely cause individual market premiums to rise.The losses would be larger for older and lower-income consumers, and lower-income consumers would also lose help with deductibles and other out-of-pocket costs. Consumers’ costs would probably increase even more than tax credits would fall, since the House plan would likely cause individual market premiums to rise.[3]
The impact would be even more severe for people in high-cost states. Consumers in 11 high-cost states would see their tax credits to purchase health coverage fall by more than $3,000 on average — or more than 50 percent.[4] That’s because unlike the ACA’s tax credits, the House plan’s tax credits wouldn’t adjust for geographic variation in insurance premiums; they’d be the same for a 45-year-old consumer in Alaska, where benchmark health insurance coverage costs $12,600 this year on average, as in New Hampshire, where it costs $3,600.
The House plan’s drastic cuts to financial assistance in high-cost states would almost certainly mean large coverage losses for low- and moderate-income people. Enrollment would decline, due both to these cuts and because the legislation would end the ACA’s individual mandate. Those enrollment declines, in turn, also could precipitate further large increases in (pre-tax credit) premiums, resulting in further enrollment declines and further premium increases. In extreme cases, this feedback loop might continue until a state’s individual market shrank drastically, or even completely collapsed — the phenomenon known as an insurance market “death spiral.”
This paper draws on data on premiums, ACA tax credits, and demographics available for the 39 states that use the HealthCare.gov enrollment platform to project how the House plan tax credits would vary across those states. Findings include:
- Tax credit losses would vary widely across states. Average tax credits for current marketplace consumers would fall by nearly $2,100 across the 39 HealthCare.gov states, slightly higher than the nationwide average that the Kaiser Family Foundation estimated.[5] For consumers in 10 lower-cost states, tax credits would fall by less than $1,000 on average, and in two states the credits would increase slightly. Meanwhile, consumers in 11 states would see tax credits fall by more than $3,000 on average, or more than 50 percent, and consumers in seven states would lose an average of more than $4,000. In Alaska, by far the highest-premium state, the average reduction in tax credits would be $10,200, or 78 percent.
- The result would be wide gaps in affordability across the country. Under the ACA, a 45-year-old with income of $22,000 (roughly the median age and income for marketplace consumers) can purchase benchmark coverage for $1,200 or less anywhere in the country.[6] But because the House plan would cut tax credits for this consumer by between $100 and $11,000, her cost for comparable coverage would range from $1,300 in New Hampshire to $11,800 in Alaska — even ignoring the fact that the House plan would likely cause pre-credit premiums to increase.[7]
- The reduction in tax credits would be even more severe, and geographic disparities often magnified, for lower-income and older consumers. Even in a low-cost state like New Hampshire, a 60-year-old with income of $22,000 would see his tax credit reduced by $2,800, while in 11 states the losses would exceed $8,000. (Premium increases for older consumers would often be much larger than tax credit reductions because the House plan would also allow insurers to charge older consumers up to five times more than younger consumers, versus a limit of three times as much under current law.)
This paper examines how the House plan’s tax credits would affect coverage affordability and individual-market stability across states. It is the second in a series of analyses examining the impact of the House plan on health care access, affordability, and quality. An earlier paper concluded that the House plan would effectively end the ACA’s Medicaid expansion and lead to cuts in Medicaid coverage and services for seniors, people with disabilities, and families with children.[8] Subsequent analyses will examine other aspects of the House plan.
Analyzing the Impact of the House Plan Across States
In order to evaluate how the House plan’s impacts would differ across the country, we project tax credits under current law versus the House approach for consumers in different states, based on states’ 2017 individual-market premiums and consumer demographics. Since the House tax credits would not take effect until 2020, we inflate 2017 marketplace premiums to 2020 based on projections from the Centers for Medicare & Medicaid Services Office of the Actuary.[9] In addition to estimating average tax credits, we consider impacts on hypothetical consumers in these states who face premiums equal to their state’s average benchmark premium.[10] Detailed 2017 data on premiums and demographics are only available for the 39 states using the HealthCare.gov enrollment platform, so we focus on the impact of the House plan in those states. (For a complete description of our methodology, see the appendix. Our approach largely follows that of Kaiser’s earlier analysis of the House tax credits.[11])
Naturally, premium growth rates could differ across states between now and 2020, so some states with higher-than average premiums today might have lower-than-average premiums in the future. However, certain states are consistently high cost. Of the 20 states with premiums above the HealthCare.gov average for 2017, 16 had premiums above the national average the previous year. Seven states had individual-market premiums above the HealthCare.gov average for three years in a row and also had employer premiums above the national average in 2016.[12] Our findings may be especially pertinent for these seven consistently high-cost states: Alaska, Delaware, Louisiana, Maine, Wisconsin, West Virginia, and Wyoming. More generally, our analysis illustrates how the House plan would harm consumers in states with especially high individual-market premiums in the future.
We estimate the average impact of the House plan for current marketplace consumers in these states. The House plan, unlike the ACA, also provides tax credits to the minority of individual-market consumers who purchase coverage outside the marketplace. Thus, average tax credits under the House plan, taking into account all individual-market consumers, would be higher than the amounts we calculate below. But the impact on current marketplace consumers is the more relevant metric for assessing the House plan’s impact on coverage, since people purchasing health insurance outside the marketplace are, by definition, able to afford coverage without financial assistance. In addition, the demographic data needed to calculate tax credits under the House plan are not available for off-marketplace consumers.[13]
How Tax Credits Work Under the ACA Versus the House Plan
The ACA’s premium tax credit varies based on income and the cost of insurance. Low- and moderate-income families are guaranteed the option to purchase benchmark health insurance for a set percentage of their income, with the premium tax credit covering the remainder. Once the credit’s value is set under this formula, consumers can use the credit to help pay the premium of any qualified health plan offered in their state’s marketplace.
Because the premium tax credit is based on the cost of a benchmark plan — an actual plan in the marketplace for someone of the consumer’s age in the consumer’s geographic rating area — the credit is flexible enough to meet the needs of people who live in high-cost states, are older, or have lower incomes. The average ACA premium tax credit in HealthCare.gov states is projected to be about $5,000 in 2020. But because of the large variation in the cost of coverage across states, the average tax credit would be as high as $13,100 in Alaska and as low as $2,400 in New Hampshire. Credits also vary significantly by age and income.
By contrast, the House plan would provide flat tax credits varying only by age (and phasing out at high incomes).[14] The credit would range from $2,000 for people under 30 years old to $4,000 for people 60 and over, regardless of the local cost of plans.
To illustrate the difference, consider net premiums and tax credits under the ACA versus under the House plan for a 45-year-old with income of $22,000 living in Alaska, the highest-cost state; Wyoming, the fifth highest-cost state; and Indiana, the fifth lowest-cost, supposing each consumer faces the average benchmark premium in her state. Under the ACA, consumers at this income level pay 5.38 percent of income for benchmark coverage, or $1,200 per year.[15] Premium tax credits make up the rest: $14,000 in Alaska, $6,900 in Wyoming, and $3,300 in Indiana. In contrast, under the House plan, all three consumers would receive tax credits of $3,000. That leaves the Indiana consumer paying the remaining $1,500 in annual premiums — an increase compared to current law, but a small one compared to the Wyoming consumer, who would face a net premium of $5,100 after tax credits, or the Alaska consumer, who would pay $11,800 (assuming no changes in pre-credit premiums).
Average Tax Credits Would Fall Sharply in High-Cost States
The average tax credit in high-cost states would fall sharply under the House plan. Enrollees in 11 states would see their tax credits cut by more than half, and people in seven states — Alaska, North Carolina, Oklahoma, Alabama, Nebraska, Wyoming, and West Virginia — would face average credit reductions of more than $4,000. These steep cuts would greatly reduce the affordability of coverage and almost certainly increase the number of uninsured in those states.
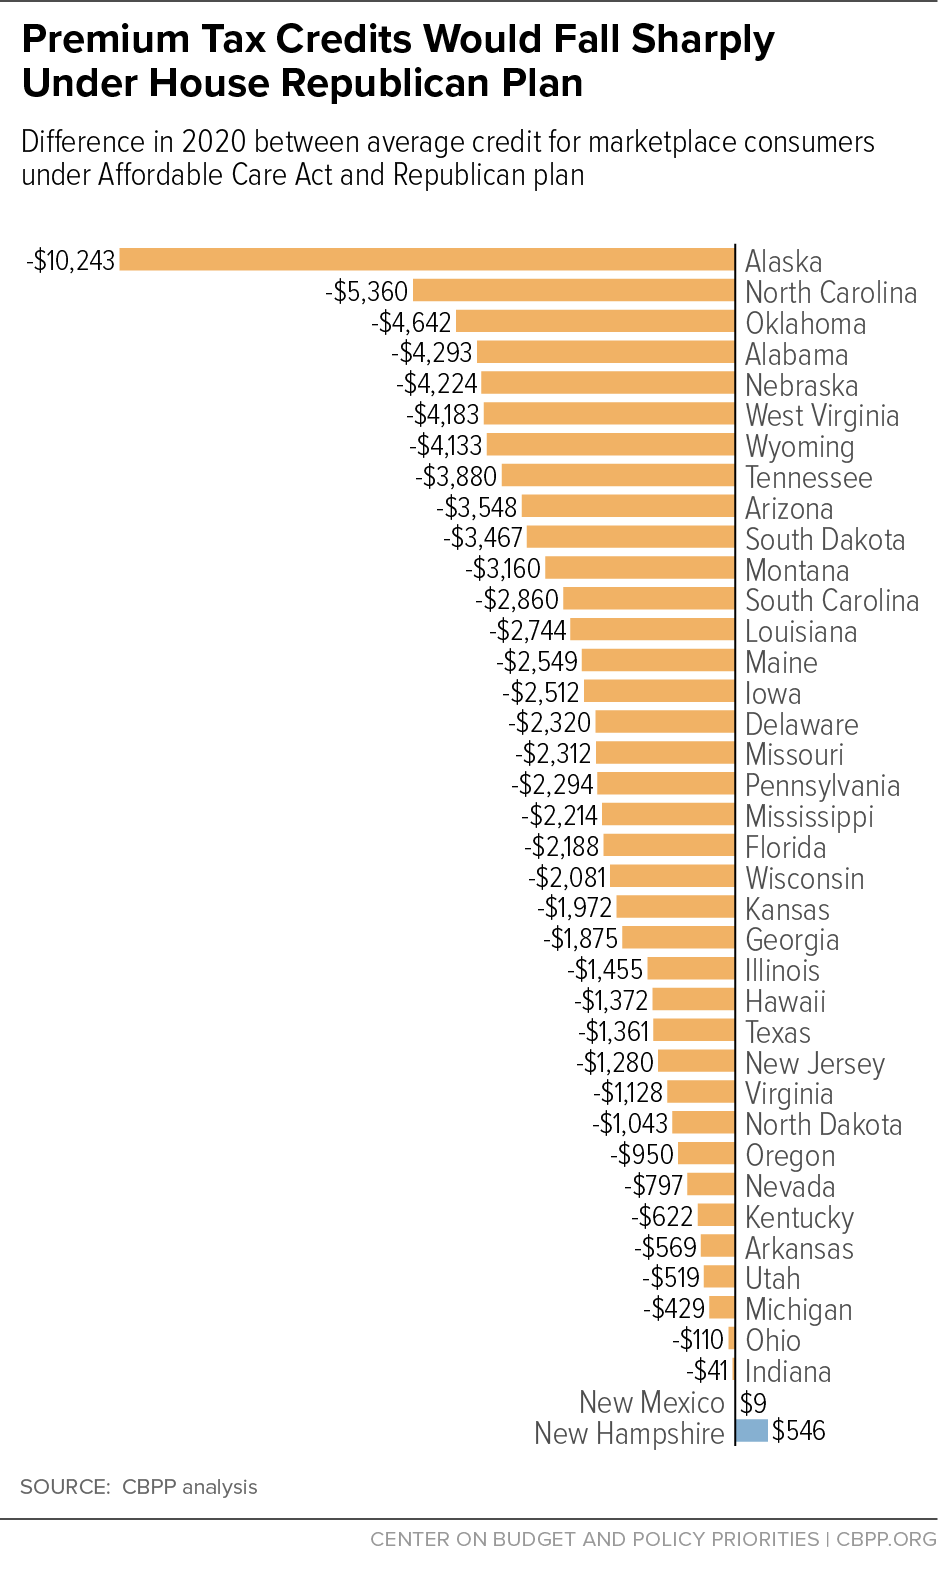
While high-cost states (and states with lower-income and older consumers) would face the most dramatic reductions in tax credits and losses in coverage, current marketplace consumers in nearly every HealthCare.gov state would be harmed. The average credit reduction would be nearly $2,100, or 41 percent, under the House plan for current marketplace consumers in the HealthCare.gov states. Tax credits would fall in 37 of 39 HealthCare.gov states. (See Figure 1 and Appendix Table 1.) Rural states are disproportionately represented among the most-harmed states because they tend to have higher premiums, owing to less competitive insurance and provider markets.[16]
Losses would also increase over time. Under the ACA, tax credits increase as needed to largely shield low- and moderate-income consumers from premium increases. For example, in 2016, pre-credit premiums increased an average of $30 per month, but net premiums among consumers eligible for tax credits increased just $4 per month.[17] Under the House plan, tax credits would grow at the rate of inflation plus 1 percentage point, no matter how quickly premiums rose in a particular year or state. As a result, Kaiser estimates that the (nationwide) average reduction in tax credits for marketplace consumers would increase from $1,700 to $2,900 between 2020 and 2027.
Tax Credits Would No Longer Smooth Out Premium Variation
Delinking tax credits from the cost of insurance would leave many people in high cost states — especially low- and moderate-income people — without enough help to make coverage affordable.
Under the ACA, a 45-year-old with income of $22,000 (roughly the median age and income for marketplace consumers) can purchase benchmark coverage for $1,200 or less anywhere in the country. Under the House plan, the cost would range from $1,300 in New Hampshire (the lowest-premium HealthCare.gov state) to $11,800 in Alaska (the highest-premium state). The share of the premium paid by the enrollee would be higher than under the ACA in every state, and in most states, it would more than double. (See Appendix Table 2.)
For lower-income and older consumers, the reduction in tax credits would be even more severe, and geographic disparities would often be even larger. A 60-year-old consumer with an income of $22,000 who faced the HealthCare.gov average benchmark premium would receive a tax credit of nearly $10,000 under the ACA. Assistance would fall to $4,000 under the Republican plan. Even in a low-cost state like New Hampshire, a 60-year-old would see his tax credit reduced by 42 percent, while in Alaska the tax credit would fall by 85 percent.
Moreover, these estimates understate many consumers’ cost increases because they fail to account for three other ways the House plan would raise costs.
- First, it would allow older consumers to be charged more in premiums. Under current law, premiums can be up to three times higher for someone who is 64 years old than for someone who is 21 years old. The House plan would allow the variation to widen to 5-to-1, even as it also cuts tax credits disproportionately for older consumers. (This policy also lowers premiums for younger consumers.)
- Second, it would eliminate the ACA’ s help with out-of-pocket costs for lower-income consumers. Under the ACA, cost-sharing reduction payments reduce deductibles, copays, and coinsurance for more than 6 million people nationwide with incomes below 250 percent of the federal poverty level (about $60,000 for a family of four).[18]
- Third, as discussed further below, the House bill’s combination of poorly targeted subsidies and lack of an individual mandate would likely cause (pre-credit) individual market premiums to rise (at least for comparable coverage), especially in high-cost states where reductions in tax credits are greatest.
Structure of House Tax Credits Could Destabilize Individual Market in Some States
The new House plan builds on ACA repeal legislation passed by Congress in 2015 and vetoed by President Obama last year. Like that bill, it repeals the individual mandate and the ACA’s financial assistance while leaving in place the requirement that insurers sell coverage to people with pre-existing conditions.
CBO concluded that the 2015 legislation would have caused the individual market for health insurance to largely collapse: “about half of the nation’s population [would live] in areas that would have no issuer participating in the nongroup market in the first year after the repeal of the marketplace subsidies took effect, and that share would continue to increase, extending to about three-quarters of the population by 2026.” [19]
The most significant difference in the individual-market provisions of the new House plan compared to the 2015 legislation is the new plan’s replacement tax credits. House Republicans are presumably hoping that these tax credits will stabilize the individual-market risk pool enough to avoid wholesale market collapse. But even if that’s the case, they may not be sufficient to avoid severe market deterioration, or even a death spiral, in the highest-cost states.
That’s because the large reductions in subsidies in these states will lead to large drops in enrollment, especially when combined with the House plan’s repeal of the individual mandate.[20] That, in turn, will lead to even higher premiums. As CBO noted in its analysis of the 2015 bill, if subsidies are insufficient to make coverage affordable, “not only would enrollment decline, but the people who would be most likely to remain enrolled would tend to be less healthy (and therefore more willing to pay higher premiums). Thus, average health care costs among the people retaining coverage would be higher, and insurers would have to raise premiums in the nongroup market to cover those higher costs.”
The House plan’s tax credits would then do nothing to arrest a “feedback loop” in which higher premiums lead to lower enrollment and a worse risk pool, leading to still higher premiums and further enrollment declines. As discussed above, the ACA’s premium tax credits increase as needed to protect most consumers from premium increases. That prevents a feedback loop from gaining strength: even if premiums rise sharply, net premiums stay about the same for most people, so there is no reason for them to drop coverage. But with tax credits delinked from premium growth, an initial enrollment drop and premium increase could trigger further enrollment declines, triggering further premium increases, triggering further enrollment declines – with the feedback loop continuing until the individual market shrinks dramatically, or even virtually disappears, a phenomenon known as a death spiral.
This is a particular risk in Alaska, where the individual market is already fragile and where the House plan would cut average tax credits by 78 percent — not that different from the 2015 bill’s proposal to eliminate premium tax credits altogether. (See box.) The bill would also cut tax credits for current marketplace consumers by more than half in North Carolina, Oklahoma, Alabama, Nebraska, Wyoming, West Virginia, Tennessee, Arizona, South Dakota, and Montana.
Even if the House tax credits are large enough to prevent health insurance markets from collapsing in most of the country, as CBO predicted would have occurred without them, they would leave the individual market far more fragile than it is today. As a result, any large premium increase in any state could put its individual market at risk of significant unraveling. Since the House plan virtually guarantees such increases, at least in some states, it would almost certainly result in spiraling premium increases and enrollment declines at least in some parts of the country.
Alaska’s Individual Market Is Especially At Risk
Since long before the ACA, Alaska’s health insurance market has faced very serious challenges.a Due in part to low population density and high provider and insurer concentration, Alaska has consistently had some of the highest premiums in the nation for employer-sponsored, as well as individual-market, health insurance.b
While structural challenges in insurance markets remain, the share of Alaskans without health insurance has fallen sharply under the ACA. One important reason is that the ACA’s premium tax credits adjust for local costs, making health insurance affordable to thousands of Alaskans for the first time. Because of its unusually high premiums, Alaska receives by far the highest per-person premium tax credits in the country, averaging $11,600 per marketplace consumer on an annualized basis for 2017, compared to an average of $4,600 across all HealthCare.gov states.c Even before fully implementing the Medicaid expansion, Alaska saw its adult uninsured rate fall sharply, reflecting the fact that low- and moderate-income Alaskans were finally able to purchase health insurance in the individual market.d
The House plan would almost certainly reverse most or all of these gains, and it could plunge Alaska’s individual market into an even more severe crisis. Where tax credits would fall by an average of $2,100 or 41 percent for marketplace consumers across all HealthCare.gov states, they would fall by an average of $10,200 or 78 percent in Alaska.
For Alaska, therefore, the consequences of the House plan would be similar to the consequences of the 2015 ACA repeal bill vetoed by President Obama. CBO estimated that bill, which completely eliminated tax credits to help purchase health insurance, would have caused most states’ individual markets to collapse — almost certainly including Alaska’s.
a Department of Health and Human Services, “Report to Congress of the Interagency Access to Health Care in Alaska Task Force,” 2010, http://dhss.alaska.gov/ahcc/Documents/meetings/201010/fedtaskforce.pdf.
b Linda J. Blumberg, John Holahan, and Erik Wengle, “Are Nongroup Marketplace Premiums Really High? Not in Comparison with Employer Insurance,” Urban Institute, September 2016, http://www.urban.org/sites/default/files/publication/84256/2000931-Are-Nongroup-Marketplace-Premiums-Really-High-Not-in-Comparison-with-Employer-Insurance.pdf.
c Gallup, “In U.S., Uninsured Rates Continue to Drop in Most States,” August 10, 2015, http://www.gallup.com/poll/184514/uninsured-rates-continue-drop-states.aspx.
d Centers for Medicare & Medicaid Services, “Health Insurance Marketplaces 2017 Open Enrolment Period: January Enrollment Report,” January 10, 2017, https://www.cms.gov/Newsroom/MediaReleaseDatabase/Fact-sheets/2017-Fact-Sheet-items/2017-01-10.html.
Appendix: Methodology
To calculate and compare average tax credits under the ACA versus the House plan, we start with data on average premium tax credits by state for consumers who selected marketplace plans during the first eight weeks of the 2017 open enrollment.[21] We inflate these tax credits to 2020 based on CBO’s projected growth in average premium tax credits.[22] We then compute tax credits under the House plan in 2020 based on the age distribution of each state’s 2017 marketplace plan selections.[23]
To calculate premiums and tax credits under the ACA and the House plan for hypothetical consumers, we follow the approach taken in the Kaiser Family Foundation analysis described in the main text. Specifically, we inflate unsubsidized 2017 marketplace benchmark premiums to 2020 based on National Health Expenditure (NHE) projections from the CMS Office of the Actuary.[24] We inflate the ACA’s required premium contributions using the ratio of growth in employer-sponsored insurance spending per enrollee and GDP per capita from the NHE and inflate federal poverty guidelines using consumer price index projections from CBO.
Our examples consider impacts on hypothetical consumers who face premiums equal to their state’s average benchmark premium, taking into account the consumer’s age. We do not model increases in pre-credit premiums that would result from the House plan’s changes to the ACA age rating rules, nor increases that could result from repeal of the individual mandate or other provisions that weaken the individual-market risk pool.
| APPENDIX TABLE 1 | ||||
|---|---|---|---|---|
| Average Tax Credits Under Current Law Versus House Republican Plan Projected Average Tax Credits for Marketplace Consumers, 2020 |
||||
| ACA | House | Difference | Percent Change | |
| Alaska |
13,120
|
2,878
|
-10,243
|
-78%
|
| North Carolina |
8,242
|
2,881
|
-5,360
|
-65%
|
| Oklahoma |
7,508
|
2,866
|
-4,642
|
-62%
|
| Alabama |
7,228
|
2,935
|
-4,293
|
-59%
|
| Nebraska |
7,019
|
2,795
|
-4,224
|
-60%
|
| West Virginia |
7,285
|
3,103
|
-4,183
|
-57%
|
| Wyoming |
6,989
|
2,856
|
-4,133
|
-59%
|
| Tennessee |
6,835
|
2,955
|
-3,880
|
-57%
|
| Arizona |
6,401
|
2,853
|
-3,548
|
-55%
|
| South Dakota |
6,277
|
2,810
|
-3,467
|
-55%
|
| Montana |
6,110
|
2,950
|
-3,160
|
-52%
|
| South Carolina |
5,792
|
2,932
|
-2,860
|
-49%
|
| Louisiana |
5,658
|
2,913
|
-2,744
|
-49%
|
| Maine |
5,519
|
2,970
|
-2,549
|
-46%
|
| Iowa |
5,526
|
3,015
|
-2,512
|
-45%
|
| Delaware |
5,222
|
2,903
|
-2,320
|
-44%
|
| Missouri |
5,216
|
2,903
|
-2,312
|
-44%
|
| Pennsylvania |
5,287
|
2,993
|
-2,294
|
-43%
|
| Mississippi |
5,179
|
2,965
|
-2,214
|
-43%
|
| Florida |
5,107
|
2,918
|
-2,188
|
-43%
|
| Wisconsin |
5,086
|
3,005
|
-2,081
|
-41%
|
| Kansas |
4,852
|
2,880
|
-1,972
|
-41%
|
| Georgia |
4,743
|
2,868
|
-1,875
|
-40%
|
| Illinois |
4,395
|
2,941
|
-1,455
|
-33%
|
| Hawaii |
4,385
|
3,012
|
-1,372
|
-31%
|
| Texas |
4,221
|
2,860
|
-1,361
|
-32%
|
| New Jersey |
4,218
|
2,938
|
-1,280
|
-30%
|
| Virginia |
3,968
|
2,840
|
-1,128
|
-28%
|
| North Dakota |
3,796
|
2,753
|
-1,043
|
-27%
|
| Oregon |
3,918
|
2,968
|
-950
|
-24%
|
| Nevada |
3,688
|
2,891
|
-797
|
-22%
|
| Kentucky |
3,595
|
2,972
|
-622
|
-17%
|
| Arkansas |
3,559
|
2,990
|
-569
|
-16%
|
| Utah |
3,105
|
2,586
|
-519
|
-17%
|
| Michigan |
3,375
|
2,946
|
-429
|
-13%
|
| Ohio |
3,085
|
2,975
|
-110
|
-4%
|
| Indiana |
2,999
|
2,958
|
-41
|
-1%
|
| New Mexico |
3,023
|
3,032
|
9
|
0%
|
| New Hampshire |
2,429
|
2,975
|
546
|
22%
|
| HealthCare.gov state average |
5,002
|
2,942
|
-2,060
|
-41%
|
| APPENDIX TABLE 2 | ||||||
|---|---|---|---|---|---|---|
| Tax Credits and Premiums for a Typical Marketplace Consumer Under Current Law and the House Republican Plan Tax Credits and Premiums for a 45-Year Old with Income of $22,000 (2020) Assumes consumers face their state average benchmark premiums; assumes no changes in pre-credit premiums |
||||||
| Tax Credits | Net Premium | Change in Premiums | Percent Change in Premiums | |||
| ACA | House | ACA | House | |||
| Alaska |
14,036
|
3,000
|
784
|
11,820
|
11,036
|
1408%
|
| North Carolina |
7,514
|
3,000
|
1,183
|
5,697
|
4,514
|
382%
|
| Oklahoma |
7,085
|
3,000
|
1,183
|
5,268
|
4,085
|
345%
|
| Arizona |
7,046
|
3,000
|
1,183
|
5,229
|
4,046
|
342%
|
| Wyoming |
6,871
|
3,000
|
1,183
|
5,054
|
3,871
|
327%
|
| Nebraska |
6,832
|
3,000
|
1,183
|
5,015
|
3,832
|
324%
|
| West Virginia |
6,344
|
3,000
|
1,183
|
4,527
|
3,344
|
283%
|
| Tennessee |
6,325
|
3,000
|
1,183
|
4,508
|
3,325
|
281%
|
| Alabama |
6,305
|
3,000
|
1,183
|
4,488
|
3,305
|
279%
|
| Montana |
6,247
|
3,000
|
1,183
|
4,430
|
3,247
|
275%
|
| South Dakota |
6,110
|
3,000
|
1,183
|
4,293
|
3,110
|
263%
|
| Delaware |
5,584
|
3,000
|
1,183
|
3,767
|
2,584
|
218%
|
| Louisiana |
5,447
|
3,000
|
1,183
|
3,630
|
2,447
|
207%
|
| Pennsylvania |
5,194
|
3,000
|
1,183
|
3,377
|
2,194
|
185%
|
| South Carolina |
5,038
|
3,000
|
1,183
|
3,221
|
2,038
|
172%
|
| Maine |
4,999
|
3,000
|
1,183
|
3,182
|
1,999
|
169%
|
| Iowa |
4,823
|
3,000
|
1,183
|
3,006
|
1,823
|
154%
|
| Kansas |
4,823
|
3,000
|
1,183
|
3,006
|
1,823
|
154%
|
| Missouri |
4,765
|
3,000
|
1,183
|
2,948
|
1,765
|
149%
|
| Wisconsin |
4,745
|
3,000
|
1,183
|
2,928
|
1,745
|
148%
|
| Hawaii |
4,676
|
3,000
|
940
|
2,616
|
1,676
|
178%
|
| Illinois |
4,628
|
3,000
|
1,183
|
2,811
|
1,628
|
138%
|
| Utah |
4,550
|
3,000
|
1,183
|
2,733
|
1,550
|
131%
|
| North Dakota |
4,433
|
3,000
|
1,183
|
2,616
|
1,433
|
121%
|
| Oregon |
4,414
|
3,000
|
1,183
|
2,597
|
1,414
|
120%
|
| New Jersey |
4,394
|
3,000
|
1,183
|
2,577
|
1,394
|
118%
|
| Georgia |
4,141
|
3,000
|
1,183
|
2,324
|
1,141
|
96%
|
| Mississippi |
4,141
|
3,000
|
1,183
|
2,324
|
1,141
|
96%
|
| Florida |
4,082
|
3,000
|
1,183
|
2,265
|
1,082
|
92%
|
| Virginia |
3,965
|
3,000
|
1,183
|
2,148
|
965
|
82%
|
| Texas |
3,907
|
3,000
|
1,183
|
2,090
|
907
|
77%
|
| Kentucky |
3,868
|
3,000
|
1,183
|
2,051
|
868
|
73%
|
| Nevada |
3,673
|
3,000
|
1,183
|
1,856
|
673
|
57%
|
| Arkansas |
3,653
|
3,000
|
1,183
|
1,836
|
653
|
55%
|
| Indiana |
3,283
|
3,000
|
1,183
|
1,466
|
283
|
24%
|
| Michigan |
3,263
|
3,000
|
1,183
|
1,446
|
263
|
22%
|
| Ohio |
3,224
|
3,000
|
1,183
|
1,407
|
224
|
19%
|
| New Mexico |
3,185
|
3,000
|
1,183
|
1,368
|
185
|
16%
|
| New Hampshire |
3,088
|
3,000
|
1,183
|
1,271
|
88
|
7%
|
| Based on HealthCare.gov average premium |
4,706
|
3,000
|
1,183
|
2,889
|
1,706
|
144%
|
End Notes
[1] David Muir, “TRANSCRIPT: ABC News anchor David Muir interviews President Trump,” ABC News, January 25, 2017, http://abcnews.go.com/Politics/transcript-abc-news-anchor-david-muir-interviews-president/story?id=45047602.
[2] Cynthia Cox, Gary Claxton, Larry Levitt, “How Affordable Care Act Repeal and Replace Plans Might Shift Health Insurance Tax Credits,” Kaiser Family Foundation, March 1, 2017, http://kff.org/health-reform/issue-brief/how-affordable-care-act-repeal-and-replace-plans-might-shift-health-insurance-tax-credits/.
[3] See for example, David Cutler et al., “Analysis: GOP plan to cost Obamacare enrollees $1,542 more a year,” Vox, March 7, 2017, http://www.vox.com/the-big-idea/2017/3/7/14843632/aca-republican-health-care-plan-premiums-cost-price and Jeanne Lambrew, “Five Reasons the New House Legislation Could Contribute to a Health Insurance Death Spiral,” The Century Foundation, March 7, 2017, https://tcf.org/content/commentary/five-reasons-new-house-legislation-contribute-health-insurance-death-spiral/. The CEO of Molina, a major marketplace insurer, also predicted that the House plan would raise individual-market premiums by 30 percent next year and more in the future. See Anna Wilde Mathews, “Health Care Companies Find Some Gifts, Some Big Risks in Plan to Replace Obamacare,” Wall Street Journal, March 7, 2017, https://www.wsj.com/articles/what-insurers-like-and-dread-about-gops-plan-to-replace-obamacare-1488906247.
[4] Those states are Alaska, North Carolina, Oklahoma, Alabama, Nebraska, Wyoming, West Virginia, Tennessee, Arizona, South Dakota, and Montana.
[5] HealthCare.gov states likely had higher average premiums in 2017. They are also less likely than states using their own eligibility platforms to have expanded Medicaid, so they have more very low-income consumers in their marketplaces, increasing the average tax credit loss.
[6] The median income of a marketplace consumer is 165 percent of the federal poverty level, or about $22,000 in 2020. See “Health Plan Choice and Premiums in the 2017 Health Insurance Marketplace,” Department of Health and Human Services Office of the Assistant Secretary for Planning and Evaluation, October 24, 2016, https://aspe.hhs.gov/system/files/pdf/212721/2017MarketplaceLandscapeBrief.pdf.
[7] As explained below, these calculations apply to a consumer facing the state average benchmark premium.
[8] Edwin Park, Aviva Aron-Dine, and Matt Broaddus, “House Republican Health Plan Shifts $370 Billion in Medicaid Costs to States,” Center on Budget and Policy Priorities, March 9, 2017, https://www.cbpp.org/research/health/house-republican-health-plan-shifts-370-billion-in-medicaid-costs-to-states.
[9] Office of the Actuary in the Centers for Medicare & Medicaid Services, National Health Expenditure Projections, 2016-2025, https://www.cms.gov/Research-Statistics-Data-and-Systems/Statistics-Trends-and-Reports/NationalHealthExpendData/NationalHealthAccountsProjected.html.
[10] The benchmark premium is the premium for the second-lowest-cost “silver” plan available to a given individual (in her local area, and taking her age into account). Kaiser also provides estimates of tax credit changes under the House plan based on county-level premiums; see “Tax Credits Under the Affordable Care Act vs. the American Health Care Act: An Interactive Map.”
[11] Cox, Claxton, and Levitt.
[12] Linda J. Blumberg, John Holahan, and Erik Wengle, “Are Nongroup Marketplace Premiums Really High? Not in Comparison with Employer Insurance,” Urban Institute, September 2016, http://www.urban.org/sites/default/files/publication/84256/2000931-Are-Nongroup-Marketplace-Premiums-Really-High-Not-in-Comparison-with-Employer-Insurance.pdf.
[13] The Kaiser analysis cited above also excludes off-marketplace consumers.
[14] The House tax credits are phased out starting at an income of $75,000 (or $150,000 for a married couple filing jointly). By ignoring these phaseouts, the calculations in this paper very slightly understate reductions in average tax credits for current marketplace consumers under the House bill.
[15] All figures in these and other examples are for 2020. Because Alaska and Hawaii have separate, higher poverty levels, consumers with income of $22,000 in these states would pay less than $1,000 for benchmark coverage.
[16] Jeanne Lambrew and Ellen Montz, “Five Reasons the New House Legislation Could Contribute to a Health Insurance Death Spiral,” Century Foundation, March 7, 2017, https://tcf.org/content/commentary/five-reasons-new-house-legislation-contribute-health-insurance-death-spiral/.
[17] “Health Insurance Marketplace Premiums After Shopping, Switching, and Premium Tax Credits, 2015-2016,” Department of Health and Human Services Office of the Assistant Secretary for Planning and Evaluation, April 12, 2016, https://aspe.hhs.gov/system/files/pdf/198636/MarketplaceRate.pdf.
[18] Center for Medicare and Medicaid Services, “March 31, 2016 Effectuated Enrollment Snapshot,” June 30, 2016, https://www.cms.gov/Newsroom/MediaReleaseDatabase/Fact-sheets/2016-Fact-sheets-items/2016-06-30.html.
[19] “How Repealing Portions of the Affordable Care Act Would Affect Health Insurance Coverage and Premiums,” Congressional Budget Office, revised January 2017, https://www.cbo.gov/sites/default/files/115th-congress-2017-2018/reports/52371-coverageandpremiums.pdf.
[20] For a discussion of why the House plan’s continuous coverage incentive is an inadequate substitute for the individual mandate, see, for example, Cutler et al., and Avik Roy, “GOP’s Obamacare Repeal Plan Will Make Coverage Unaffordable for Millions – Otherwise, It’s Great,” Forbes, March 7, 2017, https://www.forbes.com/sites/theapothecary/2017/03/07/house-gops-obamacare-replacement-will-make-coverage-unaffordable-for-millions-otherwise-its-great/#7694ece37fdd.
[21] Center for Medicare & Medicaid Services, “Health Insurance Marketplaces 2017 Open Enrollment Period: January Enrollment Report,” January 10, 2017, https://www.cms.gov/Newsroom/MediaReleaseDatabase/Fact-sheets/2017-Fact-Sheet-items/2017-01-10.html. Plan selections in the first eight weeks of open enrollment represented more than 90 percent of total open enrollment plan selections in HealthCare.gov states. CMS reports average tax credit amounts for consumers with tax credits; we convert these to averages for all marketplace consumers.
[22] Congressional Budget Office, “Federal Subsidies Under the Affordable Care Act for Health Insurance Coverage Related to the Expansion of Medicaid and Nongroup Health Insurance: Tables from CBO's January 2017 Baseline,” https://www.cbo.gov/sites/default/files/recurringdata/51298-2017-01-healthinsurance.pdf.
[23] CMS provides data on the number of consumers under age 25, 25-34, 35-44, 45-54, 55-64, and 65 and older. To approximate the number of consumers in each of the House tax credit’s age categories, we assume a uniform age distribution within the CMS age groups.
[24] Premium data are from “Health Plan Choice and Premiums in the 2017 Health Insurance Marketplace,” Department of Health and Human Services Office of the Assistant Secretary for Planning and Evaluation, October 24, 2016, https://aspe.hhs.gov/system/files/pdf/212721/2017MarketplaceLandscapeBrief.pdf. Premium growth rate projections are from Office of the Actuary in the Centers for Medicare & Medicaid Services, National Health Expenditure Projections, 2016-2025, https://www.cms.gov/Research-Statistics-Data-and-Systems/Statistics-Trends-and-Reports/NationalHealthExpendData/NationalHealthAccountsProjected.html.
More from the Authors

Areas of Expertise