House GOP Health Plan Cuts Tax Credits, Raises Costs by Thousands of Dollars for Californians
In More than Half of California’s Counties, Cost Increases for Covered California Enrollees Would Average More Than $4,000
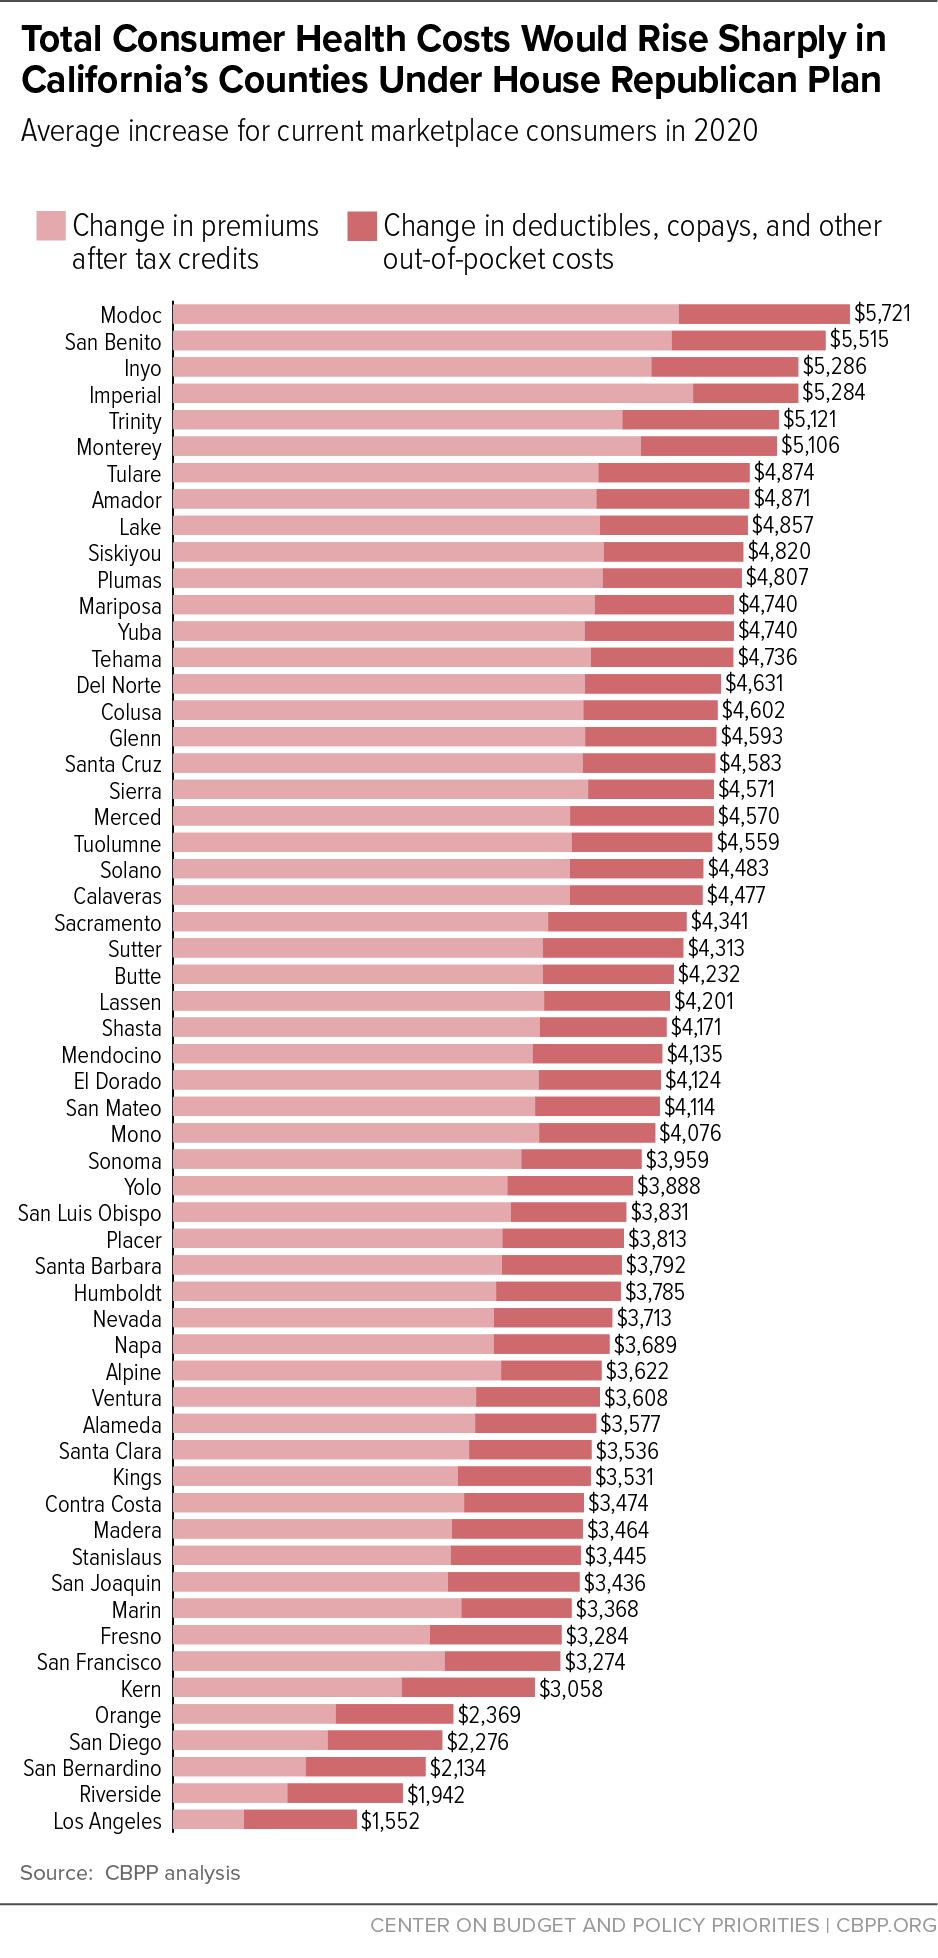
The House Republican legislation to repeal the Affordable Care Act (ACA) would raise total health costs — premiums, deductibles, copays, and coinsurance — by an average of $2,800 in 2020 for people who buy health insurance through California’s marketplace, Covered California.[1]Health costs would rise and premium tax credits would fall for the average Covered California consumer in every county in the state. Health costs would rise and premium tax credits would fall for the average Covered California consumer in every county in the state. Specifically, tax credits that help people pay premiums would fall statewide by an average of $1,500; average premiums would rise by nearly $300; and out-of-pocket costs such as deductibles, copays, and coinsurance would increase by an average of $1,000. Total out-of-pocket cost increases would be larger for people who have lower incomes, are older, or live in high-cost counties: in 32 of California’s 58 counties, average increases would exceed $4,000, and in six counties, average increases would exceed $5,000.
This analysis does not account for additional premium increases and benefit reductions that could occur under the Meadows-MacArthur amendment to the House Republican bill.[2] This amendment would eliminate nationwide protections for people with pre-existing conditions. As they did before the ACA, plans could once again charge people higher premiums based on medical history, eliminate coverage for key health services, and impose annual and lifetime limits on benefits, except in states that were able to continue to prohibit these practices.
The House Plan’s Impact on Tax Credits
The ACA’s premium tax credit varies based on income and the actual cost of insurance available. Low- and moderate-income families without access to other coverage and who are eligible for financial assistance are guaranteed the option to purchase benchmark health insurance for a set percentage of their income, with the premium tax credit covering the remainder. Once the credit’s value is set under this formula, consumers can use the credit to help pay the premium of any qualified health plan offered in their state’s marketplace.
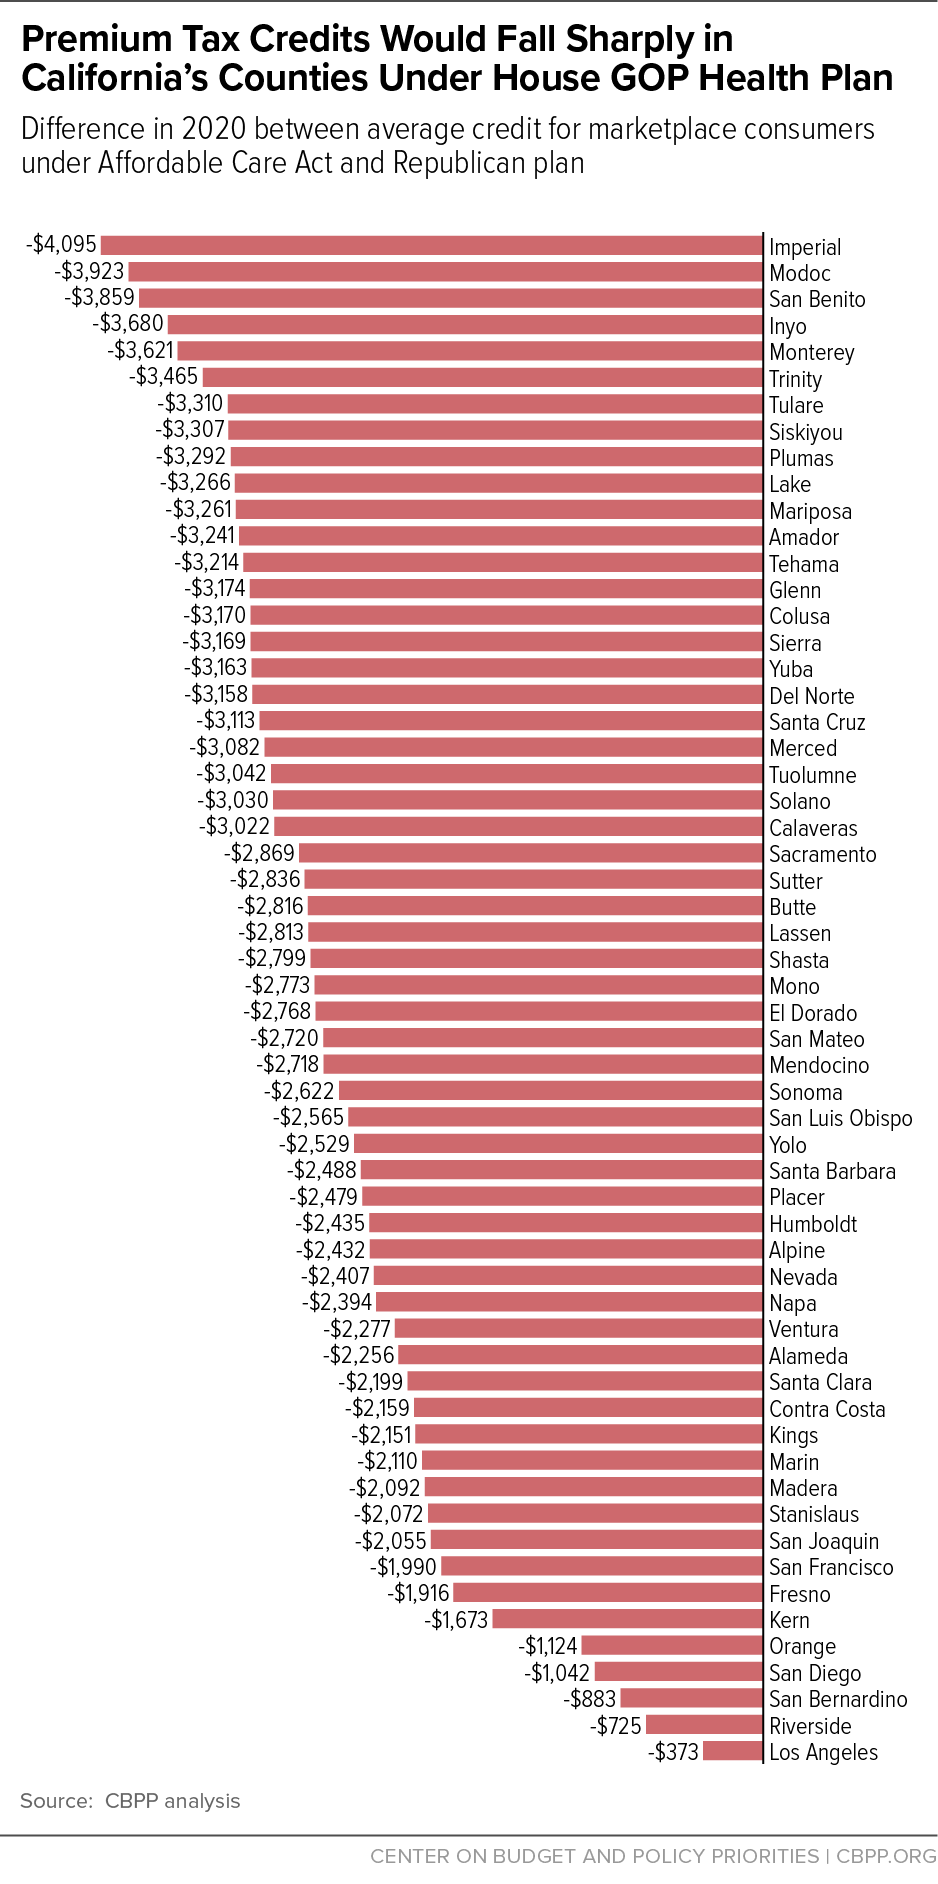
Because the ACA’s premium tax credit is based on the cost of a benchmark plan — an actual plan in the marketplace for someone of the consumer’s age in the consumer’s geographic rating area — it is flexible enough to meet the needs of people who live in high-cost counties, are older, or have lower incomes. The average ACA premium tax credit in California is projected to be about $4,500 in 2020. But because of the large variation in the cost of coverage across the state, tax credits would average nearly $7,200 in Modoc County in the northeastern part of the state and $3,400 in Los Angeles County. Credits also vary significantly by age and income.
By contrast, starting in 2020, the House bill would repeal the ACA premium tax credits and replace them with flat tax credits varying only by age: $2,000 for people under 30, $2,500 for people age 30 to 39, $3,000 for people age 40 to 49, $3,500 for people age 50 to 59, and $4,000 for people age 60 and older. Tax credits would be the same regardless of the local cost of premiums and would generally be the same regardless of income (although they would phase out at higher income levels).
Average tax credits would fall under the House bill by an average of $1,500 (33 percent) for current marketplace consumers in California. Consumers in higher-cost counties would see especially large losses, exceeding $3,000 in 23 counties. In Imperial, Inyo, Modoc, and San Benito counties, average tax credit losses would range from $3,700 to $4,100. (See Figure 1 and Appendix Table 1.)
The House Plan’s Impact on Net Premiums
Some measures in the House bill would increase premiums, while other measures would reduce them. First, the bill would repeal the individual mandate, leading healthier people to drop coverage and raising premiums by 20 percent, all else being equal, according to the Congressional Budget Office (CBO).[3] Second, the bill includes a Patient and State Stability Fund that would provide funding for various measures to reduce premiums.[4] Third, as discussed below, the bill would allow insurers to stop offering lower-deductible plans; the resulting drop in plan generosity and increase in deductibles and other out-of-pocket costs would lower premiums.
Despite Republican claims that their plan would bring down costs, the average “sticker price” for premiums in California would rise by $300 a year, or 4 percent, if the age-mix of Covered California enrollees is held constant. (This estimate is based on CBO’s projections of how premiums would change for people of different ages; we assume that premiums in California would rise by the same percentage CBO projects nationally.[5])
With these premium increases and tax credit reductions, net premiums for Covered California consumers would increase by an average of $1,800. Increases across counties would range from $600 in Los Angeles County to $4,400 in Imperial County.
Net premium changes also would vary substantially by age and income. The House bill would let insurers charge older people much higher premiums and cut older people’s tax credits the most. For a typical 60-year-old Californian making $22,000 a year, premiums (after accounting for tax credits) would rise more than $5,000 in every county and over $10,000 in 38 counties. Even in Los Angeles County, which has the lowest average premium increase in the state, a low-income 60-year-old would be charged nearly $5,300 more in premiums under the Republican plan. Appendix Table 2 shows the net premium impact for people ages 45 and 60 in Covered California plans.
The House Plan’s Impact on Out-of-Pocket and Total Costs
The House bill would make two changes that would increase consumers’ out-of-pocket costs.
First, it would repeal the ACA’s cost-sharing subsidies, which reduce out-of-pocket costs for people with incomes below 250 percent of the poverty line (about $30,000 for a single person, or about $60,000 for a family of four). Under current law, roughly half of Covered California consumers qualify for these subsidies, which entitle them to purchase coverage with lower deductibles and other out-of-pocket costs.[6] Without these subsidies, the national average marketplace deductibles would increase by about $2,800 for single people with incomes below $18,000, by about $2,300 for single people with incomes between $18,000 and $24,000, and by about $600 for single people with incomes between $24,000 and $30,000.[7] The result is that many lower-income people would have difficulty paying the deductibles and other cost-sharing necessary to use their coverage.
The House bill would also increase deductibles and other out-of-pocket costs for people with incomes above 250 percent of the poverty line, who don’t get cost-sharing subsidies under the ACA. By repealing the actuarial value “tiers,” the bill effectively eliminates the ACA’s requirement that insurers offer consumers the choice of a lower-deductible plan, which CBO projects would lead many insurers to offer only high-deductible options. As a result, CBO concludes, “individuals’ cost-sharing payments, including deductibles, in the nongroup market would tend to be higher than those anticipated under current law.”[8] Specifically, CBO estimates that under the House bill, the average actuarial value of marketplace plans — the share of costs covered by the plan, as compared to the share borne by the consumer through deductibles and other cost sharing — would fall to 65 percent, from about 70 percent today. That change would increase average costs by hundreds of dollars per Covered California consumer.[9]
Overall, the House bill would increase out-of-pocket costs by an average of more than $1,000 for current Covered California consumers. These increases would be concentrated among people with incomes below 250 percent of the poverty line, who make up the majority of marketplace consumers.
Figure 2 and Appendix Table 1 show the combined impact of the House bill’s increases in net premiums and out-of-pocket costs by county. Covered California consumers in every county would see higher costs, on average. Where two counties would see increases in total costs averaging less than $2,000, 32 counties would see increases of more than $4,000, and six counties (Modoc, San Benito, Inyo, Imperial, Trinity, and Monterey) would see average increases of more than $5,000. While higher-income and younger consumers would see lower-than-average increases, or cost decreases, many lower-income and older consumers would see even larger increases than their county averages.
Appendix: Methodology
Our projections for premiums, tax credits, and out-of-pocket costs under the ACA and the House bill draw on data on actual premiums, tax credits, cost-sharing reduction payments, and consumer demographics for California in 2016 issued by Covered California, the state’s insurance marketplace under the Affordable Care Act (ACA), and current law projections and estimates of the House bill from the Congressional Budget Office (CBO) and the Centers for Medicare & Medicaid Services (CMS) Office of the Actuary.
Premiums. We obtain data on 2016 average and benchmark marketplace premiums by county in California from Covered California.[10] To project premiums for 2020, we inflate 2016 premiums to 2020 using National Health Expenditure (NHE) projections from the CMS Office of the Actuary.[11] To project premiums under the House bill for different age groups, we follow the approach described in a recent Brookings analysis to convert CBO’s estimated changes in premiums for people age 21, 40, and 64 into a complete forecast of premium changes by age under the House bill.[12] We compute the change in the average premium for current marketplace consumers by computing average current-law and House-bill premiums using the current marketplace age distribution. We assume that the percentage increases in premiums under the House bill are the same in each county in California as those across the nation.
Tax credits. We obtain data on 2016 average premium tax credits by county from Covered California.[13] We inflate these tax credits to 2020 based on CBO’s projected growth in average premium tax credits.[14] We then compute tax credits under the House plan in 2020 based on the age distribution of each county’s 2016 marketplace plan selections.[15] To calculate tax credits for hypothetical consumers, we follow the approach used in a recent Kaiser Family Foundation analysis.[16] Specifically, we inflate the ACA’s required premium contributions using the ratio of growth in employer-sponsored insurance spending per enrollee and GDP per capita from the NHE and inflate federal poverty guidelines using consumer price index projections from CBO. For hypothetical consumer examples, we assume consumers face premiums equal to the average benchmark (second lowest cost silver plan) premium in the premium rating area appropriate to their county.
Out-of-pocket cost increases. We obtain data on 2016 average cost-sharing reductions by county from Covered California.[17] We inflate cost-sharing reductions to 2020 based on CBO’s projected growth in average cost-sharing reduction amounts. To calculate the additional increase in cost sharing due to the reduction in plan actuarial value, we compare CBO’s estimate of the average actuarial value under the House bill (65 percent) to average actuarial values across states in 2015 (the latest data available); the average actuarial value in most states was close to 70 percent.[18] We calculate the expected out-of-pocket cost increase from reducing actuarial value from 70 to 65 percent as 5 percent * county average premium * 80 percent (where the 80 percent factor approximates the share of the plan premium that pays for administrative versus claims costs).
| APPENDIX TABLE 1 | |||||
|---|---|---|---|---|---|
| Changes in Total Costs for Covered California Consumers Under House Republican Health Plan, Compared to Current Law (Affordable Care Act) Projections for 2020 for all California counties; average across current marketplace consumers |
|||||
| AHCA Premium Increase* | Reduction in Tax Credits | Increase in Enrollee Net Premium | Cost Sharing Increase | Increase in Total Costs | |
| Alameda | 298 | -2,256 | 2,554 | 1,022 | 3,577 |
| Alpine | 342 | -2,432 | 2,775 | 848 | 3,622 |
| Amador | 339 | -3,241 | 3,579 | 1,291 | 4,871 |
| Butte | 308 | -2,816 | 3,124 | 1,108 | 4,232 |
| Calaveras | 334 | -3,022 | 3,356 | 1,121 | 4,477 |
| Colusa | 299 | -3,170 | 3,469 | 1,134 | 4,602 |
| Contra Costa | 303 | -2,159 | 2,462 | 1,012 | 3,474 |
| Del Norte | 325 | -3,158 | 3,483 | 1,148 | 4,631 |
| El Dorado | 324 | -2,768 | 3,092 | 1,032 | 4,124 |
| Fresno | 256 | -1,916 | 2,173 | 1,112 | 3,284 |
| Glenn | 310 | -3,174 | 3,484 | 1,109 | 4,593 |
| Humboldt | 297 | -2,435 | 2,732 | 1,053 | 3,785 |
| Imperial | 301 | -4,095 | 4,396 | 888 | 5,284 |
| Inyo | 363 | -3,680 | 4,044 | 1,242 | 5,286 |
| Kern | 260 | -1,673 | 1,933 | 1,125 | 3,058 |
| Kings | 259 | -2,151 | 2,410 | 1,121 | 3,531 |
| Lake | 343 | -3,266 | 3,610 | 1,247 | 4,857 |
| Lassen | 324 | -2,813 | 3,137 | 1,064 | 4,201 |
| Los Angeles | 227 | -373 | 599 | 953 | 1,552 |
| Madera | 267 | -2,092 | 2,359 | 1,105 | 3,464 |
| Marin | 328 | -2,110 | 2,437 | 931 | 3,368 |
| Mariposa | 303 | -3,261 | 3,565 | 1,175 | 4,740 |
| Mendocino | 322 | -2,718 | 3,040 | 1,095 | 4,135 |
| Merced | 276 | -3,082 | 3,358 | 1,212 | 4,570 |
| Modoc | 351 | -3,923 | 4,274 | 1,447 | 5,721 |
| Mono | 322 | -2,773 | 3,096 | 980 | 4,076 |
| Monterey | 335 | -3,621 | 3,955 | 1,151 | 5,106 |
| Napa | 316 | -2,394 | 2,710 | 978 | 3,689 |
| Nevada | 307 | -2,407 | 2,714 | 999 | 3,713 |
| Orange | 251 | -1,124 | 1,375 | 994 | 2,369 |
| Placer | 306 | -2,479 | 2,784 | 1,028 | 3,813 |
| Plumas | 339 | -3,292 | 3,631 | 1,175 | 4,807 |
| Riverside | 242 | -725 | 968 | 974 | 1,942 |
| Sacramento | 303 | -2,869 | 3,172 | 1,169 | 4,341 |
| San Benito | 357 | -3,859 | 4,216 | 1,299 | 5,515 |
| San Bernardino | 240 | -883 | 1,123 | 1,011 | 2,134 |
| San Diego | 265 | -1,042 | 1,307 | 969 | 2,276 |
| San Francisco | 306 | -1,990 | 2,296 | 978 | 3,274 |
| San Joaquin | 270 | -2,055 | 2,325 | 1,111 | 3,436 |
| San Luis Obispo | 293 | -2,565 | 2,857 | 974 | 3,831 |
| San Mateo | 341 | -2,720 | 3,061 | 1,053 | 4,114 |
| Santa Barbara | 293 | -2,488 | 2,781 | 1,011 | 3,792 |
| Santa Clara | 306 | -2,199 | 2,505 | 1,032 | 3,536 |
| Santa Cruz | 351 | -3,113 | 3,464 | 1,119 | 4,583 |
| Shasta | 300 | -2,799 | 3,100 | 1,071 | 4,171 |
| Sierra | 341 | -3,169 | 3,510 | 1,061 | 4,571 |
| Siskiyou | 335 | -3,307 | 3,642 | 1,179 | 4,820 |
| Solano | 325 | -3,030 | 3,355 | 1,128 | 4,483 |
| Sonoma | 324 | -2,622 | 2,946 | 1,013 | 3,959 |
| Stanislaus | 275 | -2,072 | 2,347 | 1,098 | 3,445 |
| Sutter | 288 | -2,836 | 3,124 | 1,189 | 4,313 |
| Tehama | 320 | -3,214 | 3,534 | 1,202 | 4,736 |
| Trinity | 334 | -3,465 | 3,800 | 1,321 | 5,121 |
| Tulare | 287 | -3,310 | 3,597 | 1,277 | 4,874 |
| Tuolumne | 328 | -3,042 | 3,370 | 1,189 | 4,559 |
| Ventura | 287 | -2,277 | 2,564 | 1,044 | 3,608 |
| Yolo | 299 | -2,529 | 2,828 | 1,061 | 3,888 |
| Yuba | 317 | -3,163 | 3,480 | 1,259 | 4,740 |
| Average, California | 268 | -1,499 | 1,767 | 1,013 | 2,779 |
| APPENDIX TABLE 2 | |||||||
|---|---|---|---|---|---|---|---|
| Premiums Accounting for Tax Credits for Covered California Consumers Under Current Law (Affordable Care Act) and House Republican Health Plan Premiums accounting for tax credits for consumers with incomes of $22,000 (2020) |
|||||||
| 45-Year-Old Net Premium |
60-Year-Old Net Premium |
||||||
| ACA | House | Increase in Premiums |
ACA | House | Increase in Premiums |
||
| Alameda | 1,183 | 3,842 | 2,659 | 1,183 | 12,046 | 10,864 | |
| Alpine | 1,183 | 3,539 | 2,357 | 1,183 | 11,337 | 10,154 | |
| Amador | 1,183 | 3,539 | 2,357 | 1,183 | 11,337 | 10,154 | |
| Butte | 1,183 | 3,539 | 2,357 | 1,183 | 11,337 | 10,154 | |
| Calaveras | 1,183 | 3,539 | 2,357 | 1,183 | 11,337 | 10,154 | |
| Colusa | 1,183 | 3,539 | 2,357 | 1,183 | 11,337 | 10,154 | |
| Contra Costa | 1,183 | 3,667 | 2,484 | 1,183 | 11,635 | 10,453 | |
| Del Norte | 1,183 | 3,539 | 2,357 | 1,183 | 11,337 | 10,154 | |
| El Dorado | 1,183 | 3,886 | 2,704 | 1,183 | 12,151 | 10,968 | |
| Fresno | 1,183 | 2,629 | 1,447 | 1,183 | 9,203 | 8,020 | |
| Glenn | 1,183 | 3,539 | 2,357 | 1,183 | 11,337 | 10,154 | |
| Humboldt | 1,183 | 3,539 | 2,357 | 1,183 | 11,337 | 10,154 | |
| Imperial | 1,183 | 3,070 | 1,887 | 1,183 | 10,236 | 9,053 | |
| Inyo | 1,183 | 3,070 | 1,887 | 1,183 | 10,236 | 9,053 | |
| Kern | 1,183 | 2,236 | 1,053 | 1,183 | 8,281 | 7,098 | |
| Kings | 1,183 | 2,629 | 1,447 | 1,183 | 9,203 | 8,020 | |
| Lake | 1,183 | 3,539 | 2,357 | 1,183 | 11,337 | 10,154 | |
| Lassen | 1,183 | 3,539 | 2,357 | 1,183 | 11,337 | 10,154 | |
| Los Angeles | 1,183 | 1,453 | 271 | 1,183 | 6,445 | 5,262 | |
| Madera | 1,183 | 2,629 | 1,447 | 1,183 | 9,203 | 8,020 | |
| Marin | 1,183 | 4,017 | 2,835 | 1,183 | 12,458 | 11,275 | |
| Mariposa | 1,183 | 2,965 | 1,782 | 1,183 | 9,989 | 8,806 | |
| Mendocino | 1,183 | 3,539 | 2,357 | 1,183 | 11,337 | 10,154 | |
| Merced | 1,183 | 2,965 | 1,782 | 1,183 | 9,989 | 8,806 | |
| Modoc | 1,183 | 3,539 | 2,357 | 1,183 | 11,337 | 10,154 | |
| Mono | 1,183 | 3,070 | 1,887 | 1,183 | 10,236 | 9,053 | |
| Monterey | 1,183 | 4,509 | 3,327 | 1,183 | 13,612 | 12,429 | |
| Napa | 1,183 | 4,017 | 2,835 | 1,183 | 12,458 | 11,275 | |
| Nevada | 1,183 | 3,539 | 2,357 | 1,183 | 11,337 | 10,154 | |
| Orange | 1,183 | 2,321 | 1,138 | 1,183 | 8,479 | 7,296 | |
| Placer | 1,183 | 3,886 | 2,704 | 1,183 | 12,151 | 10,968 | |
| Plumas | 1,183 | 3,539 | 2,357 | 1,183 | 11,337 | 10,154 | |
| Riverside | 1,183 | 1,659 | 476 | 1,183 | 6,927 | 5,744 | |
| Sacramento | 1,183 | 3,886 | 2,704 | 1,183 | 12,151 | 10,968 | |
| San Benito | 1,183 | 4,509 | 3,327 | 1,183 | 13,612 | 12,429 | |
| San Bernardino | 1,183 | 1,659 | 476 | 1,183 | 6,927 | 5,744 | |
| San Diego | 1,183 | 2,279 | 1,096 | 1,183 | 8,381 | 7,198 | |
| San Francisco | 1,183 | 3,913 | 2,730 | 1,183 | 12,213 | 11,030 | |
| San Joaquin | 1,183 | 2,965 | 1,782 | 1,183 | 9,989 | 8,806 | |
| San Luis Obispo | 1,183 | 3,393 | 2,210 | 1,183 | 10,993 | 9,810 | |
| San Mateo | 1,183 | 4,368 | 3,185 | 1,183 | 13,281 | 12,098 | |
| Santa Barbara | 1,183 | 3,393 | 2,210 | 1,183 | 10,993 | 9,810 | |
| Santa Clara | 1,183 | 3,595 | 2,412 | 1,183 | 11,468 | 10,285 | |
| Santa Cruz | 1,183 | 4,509 | 3,327 | 1,183 | 13,612 | 12,429 | |
| Shasta | 1,183 | 3,539 | 2,357 | 1,183 | 11,337 | 10,154 | |
| Sierra | 1,183 | 3,539 | 2,357 | 1,183 | 11,337 | 10,154 | |
| Siskiyou | 1,183 | 3,539 | 2,357 | 1,183 | 11,337 | 10,154 | |
| Solano | 1,183 | 4,017 | 2,835 | 1,183 | 12,458 | 11,275 | |
| Sonoma | 1,183 | 4,017 | 2,835 | 1,183 | 12,458 | 11,275 | |
| Stanislaus | 1,183 | 2,965 | 1,782 | 1,183 | 9,989 | 8,806 | |
| Sutter | 1,183 | 3,539 | 2,357 | 1,183 | 11,337 | 10,154 | |
| Tehama | 1,183 | 3,539 | 2,357 | 1,183 | 11,337 | 10,154 | |
| Trinity | 1,183 | 3,539 | 2,357 | 1,183 | 11,337 | 10,154 | |
| Tulare | 1,183 | 2,965 | 1,782 | 1,183 | 9,989 | 8,806 | |
| Tuolumne | 1,183 | 3,539 | 2,357 | 1,183 | 11,337 | 10,154 | |
| Ventura | 1,183 | 3,393 | 2,210 | 1,183 | 10,993 | 9,810 | |
| Yolo | 1,183 | 3,886 | 2,704 | 1,183 | 12,151 | 10,968 | |
| Yuba | 1,183 | 3,539 | 2,357 | 1,183 | 11,337 | 10,154 | |
End Notes
[1] This paper analyzes H.R. 1628, the American Health Care Act, incorporating the manager’s amendments, as scored by the Congressional Budget Office on March 23, 2017. Our analysis uses the same methods as an earlier paper on the effect of the Republican plan in the states that use the HealthCare.gov platform. See Aviva Aron-Dine and Tara Straw, “House GOP Health Bill Still Cuts Tax Credits, Raises Costs by Thousands of Dollars for Millions of People,” Center on Budget and Policy Priorities, March 22, 2017, https://www.cbpp.org/research/health/house-gop-health-bill-still-cuts-tax-credits-raises-costs-by-thousands-of-dollars. The analysis is also similar to those of the Kaiser Family Foundation and the Center for American Progress. See Cynthia Cox, Gary Claxton, and Larry Levitt, “How Affordable Care Act Repeal and Replace Plans Might Shift Health Insurance Tax Credits,” Kaiser Family Foundation, March 10, 2017, http://kff.org/health-reform/issue-brief/how-affordable-care-act-repeal-and-replace-plans-might-shift-health-insurance-tax-credits/, and David Cutler, Topher Spiro, and Emily Gee, “The Impact of the House ACA Repeal Bill on Enrollees’ Costs,” Center for American Progress, March 16, 2017, https://www.americanprogress.org/issues/healthcare/reports/2017/03/16/428418/impact-house-aca-repeal-bill-enrollees-costs/.
[2] Aviva Aron-Dine, Edwin Park, and Jacob Leibenluft, “Amendment to the House ACA Repeal Bill Guts Protections for People with Pre-Existing Conditions,” Center on Budget and Policy Priorities, updated April 27, 2017, https://www.cbpp.org/research/health/amendment-to-house-aca-repeal-bill-guts-protections-for-people-with-pre-existing.
[3] Congressional Budget Office, “Repeal the Individual Mandate,” December 8, 2016, https://www.cbo.gov/budget-options/2016/52232.
[4] See Sarah Lueck, “House Republican Plan Needs $100 Billion Fund to Maintain Individual Insurance Market,” Center on Budget and Policy Priorities, March 15, 2017, https://www.cbpp.org/blog/house-republican-plan-needs-100-billion-fund-to-maintain-individual-insurance-market.
[5] Matthew Fiedler and Loren Adler, “How Will House GOP Plan Affect Individual Market Premiums?” Brookings Institution, March 16, 2017, https://www.brookings.edu/blog/up-front/2017/03/16/how-will-the-house-gop-health-care-bill-affect-individual-market-premiums/.
[6] Wesley Yin and Richard Domurat, “Evaluating the Potential Consequences of Terminating Direct Federal Cost-Sharing Reduction (CSR) Funding,” Covered California, January 26, 2017, http://www.coveredca.com/news/pdfs/CoveredCA_Consequences_of_Terminating_CSR.pdf.
[7] Commonwealth Fund, “The ACA’s Cost-Sharing Reduction Plans: A Key to Affordable Health Coverage for Millions of U.S. Workers,” October 13, 2016, http://www.commonwealthfund.org/publications/issue-briefs/2016/oct/aca-cost-sharing-reduction-plans.
[8] Congressional Budget Office, “Cost Estimate for the American Health Care Act,” March 13, 2017, https://www.cbo.gov/system/files/115th-congress-2017-2018/costestimate/americanhealthcareact.pdf.
[9] The AV for metal tiers is specified in state law with variation limited to plus or minus 2 percent of the standard AV. California Health and Safety Code Section 1367.008. As such, it would take a change in state law to implement this federal provision. However, state lawmakers would likely face enormous pressure to adopt this change since it would lower premiums.
[10] Data on benchmark premiums are from Covered California, “2016 Product Prices for All Health Insurance Companies,” November 24, 2015, http://hbex.coveredca.com/data-research/. Data on average premiums per county are from Covered California, “2016 Bringing Health Care Coverage Within Reach (financial assistance statistics),” March 11, 2017, http://hbex.coveredca.com/data-research/.
[11] Premium growth-rate projections are from Office of the Actuary in the Centers for Medicare & Medicaid Services, National Health Expenditure Projections, 2016-2025, https://www.cms.gov/Research-Statistics-Data-and-Systems/Statistics-Trends-and-Reports/NationalHealthExpendData/NationalHealthAccountsProjected.html.
[12] Fiedler and Adler.
[13] Data on average premium tax credits per county are from Covered California, “2016 Bringing Health Care Coverage Within Reach (financial assistance statistics).”
[14] Congressional Budget Office, “Federal Subsidies Under the Affordable Care Act for Health Insurance Coverage Related to the Expansion of Medicaid and Nongroup Health Insurance: Tables from CBO’s January 2017 Baseline,” https://www.cbo.gov/sites/default/files/recurringdata/51298-2017-01-healthinsurance.pdf; and, “Federal Subsidies Under the Affordable Care Act for Health Insurance Coverage Related to the Expansion of Medicaid and Nongroup Health Insurance: Tables from CBO’s January 2016 Baseline,” https://www.cbo.gov/sites/default/files/recurringdata/51298-2016-03-healthinsurance.pdf.
[15] Covered California, “2016 Active Member March Profile,” http://hbex.coveredca.com/data-research/.
[16] Cox, Claxton, and Levitt.
[17] Data on average cost-sharing reductions per county are from Covered California, “2016 Bringing Health Care Coverage Within Reach (financial assistance statistics).”
[18] Centers for Medicare & Medicaid Services, “Summary Report on Transitional Reinsurance Payments and Permanent Risk Adjustment Transfers for the 2015 Benefit Year: Appendix A,” June 30, 2016, https://www.cms.gov/CCIIO/Programs-and-Initiatives/Premium-Stabilization-Programs/.
More from the Authors

Areas of Expertise