ACA Repeal Would Lavish Medicare Tax Cuts on 400 Highest-Income Households
Each Would Get Average Tax Cut of About $7 Million a Year
Republicans’ planned bill to repeal the Affordable Care Act (ACA), which is expected to be similar to the repeal bill that President Obama vetoed in January 2016, would provide an immediate windfall tax cut to the highest-income Americans while raising taxes significantly on about 7 million low- and moderate-income families.
First, it would eliminate two Medicare taxes — the additional Hospital Insurance tax and the Medicare tax on unearned income — that both fall only on high-income filers, thereby cutting taxes substantially for those at the top.
- The top 400 highest-income taxpayers — whose annual incomes average more than $300 million apiece — each would receive an average annual tax cut of about $7 million, we estimate from Internal Revenue Service (IRS) data.
- This group’s tax cut would total about $2.8 billion a year.
- The roughly 160 million households with incomes below $200,000 would get nothing from the repeal of these two taxes.
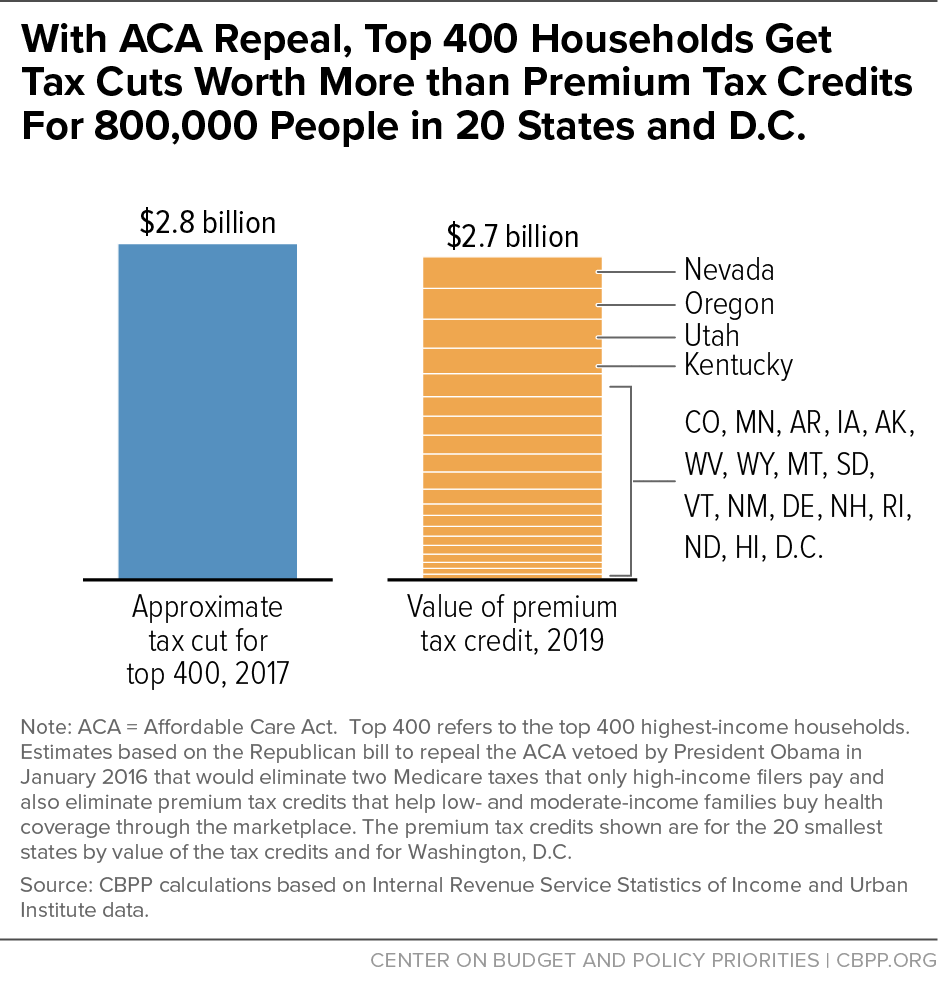
Second, ACA repeal would significantly raise taxes on about 7 million low- and moderate-income families due to the loss of their premium tax credits — worth an average of $4,800 in 2017 — that help them buy health coverage through the health insurance marketplaces and afford to go to the doctor when needed.[1]The total tax cut for the top 400 is roughly the value of premium tax credits that people in the 20 smallest states and DC would lose.
- The $2.8 billion a year total tax cut for the top 400, as noted above, is roughly the value of premium tax credits that 813,000 people in the 20 smallest states and Washington, D.C. would lose combined if the ACA is repealed without a replacement.[2] (See Figure 1.)
400 Highest-Income Households Would Receive Tax Cut Windfall
The ACA’s Medicare taxes fall only on individuals with incomes above $200,000 and couples with incomes above $250,000.
These individuals and couples pay an additional 0.9 percent Hospital Insurance tax on earnings above those amounts, raising the employee share of their Medicare tax rate on earnings to 2.35 percent, from 1.45. They also pay a 3.8 percent Medicare tax on unearned income above those thresholds that’s derived from wealth, such as capital gains, dividends, taxable interest, and royalties.
Before health reform, Medicare taxes applied only to wage and salary and self-employment income, not to unearned income from wealth. For low- and moderate-income working families, which have little unearned income, this meant that Medicare taxes applied to virtually all of their income. In contrast, the wealthiest taxpayers owed no Medicare taxes on their unearned income, which represents a significant share of their income.
| By the Numbers: Top 400 Highest-Income Filers Under Repeal of Affordable Care Act Medicare Taxes | |
|---|---|
| Average annual income: | $318 million |
| Average annual tax cut from repeal of the ACA’s Medicare taxes: | $7 million |
| Total annual tax cut for this group from repeal of the ACA’s Medicare taxes: | $2.8 billion |
Repealing the two ACA Medicare taxes, particularly the 3.8 percent tax on investment and other unearned income, delivers tax cuts that are extremely tilted to the top, as we explained in a previous analysis using Urban-Brookings Tax Policy Center (TPC) estimates.[3] In fact, the 0.4 percent of households with income of over $1 million a year would reap 80 percent of the benefits of repealing these two provisions in 2017.
In this analysis, we use IRS data to examine in further detail the benefits flowing to the very highest income households — the top 400 filers, whose adjusted gross incomes averaged about $318 million in 2014 (the last year for which data are available).[4] More than three-quarters of their income in 2014 — a total of $96 billion for the 400 as a group — came from capital gains, dividends, and taxable interest income.[5]
If the top 400 had similar income levels and sources of income in 2017 and the ACA’s Medicare taxes on high-income households are repealed:
- The top 400 filers will receive tax cuts averaging roughly $7 million apiece;[6] and
- They will receive a net total of about $2.8 billion in tax cuts — roughly $28 billion over ten years if these levels remain similar.
- The $2.8 billion a year that will go to this group is roughly the value of premium tax credits to purchase health insurance that 813,000 people in the 20 smallest states and Washington, D.C. would lose combined if the ACA is repealed without a replacement.[7]
- The tax cuts for the top 400 would raise their incomes after federal income taxes by almost 3 percent.[8]
These estimates are not precise because incomes and income sources for the highest-income taxpayers can be volatile from year to year. For instance, most high-income taxpayers have substantial control over when they “realize” their capital gains income — that is, they can choose when to sell assets that have grown in value. This flexibility leads to variations in unearned income for this group, as they make decisions based on personal financial or economic conditions each year or changes in the tax code, which can affect the share of their income derived from unearned income. In general, the incomes of this group are sensitive to economic conditions, although they have tended to rise over time.
Finally, beyond eliminating these two Medicare taxes, the Republican plan to repeal ACA is expected to include other tax cuts that will benefit the top 400. Republicans also plan to move a broader tax package this year, and the tax proposals from both the House GOP (in its “Better Way” plan issued last June) and President-elect Trump include large, additional net tax cuts heavily focused on the most well-off. These include such proposals as sharply reducing the top business and individual income tax rates and repealing the estate tax.[9]
End Notes
[1] We have previously discussed the overall impact of the repeal of the ACA tax provisions in Chye-Ching Huang and Paul N. Van de Water, “Millionaires the Big Winners From Repealing the Affordable Care Act, New Data Show,” Center on Budget and Policy Priorities, December 15, 2016, https://www.cbpp.org/research/federal-tax/millionaires-the-big-winners-from-repealing-the-affordable-care-act-new-data.
[2] The 20 smallest states by value of premium tax credits. Estimate based on the value of premium tax credits by state in 2019 from: Linda Blumberg, Matthew Buettgens, and John Holahan, “Implications of Partial Repeal of the ACA Through Reconciliation,” Urban Institute, December 6, 2016, http://www.urban.org/research/publication/implications-partial-repeal-aca-through-reconciliation.
[3] For more on the ACA Medicare taxes, see: Chye-Ching Huang, Chuck Marr, and Emily Horton, “Eliminating Two ACA Medicare Taxes Means Very Large Tax Cuts for High Earners and the Wealthy,” Center on Budget and Policy Priorities, updated January 11, 2017, https://www.cbpp.org/research/federal-tax/eliminating-two-aca-medicare-taxes-means-very-large-tax-cuts-for-high-earners.
[4] Note that the IRS and TPC estimates are not completely comparable because the IRS figures use adjusted gross income (AGI) as reported on tax returns, while TPC estimates use an “expanded cash income” measure that is based on AGI but includes a number of other sources of income, such as contributions to health insurance and retirement accounts. See: Tax Policy Center, “Income Measure Used in Distributional Analyses by the Tax Policy Center,” http://www.taxpolicycenter.org/resources/income-measure-used-distributional-analyses-tax-policy-center.
[5] By contrast, taxpayers with AGIs above $1 million derived about 40 percent of their income from these sources in 2014; taxpayers with AGIs between $50,000 and $75,000 received about 3 percent of their income from these sources. IRS Statistics of Income, Individual Statistical Tables by Size of Adjusted Gross Income, Table 1.4, https://www.irs.gov/uac/soi-tax-stats-individual-statistical-tables-by-size-of-adjusted-gross-income. The $96 billion in capital gains, dividends, and taxable interest income that went to the top 400 (just 0.0003 percent of households) represents about 9 percent of all capital gains, dividends, and taxable interest income that year.
[6] Although nearly all of the income of the top 400 filers exceeds the thresholds for the ACA Medicare taxes, their unearned income includes capital gains income from some types of partnership and S corporation income that is not subject to these taxes. This means that simply applying the tax rates for the ACA Medicare taxes to their income above the thresholds would overstate the tax cut they would receive from repealing the taxes. For this reason, we estimate the tax cut received by the top 400 taxpayers using IRS data on sources of income as well as data on the actual Medicare taxes paid by households with incomes of $10 million or more (of which the top 400 is a subset) in 2014.
As detailed below, we calculate that the unearned income of the top 400 represents 32 percent of the unearned income of those with incomes of $10 million or more and apply that 32 percent ratio to the $8.3 billion of Medicare taxes on unearned income paid by those with incomes of $10 million or more, in order to calculate the share of this tax that the top 400 pay. We do similar calculations for the 0.9 percent Hospital Insurance tax and combine the estimates to determine the total tax cut received by the top 400 from repealing these two Medicare tax provisions. The calculations are as follows:
$96 billion (total unearned income for top 400) / $302 billion (total unearned income for households with incomes of $10 million or more) = 32 percent share
32 percent * $8.3 billion (Medicare tax on unearned income paid by households with incomes of $10 million or more in 2014) = $2.6 billion total tax cut for top 400 from repealing the Medicare tax on unearned income, or $6.6 million average tax cut per household in the top 400
$31 billion (other income for top 400) / $207 billion (other income for households with incomes of $10 million or more) = 15 percent share
15 percent * $858 million (additional 0.9 percent Hospital Insurance tax paid by households with incomes of $10 million or more in 2014) = $129 million tax cut from repealing additional 0.9 percent Hospital Insurance tax, or $322,000 average tax cut per household in top 400
$2.6 billion + $129 million = $2.8 billion total Medicare tax cut, or $6.9 million each on average for the top 400
Source: CBPP calculations based on IRS Statistics of Income Tables 1.4 and 3.3.
[7] The 20 smallest states by value of premium tax credits. Estimate based on the value of premium tax credits by state in 2019 from: Linda Blumberg, Matthew Buettgens, and John Holahan, “Implications of Partial Repeal of the ACA Through Reconciliation,” Urban Institute, December 6, 2016, http://www.urban.org/research/publication/implications-partial-repeal-aca-through-reconciliation.
[8] $6.6 million (average income tax cut) / $244 million (average AGI less average federal income taxes paid) = 2.7 percent average increase in income after federal income taxes
[9] See Chuck Marr and Chye-Ching Huang, “House GOP “A Better Way” Tax Cuts Would Overwhelmingly Benefit Top 1 Percent While Sharply Expanding Deficits,” Center on Budget and Policy Priorities, September 16, 2016, https://www.cbpp.org/research/federal-tax/house-gop-a-better-way-tax-cuts-would-overwhelmingly-benefit-top-1-percent; and Robert Greenstein, Chye-Ching Huang, and Isaac Shapiro, “Revised Trump Tax Plan Heavily Tilted Toward Wealthiest, Tax Policy Center Analysis Shows,” Center on Budget and Policy Priorities, October 11, 2016, https://www.cbpp.org/research/federal-tax/revised-trump-tax-plan-heavily-tilted-toward-wealthiest-tax-policy-center.
More from the Authors


Areas of Expertise