House GOP Budget Gets 62 Percent of Budget Cuts From Low- and Moderate-Income Programs
Slashes These Programs by Two-Fifths in 2026
The House Republican budget plan, which could come to the House floor in April, would prove especially harmful to low- and moderate-income families and individuals, cutting programs for such people by an unprecedented amount while taking a strikingly unbalanced approach to deficit reduction. It also would be inconsistent with statements of Republican leaders like House Speaker Paul Ryan that reducing poverty is a top priority.
The GOP budget is inconsistent with statements of Republican leaders that reducing poverty is a top priority.Specifically, the plan, which the House Budget Committee approved on March 16, would cut programs for low- and moderate-income people by about $3.7 trillion over the next decade. In 2026, it would cut such programs overall by 42 percent — causing tens of millions of people to lose health coverage and millions to lose basic food or other support.
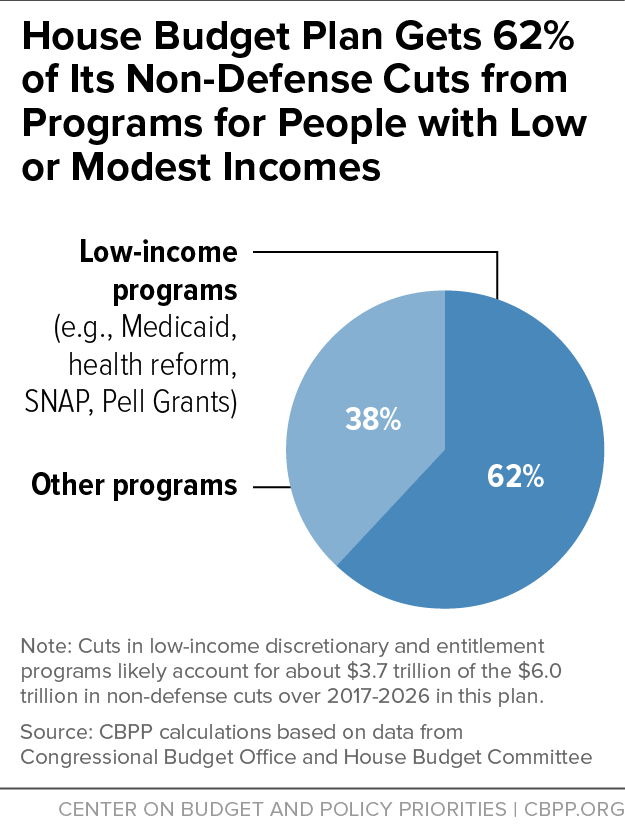
In addition, the plan would secure 62 percent of its budget cuts from low-income programs even though they account for just 28 percent of total non-defense program spending (and just 24 percent of total program spending, including defense).
While cutting supports and services severely for Americans of lesser means, the budget would secure no deficit reduction at all from the more than $1 trillion a year in tax credits, deductions, and other preferences, collectively known as “tax expenditures” — which disproportionately benefit high-income households and which former Reagan Administration economics adviser (and Harvard professor) Martin Feldstein has called the most wasteful part of the budget.
Distribution of Budget Cuts
As Table 1 shows, the plan proposes $6.0 trillion[1] in non-defense budget cuts through 2026. These cuts would come on top of the cuts dictated by the 2011 Budget Control Act’s (BCA) caps on “discretionary” (annually appropriated) programs and the additional cuts mandated by sequestration.
| TABLE 1 | ||
|---|---|---|
| Cuts in Non-Defense Spending Under House Budget Committee Plan 10-year totals (2017-2026) in trillions of dollars |
||
| Program cuts: | Total | Low-Income |
| Mandatory health care programs | 3.6 | 2.9 |
| All other mandatory programs | 1.4 | 0.7 |
| Subtotal, mandatory cuts | 5.0 | 3.6 |
| Non-defense discretionary (NDD) | 1.0 | 0.1 |
| Total non-defense program cuts | 6.0 | 3.7 |
Cuts in low-income entitlement and discretionary programs likely account for about $3.7 trillion — or 62 percent — of the $6.0 trillion in non-defense cuts. (See Figure 1.)
The low-income cuts include:
-
Some $2.9 trillion in health care cuts for low- and moderate-income people. The plan would repeal health reform (i.e., the Affordable Care Act, or ACA), including its subsidies to make coverage affordable for people with modest incomes and its Medicaid expansion. To date, the ACA’s coverage expansions have extended coverage to 20 million previously uninsured people and strengthened coverage for millions of others.
On top of that, the plan would impose a cap on federal Medicaid funding at levels sharply below those that Medicaid would need to maintain the program as it stood before the ACA’s Medicaid expansion.
- More than $150 billion in cuts to the Supplemental Nutrition Assistance Program (SNAP, formerly known as food stamps). The plan imposes a series of SNAP cuts quickly and then converts the program to a block grant starting in 2021. It cuts SNAP funds by $125 billion, or almost 30 percent, just between 2021 and 2026. A funding reduction of this magnitude would necessitate ending food assistance for millions of low-income families, reducing benefits for tens of millions of such families, or some combination of the two.[2] Under the block grant, the states would determine whose benefits to cut or eliminate.
-
Figure 1 Almost $500 billion in cuts in other entitlements for low-income Americans, including deep cuts in higher education aid. In addition to the cuts in health care and SNAP, the House budget plan cuts close to another $500 billion in low-income entitlement programs just in the education and income security areas. The plan identifies certain specific cuts: significantly scaling back Pell Grants, which help students from families with modest incomes afford college;[3] repealing the Social Services Block Grant; and eliminating some low-income families’ eligibility for the Child Tax Credit. But cuts to these three programs explain only a portion of the $500 billion of entitlement cuts in the education and income security areas (beyond the cut in SNAP noted above). The remaining cuts must come from other entitlements. We assume, therefore, that low-income entitlement programs would bear a proportionate share of the remaining, unspecified entitlement cuts.[4] These cuts would potentially affect child nutrition programs, Supplemental Security Income for the elderly and disabled poor, the refundable portions of the Earned Income Tax Credit and the American Opportunity Tax Credit (which helps families pay for higher education), child care, foster care, adoption assistance, and Temporary Assistance for Needy Families (TANF), among others.
-
About $100 billion in cuts to low-income non-defense discretionary programs. On top of the significant cuts in non-defense discretionary programs already imposed due to the tight appropriations caps and sequestration through 2021,[5] the plan would cut non-defense discretionary programs another $1 trillion[6] (from 2018 to 2026). About seven-eighths of these cuts are allocated to transportation, commerce and housing credit, general government, international affairs, and other parts of the budget that have no low-income programs. But the rest of the cuts are essentially unspecified or occur in parts of the budget where low-income programs reside. We assume that low-income programs would bear a proportionate share of these remaining cuts, which produces an estimate of $100 billion in reductions.
A package of entitlement cuts is also moving in the House, separate from (but in conjunction with) the budget plan. It, too, consists highly disproportionately of cuts in low-income programs. The parts of this package that the House Energy and Commerce and Ways and Means Committees have already approved would eliminate the Social Services Block Grant (as noted above), cut the low-income component of the Child Tax Credit (as noted above), significantly shrink funding for preventive health measures such as child immunizations, and restrict the ability of states to fund their Medicaid programs, which would lead states to institute further Medicaid cuts.[7]
Unprecedented Cuts to Low- and Moderate-Income Programs
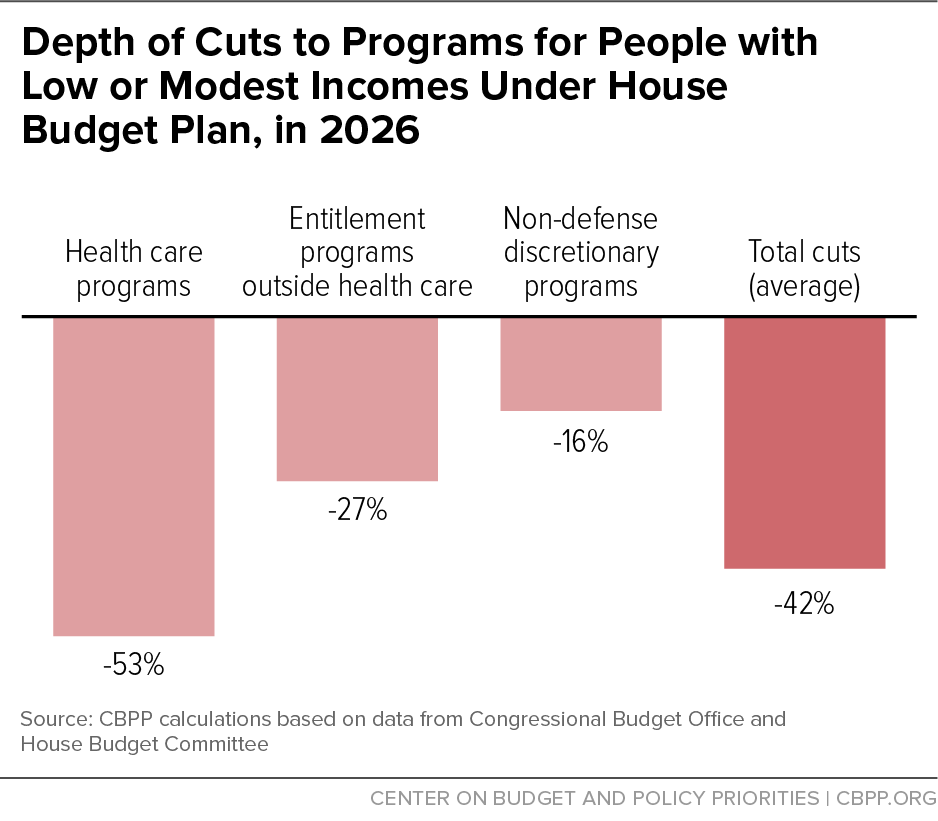
If enacted, these proposals would constitute reductions in the safety net of unprecedented magnitude. The cuts would grow over time until, in 2026, 42 percent of the resources for that year for low- and moderate-income programs would be lost. In that year, as Figure 2 shows:
- Health care assistance for low- and moderate-income people would fall by 53 percent. The cuts reflect the plan’s repeal of health reform (without offering a replacement) as well as the additional deep cuts in Medicaid and the Children’s Health Insurance Program (CHIP). The cuts would likely cause tens of millions of Americans to lose health care coverage.[8]
- Entitlements outside health care for low- and moderate-income people — such as SNAP, the mandatory part of Pell Grants, and the Social Services Block Grant — would fall by an average of 27 percent in 2026.
- Discretionary programs for low- and moderate-income people would fall by about 16 percent. The cuts appear to hit education and housing aid especially hard and would come on top of cuts that have already occurred or would be required in future years due to the appropriations caps and sequestration. Spending on low-income discretionary programs already has fallen to its lowest percent of the economy since 1970.
Clash With Speaker Ryan’s Statements on Reducing Poverty
Viewed one way, the plan’s severe effects on low- and moderate-income people isn’t surprising. Every year since Republicans gained control of the House in 2011, they have adopted budget plans that would make large, disproportionate cuts to low- and moderate-income programs of roughly $3 trillion or more over ten years.[9]
Viewed another way, however, the plan is surprising. House Speaker Paul Ryan has said that poverty reduction is one of his top priorities this year, and he helped moderate a forum on poverty for GOP presidential candidates in January. (Poverty is also one of the topics of the new task forces the Republican leadership has established to develop a policy agenda.)
At the forum, Speaker Ryan stated: “And the way I argue about this [reforming poverty programs] is: This is not a budget-cutting exercise. Take the same amount of money. It should be a life-saving exercise. And that means the government can provide resources. It can be the supply lines. But it should not be the front lines in the war on poverty.”[10] Speaker Ryan used similar wording about spending on poverty programs in an interview with Katie Couric in advance of the forum.[11] The House budget plan, however, starkly contradicts these sentiments.
Further, while policymakers can make some progress against poverty through program improvements that don’t require more spending, certain reforms (including ones with bipartisan support such as expanding the EITC for childless workers) will require more resources. Most important, if policymakers cut the safety net as dramatically as the House budget plan would do, poverty will grow more severe and widespread rather than less.
Why the House Budget Takes This Approach
The budget plan’s structure essentially dictates severe cuts to certain types of spending. The plan is designed to balance the budget in ten years without raising any revenues and while essentially holding Social Security and defense harmless.[12] As a result, other programs, especially low-income programs, have to be hit hard.
The plan could have aimed for significant deficit reduction but not a balanced budget.[13] Or it could have taken a more balanced approach to whatever deficit-reduction goal it set. Past bipartisan deficit-reduction plans have taken a more balanced approach, including the plan advanced by Erskine Bowles and Alan Simpson in 2010 as co-chairs of the National Commission on Fiscal Responsibility and Reform.[14] These plans accomplished significant deficit reduction while largely avoiding cuts in programs for low-income people. Bowles and Simpson established a principle that deficit reduction should not increase poverty or inequality.
Moreover, the House Republican plan ignores what should be one of the largest sources for deficit reduction: tax expenditures. These are the $1.2 trillion a year in deductions, credits, and other preferences that former Federal Reserve Chairman Alan Greenspan called “tax entitlements” and former Reagan economic adviser Martin Feldstein said are the best target for cutting wasteful government spending. Tax expenditures tilt heavily toward the affluent, with half of their benefits going to the top fifth of households.
Rather than limit tax expenditures, which would have allowed for a more balanced approach to deficit reduction, the House budget plan adopts an approach that would make Americans with the least means bear the brunt of the sacrifices.
Technical Note
As explained in earlier reports, CBPP uses a budget baseline projection that adjusts the Congressional Budget Office (CBO) baseline, published in January 2016, by small amounts.[15] The figures in this report would change very little, however, if we had used the CBO baseline with no changes. In particular, using the CBO baseline, the cuts to low- and moderate-income programs would still round to $3.7 trillion over the next decade and would still amount to 62 percent of the overall cuts to non-defense programs.
We do not adjust CBO’s baseline projections of the costs of entitlement programs; the figures we show for entitlement savings in Table 1 are derived by simply subtracting the stated levels in the House Budget Committee’s plan from the CBO/CBPP baseline for these programs.
The story is modestly different for non-defense discretionary (NDD) programs — programs whose funding is determined by annual appropriations bills rather than entitlement law. For NDD programs, CBO’s baseline adjusts total NDD funding for inflation each year after the NDD caps expire at the end of 2021, while our baseline adjusts for both inflation and population growth and therefore assumes $63 billion more in NDD outlays than CBO does from 2022-2026, or 1 percent more in total over the ten-year period.
Consequently, while the Budget Committee’s NDD outlay plan is $949 billion below CBO’s baseline — a figure derived by simple subtraction — the plan is $1.012 trillion below our baseline: $949 billion below CBO’s, plus the $63 billion difference between us and CBO. That’s why we show a figure of $1.0 trillion in NDD outlay cuts in Table 1.
End Notes
[1] Our figures on the overall size of deficit reduction differ modestly from those presented in the House Budget Committee’s documents because we use a slightly different baseline projection for spending under existing law. Please see the Technical Note for further explanation.
[2] Dorothy Rosenbaum and Brynne Keith-Jennings, “House 2017 Budget Plan Would Slash SNAP by More Than $150 Billion Over Ten Years,” Center on Budget and Policy Priorities, March 21, 2016, https://www.cbpp.org/sites/default/files/atoms/files/3-21-16snap.pdf.
[3] The House Budget Committee has indicated that the plan eliminates the mandatory portion of Pell Grant funding. That would necessitate cuts in the program. And although Pell Grants already cover a much lower share of college costs than they used to, the Budget Committee said its plan would freeze the maximum grant level for ten years, even as tuition and room and board costs continue to rise.
[4] We exempted military retirement, a component of the income security area, from the proportional cut that we calculated because the Budget Committee said explicitly it would not cut that program.
[5] The Budget Control Act of 2011 imposed caps or limits on funding for discretionary appropriations through 2021. It also established a mechanism called sequestration by which those caps were automatically reduced further when Congress failed to enact additional deficit reduction through revenue increases or entitlement cuts later in that year. The resulting low appropriations caps through 2021 also create a baseline for budget projections after 2021. As a result, the BCA reduced projected discretionary appropriations through 2021 by the direct imposition of caps, and de facto reduced expected or baseline levels of discretionary appropriations in all subsequent years. It is relative to these resulting, low 2017-2026 levels that the House budget plan takes another $1 trillion bite.
[6] The $1 trillion of non-defense discretionary savings is for outlays over ten years (2017-2026). House Budget Committee documents highlight ten-year non-defense discretionary savings of $887 billion. But that figure represents budget authority (rather than outlays), and it excludes certain non-defense discretionary savings in the plan that result from cuts to highway programs and inadequate funding for disaster assistance and “program integrity” activities, which combat fraud and abuse. These additional savings are captured in the outlay figure cited here.
[7] Robert Greenstein, “House Committees Considering Damaging Cuts,” Center on Budget and Policy Priorities, March 14, 2016, https://www.cbpp.org/research/federal-budget/house-committees-considering-damaging-cuts.
[8] Edwin Park, “Medicaid Block Grant Would Add Millions to Uninsured and Underinsured,” Center on Budget and Policy Priorities, March 15, 2016, https://www.cbpp.org/blog/medicaid-block-grant-would-add-millions-to-uninsured-and-underinsured.
[9] Robert Greenstein and Isaac Shapiro, “Will the House Budget Reflect Speaker Ryan’s Statements to Spend the Same Amount in Fighting Poverty?,” Center on Budget and Policy Priorities, March 14, 2016, https://www.cbpp.org/federal-budget/will-the-house-budget-reflect-speaker-ryans-statements-to-spend-the-same-amount-in. Last year, for the first time both the House and Senate approved a broad budget blueprint, but they didn’t enact the legislation necessary to implement it.
[10] Kemp Forum on Expanding Opportunity, A special presidential-candidate forum on poverty, Morning Joe Panel, minute 17:40, http://www.aei.org/events/expanding-opportunity/.
[11] In the interview, when discussing reforms to poverty programs Speaker Ryan said: “The question to ask is, let’s not make it about money — let’s just spend the same amount of money.” Katie Couric, “Ryan holds poverty summit,” Yahoo! News, January 6, 2016, minute 2:40, https://news.yahoo.com/video/ryan-holds-poverty-summit-045012113.html.
[12] The House plan includes Medicare cuts that start small but accelerate sharply in 2025 and 2026, producing an 11 percent cut in its final year. While a significant cut, it is far smaller than the 42 percent average cut in low-income programs that would occur in 2026.
[13] Robert Greenstein and Joel Friedman, “Balancing the Budget in Ten Years and No New Revenue Are Flawed Budget Goals,” Center on Budget and Policy Priorities, updated March 9, 2016, https://www.cbpp.org/sites/default/files/atoms/files/3-13-15bud.pdf.
[14] Richard Kogan, “What Was Actually in Bowles-Simpson – And How Can We Compare it With Other Plans?” Center on Budget and Policy Priorities, October 2, 2012, https://www.cbpp.org/research/what-was-actually-in-bowles-simpson-and-how-can-we-compare-it-with-other-plans.
[15] See the Technical Note at the end of “Low-Income Programs Not Driving Nation’s Long-Term Fiscal Problem,” Center on Budget and Policy Priorities, February 24, 2016, https://www.cbpp.org/research/long-term-fiscal-challenges/low-income-programs-not-driving-nations-long-term-fiscal.
More from the Authors