Chart Book: The Legacy of the Great Recession
The United States’ longest, and by most measures worst, economic recession since the Great Depression began in December 2007 and ended in June 2009. The Great Recession cast a long shadow over the economic expansion that followed, however, and labor market conditions improved steadily but slowly for several years before the economy began closing in on full employment between 2015 and 2017.
This chart book documents the course of the economy from the start of the recession through 2017. It shows how deep a hole the Great Recession created — and how much deeper that hole would have been without the financial stabilization and fiscal stimulus policies enacted in late 2008 and early 2009. And it documents the return to stronger labor market conditions by the end of the period.
Part I: Recovery Began in June 2009 Following Enactment of Financial Stabilization and Fiscal Stimulus Measures
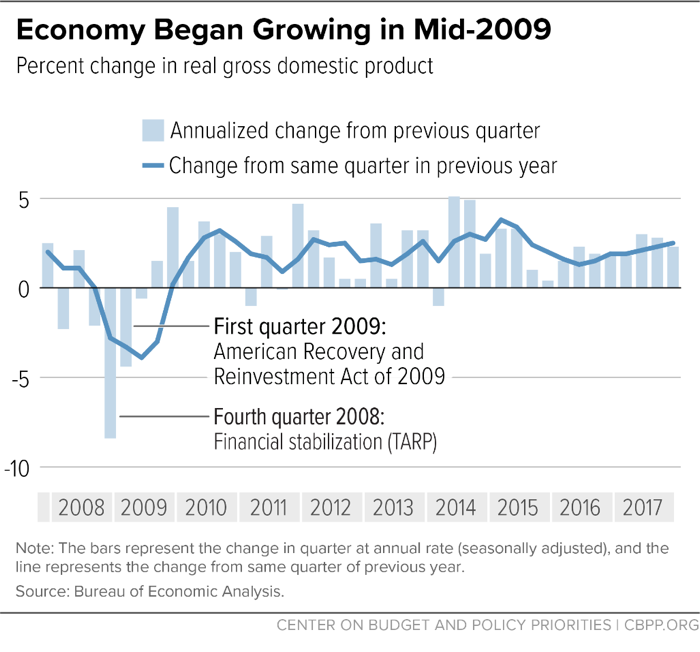
The Economy Began Growing in Mid-2009
The financial crisis turned what might have been an ordinary economic downturn into the Great Recession in the second half of 2008. Economic activity as measured by real (inflation-adjusted) gross domestic product (GDP) was contracting sharply when policymakers enacted the financial stabilization bill (TARP) and the American Recovery and Reinvestment Act. The economy began growing in 2009 and averaged 2.2 percent annual growth from mid-2009 through the fourth quarter of 2017.
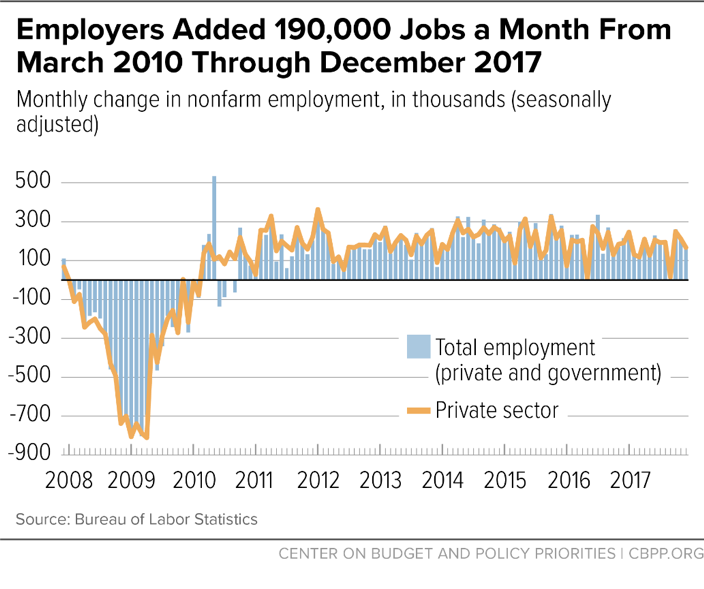
Employers Added 190,000 Jobs a Month From March 2010 Through December 2017
The pace of monthly job losses slowed dramatically soon after President Obama and Congress enacted the Recovery Act in February 2009. The trend in job growth in 2010 was obscured by the rapid ramp-up and subsequent decline in government hiring for the 2010 census, but private employers added 18.0 million jobs to their payrolls in 94 consecutive months of job creation from March 2010 through December 2017, an average of 191,000 jobs a month. Total employment (private plus government) rose by 17.9 million (190,000 a month) over the same period as federal, state, and local government were net job losers. Federal government employment fell by 77,000 jobs, state government rose by 17,000, and local government fell by 27,000. These government job losses contrasted sharply with past recoveries, when government job creation was an important contributor to job growth.
Part II: The Recession Put the Economy in a Deep Hole
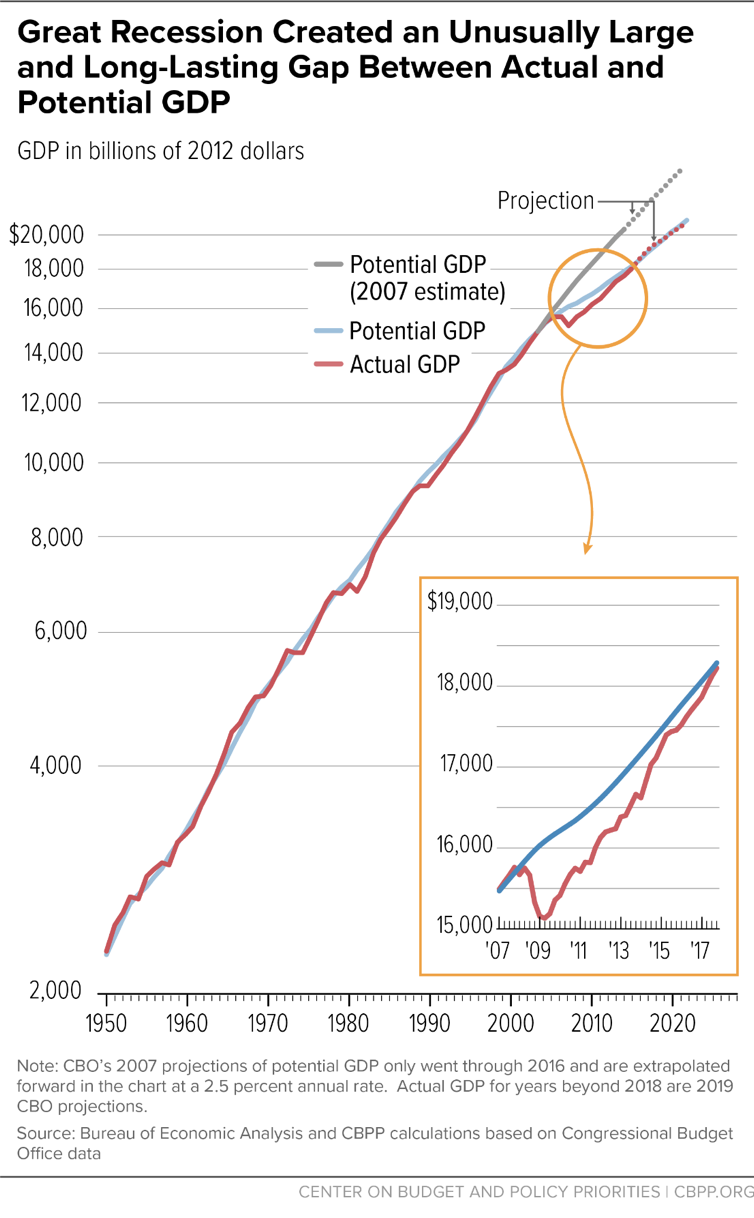
Great Recession Created an Unusually Large and Long-Lasting Gap Between Actual and Potential GDP
For a half century prior to the Great Recession, actual GDP, which is determined by the demand for goods and services, fluctuated in a relatively narrow range around the Congressional Budget Office (CBO)’s estimate of what the economy was capable of supplying on a sustainable non-inflationary basis (potential GDP). Actual GDP fell below potential in recessions and temporarily rose above it in booms. The Great Recession created an unusually large and long-lasting gap between actual and potential GDP. That “output gap” was manifested in substantial excess unemployment and underemployment and idle productive capacity among businesses.
Although the output gap was essentially closed in late 2017, according to CBO’s August 2018 Economic and Budget Outlook estimates, the agency’s estimates of both the level and growth rate of potential GDP for 2007-2017 are now much lower than the projections made just before the start of the Great Recession.
(The chart is constructed so that a straight line represents a constant growth rate, with a steeper slope representing a higher growth rate.)
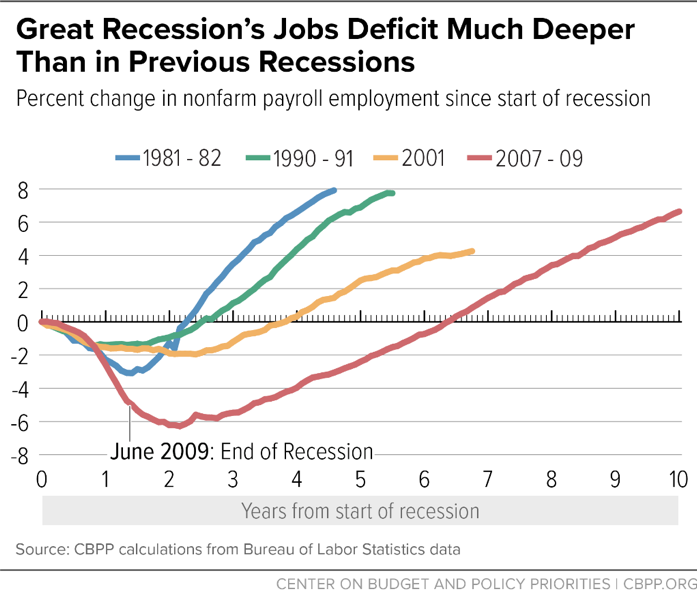
Great Recession’s Jobs Deficit Much Deeper Than in Previous Recessions
Job losses in the Great Recession were huge, and it took much longer than in previous recessions simply to get back to the level of payroll employment at the start of the recession. Employers did not begin to add jobs until 2010. Progress erasing the jobs deficit was slow for some time, but by mid-2014 the economy had recovered the 8.7 million jobs lost between the start of the recession in December 2007 and early 2010 and continued to add jobs thereafter. Job creation greater than what was required to keep up with potential labor force growth (the pace of job creation that’s appropriate once the economy is back to full health) continued to bring people back into the labor force and lower the unemployment rate. Nonfarm payroll employment was 6.6 percent (9.2 million jobs) higher in December 2017 than it was at the start of the recession.
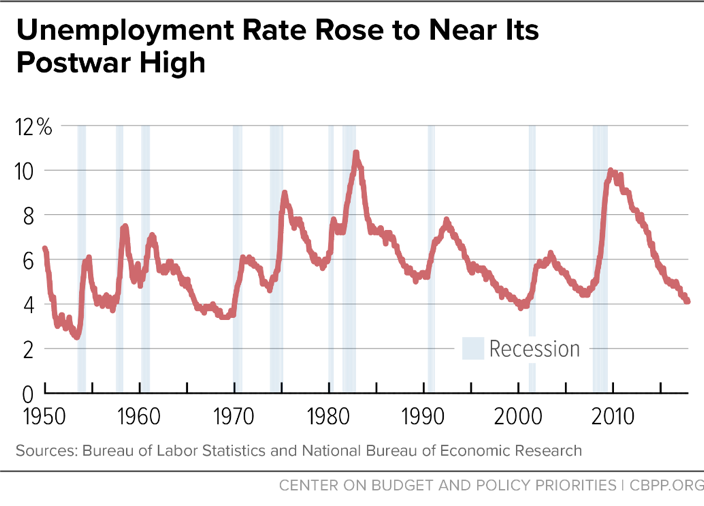
The Unemployment Rate Rose to Near Its Postwar High
The unemployment rate rose far higher than in the previous two recessions and far faster than (though not quite as high as) in the deep 1981-82 recession. Technically, the recession ended in June 2009 as the economy began growing again, but the unemployment rate did not fall to 5.0 percent, where it was at the start of the recession, until late 2015. It reached 4.1 percent in late 2017.
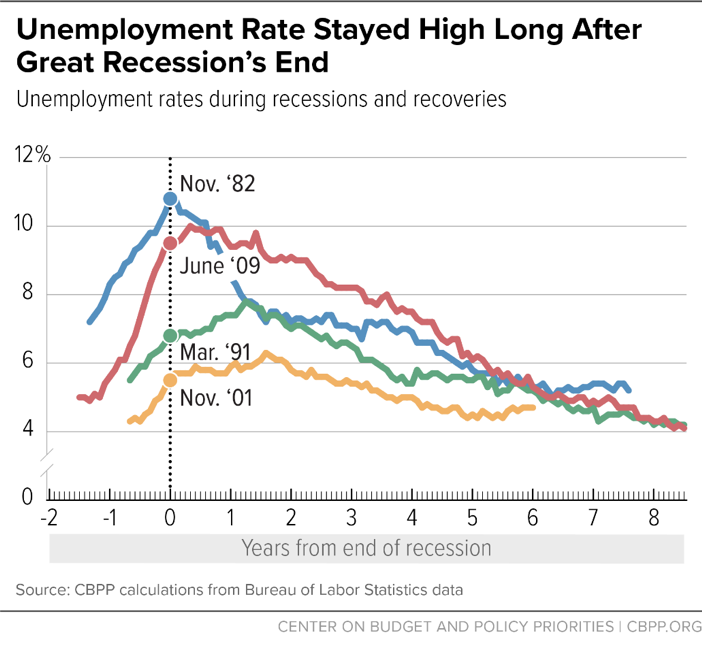
Unemployment Rate Stayed High Long After Great Recession’s End
The relatively modest pace of job growth (relative to the size of the job losses) in the first years of the recovery kept the unemployment rate high long after the end of the recession. This is similar to what happened in the previous two recessions and does not resemble the fairly rapid decline that followed the severe 1981-82 recession. The unemployment rate at the end of 2017 was much lower than it was early in the recovery, but indications remained that there were still people who were not working but wanted to be and people who would have liked to be working full time but could only find part-time jobs who could be pulled back into the labor market or get the hours they wanted if job creation remained strong.
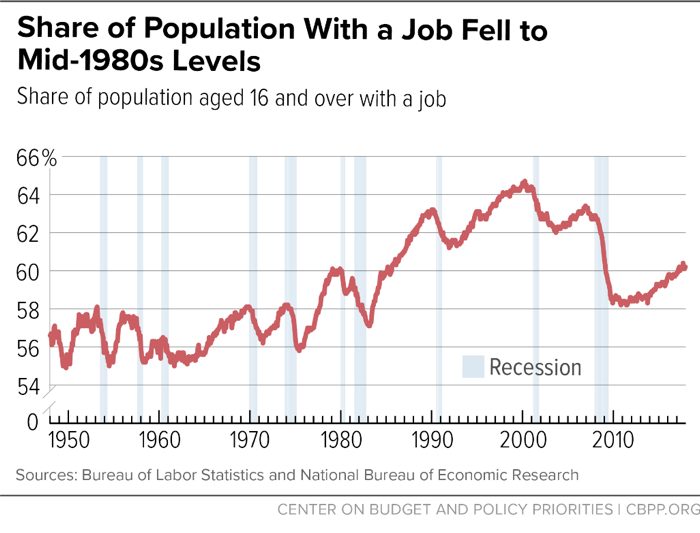
Share of the Population With a Job Fell to Mid-1980s Levels
The sharp rise in the unemployment rate and discouragement over the prospects of finding a job caused a decline in the percentage of the population in the labor force (those either working or looking for work, known as the labor force participation rate). As a result of rising unemployment and declining labor force participation, the percentage of the population with a job fell sharply in the recession and stayed low through much of the recovery. It began to move up in 2014 and 2015 as rising employment offset still-falling labor force participation. The labor force participation rate averaged 62.9 percent in 2017 and the employment-to-population ratio averaged 60.1 percent in 2017.
The employment-to-population ratio shown in the chart is for those aged 16 and older and includes an increasing number of retired baby boomers. Thus, a significant percentage of the shortfall from its level at the start of the recession reflects demographic trends rather than labor market weakness. While this rate remained 2.5 percentage points lower in December 2017 than it was at the start of the recession in December 2007, the employment-to-population ratio for those in their prime working years (age 25-54), which fell 4.9 percentage points between the start of the recession and December 2009, had recovered all but 0.6 percentage points of that loss.
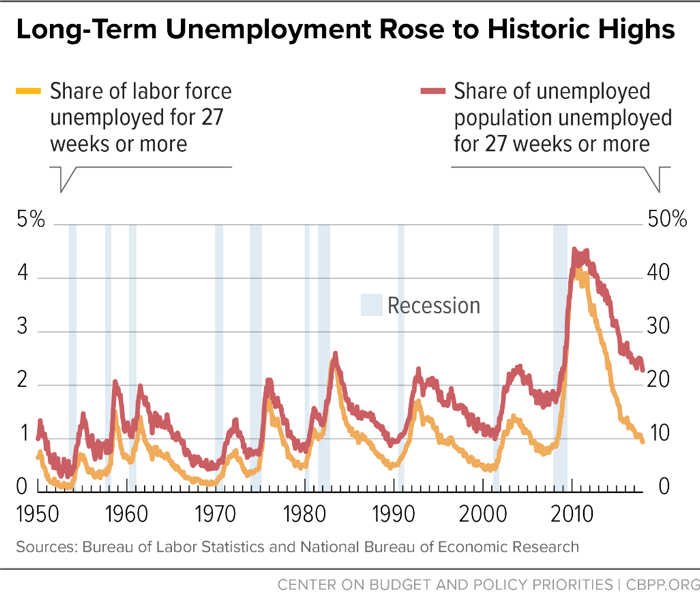
Long-Term Unemployment Rose to Historic Highs
Long-term unemployment reached much higher levels and persisted much longer in the Great Recession and subsequent jobs slump than in any previous period in data that go back to the late 1940s. The worst previous episode was in the early 1980s, when the long-term unemployment share — the share of the unemployed population that had been unemployed for 27 weeks or more — peaked at 26.0 percent and the long-term unemployment rate — the share of the total labor force that had been unemployed for 27 weeks or more — peaked at 2.6 percent. Moreover, in the earlier episode, a year after peaking at 2.6 percent, the long-term unemployment rate had dropped to 1.4 percent. It took six years from the end of the Great Recession to reach that rate, which it did in June 2015. The long-term unemployment rate continued to edge down, reaching 0.9 percent by the end of 2017. Still, over a fifth (22.8 percent) of the 6.6 million people who were unemployed at the end of 2017 — 1.5 million people — had been looking for work for 27 weeks or longer.
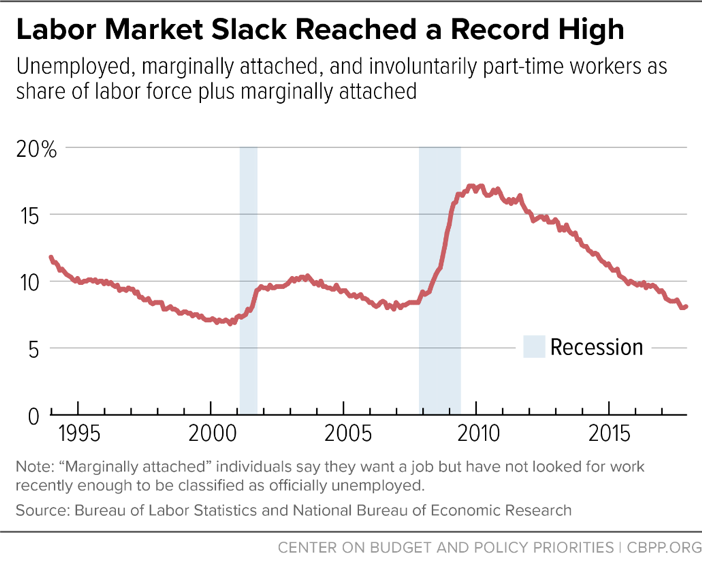
Labor Market Slack Reached a Record High
The Labor Department’s most comprehensive alternative unemployment rate measure — which includes people who want a job but are classified as “marginally attached” to the labor force because they have not looked for work recently enough to be officially unemployed and people working part time because they can’t find full-time jobs — recorded its highest reading on record in November 2009 in data that go back to 1994. After falling to 8.0 percent in October 2017 — the lowest it had been since early 2007 — this rate edged up to 8.1 percent at year’s end. That was still lower than it was in the year before the Great Recession, but more than a percentage point higher than it was in 2000.
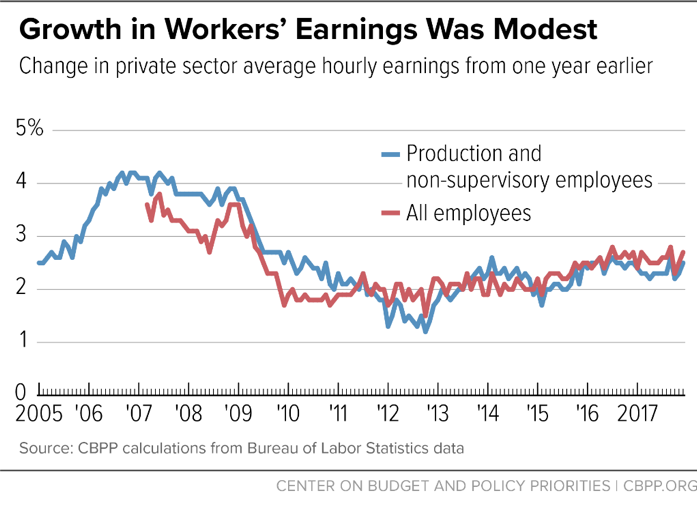
Growth in Workers’ Earnings Was Modest
Average hourly earnings of employees on private payrolls grew modestly through much of the recovery; growth averaged 2.2 percent annually through 2017. Inflation was modest as well, but over much of the economic recovery, real (inflation-adjusted) wages hardly grew and they failed to keep up with increases in workers’ productivity (output produced per hour of work).
As a result, the share of national income going to profits rose relative to that going to wages. Both inflation and productivity fluctuated more than nominal earnings during this period but, on average, productivity rose at roughly 1.1 percent per year from the end of the recession through 2017 and the cost of a typical worker’s market basket rose about 1— percent per year over the same period.
Low inflation in 2015 and 2016 led to solid real wage gains, but those gains cannot be sustained in the face of higher future inflation without faster nominal wage growth.
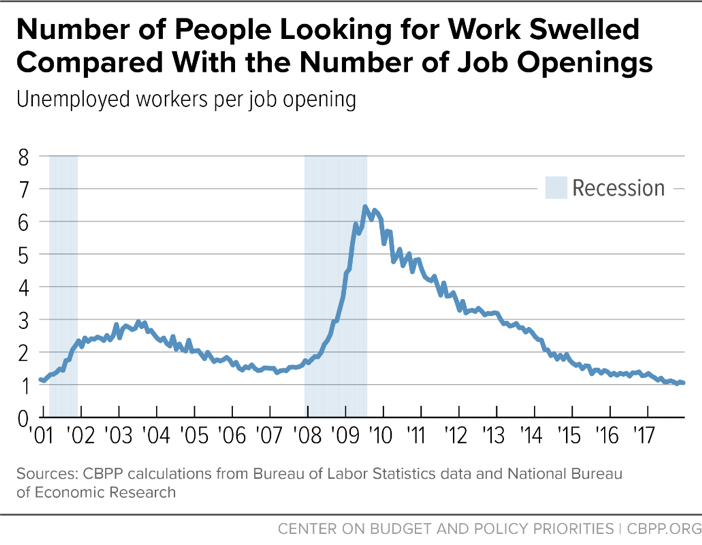
Number of People Looking for Work Swelled Compared With the Number of Job Openings
At one point at the beginning of the recovery, seven people were looking for work for every job opening. By 2017, however, that ratio had declined to near its historic low, reached just before the 2001 recession in data that go back to December 2000. In December 2017, nearly 6.6 million workers were unemployed, compared with nearly 6.2 million job openings (a ratio of roughly 106 job seekers for every 100 job openings).
Part III: The Great Recession Would Have Been Even Worse Without Financial Stabilization and Fiscal Stimulus Policies
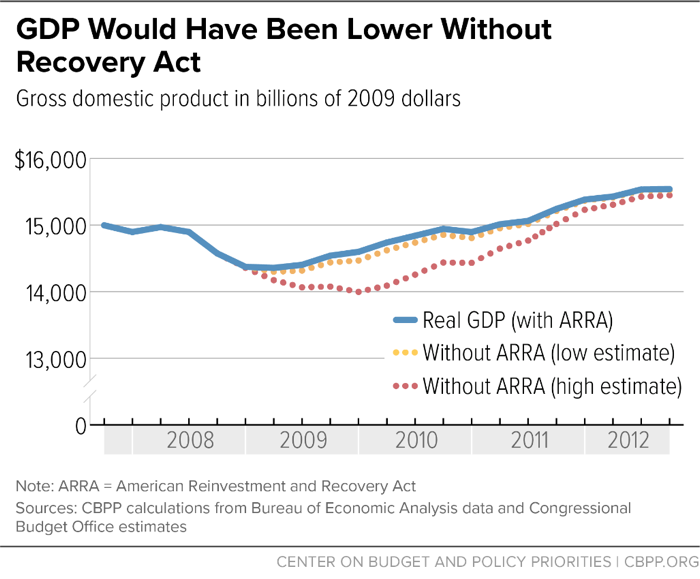
GDP Would Have Been Lower Without Recovery Act
The Recovery Act was designed to boost the demand for goods and services above what it otherwise would be in order to preserve jobs in the recession and create them in the recovery. CBO found that GDP was higher each year between 2009 and 2012 than it would have been without the Recovery Act (with the largest impact in 2010 when GDP was between 0.7 and 4.1 percent higher than it otherwise would have been). The impact diminished after 2010, as it would be expected to do in a recovering economy, but CBO estimates that even at the end of 2012 GDP was between 0.1 and 0.6 percent larger than it would have been without the Recovery Act.
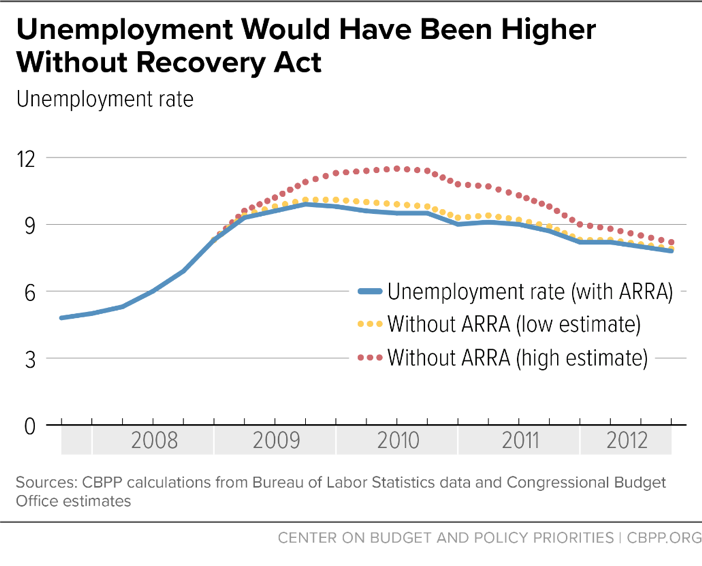
Unemployment Would Have Been Higher Without Recovery Act
CBO estimated that because of the Recovery Act, the unemployment rate was lower each year between 2009 and 2012 than it otherwise would have been. The maximum effect was in 2010, but CBO estimates that even in the fourth quarter of 2012 the unemployment rate was 0.1 to 0.4 percentage points lower than it otherwise would have been and employment was between 0.1 million and 0.8 million jobs greater than it otherwise would have been.