CBPP’s Updated Long-Term Fiscal Deficit and Debt Projections
For a number of years, the Center on Budget and Policy Priorities (CBPP) has projected the long-term path of federal spending, revenues, deficits, and debt if current policies remain unchanged. These projections have shown that deficits and debt will grow in coming decades to unprecedented levels that will not only compromise the federal government’s ability to address critical national priorities, but also pose a real threat to the U.S. economy and Americans’ standard of living.
Thus, while it is imperative that we avoid undercutting ongoing efforts to spur a recovery from what is in many respects the worst recession since the 1930s, it is vital that policymakers begin as soon as possible to take the steps needed to raise revenues and slow spending growth when the economy recovers in order to put the budget on a sustainable path. They can — and must — do this in a way that also maintains policies that meet crucial national needs and that avoids further increasing poverty and inequality.
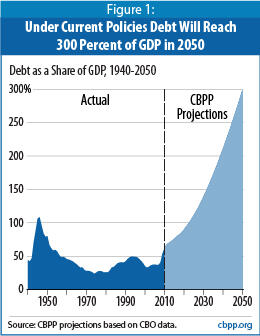
Driven primarily by health care costs, rapidly growing deficits will push the debt held by the public up to roughly 300 percent of gross domestic product by 2050, or nearly three times as large as the record level reached at the end of World War II (see Figure 1).
A brief description of our new projections and how we produced them is attached. Also available is a copy of a CBPP paper on the bleak long-term budget outlook that we issued last December. While the new projections described here differ slightly from those in the December 2008 report, the earlier report’s conclusions, its discussion of the causes of the long-term problem, and its detailed description of our methodology remain relevant. In coming weeks, we will update the December 2008 report to incorporate our new projections.
New CBPP Projections Reconfirm
Federal Budget Is on Unsustainable Path
The nation faces an unsustainable fiscal future unless the President and Congress change current policies, according to updated projections from the Center on Budget and Policy Priorities.[1] The Center has analyzed the budget outlook through 2050 and finds that:
- If current policies are continued without changes, the debt held by the public will explode, rising to roughly 300 percent of GDP in 2050. The deficit will rise to approximately 20 percent of GDP in that year. (See Figure 1 and Table 1.)
- The main driver of the long-term fiscal imbalance is the rising per-person cost of health care, which will increase spending and reduce revenues (as explained below). The loss of revenues from extending the 2001 and 2003 tax cuts also contributes significantly to the problem.
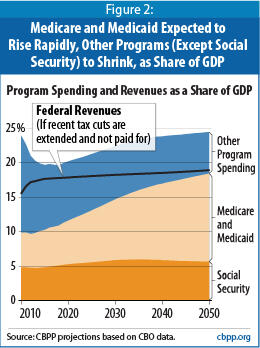
- Social Security expenditures will rise modestly as a percentage of GDP between now and 2030 and then stabilize, as demographic changes abate. Unlike Medicare and Medicaid, Social Security will not rise relentlessly faster than GDP.
- All federal spending other than Social Security, Medicare, Medicaid, and interest payments on the debt will — when taken together — shrink as a share of GDP between now and 2050. The rest of the budget consequently is not contributing to the long-term fiscal problem. (See Figure 2.)
- The “fiscal gap” (the amount of deficit reduction needed to stabilize the debt-to-GDP ratio at today’s level) is 4.7 percent of GDP over the 2010-2050 period. In other words, policymakers would need to enact spending cuts, revenue increases, or a combination of the two equivalent each year to $665 billion in 2009 (4.7 percent of GDP) to keep the level of debt in 2050 from exceeding its 2009 level of 54 percent of GDP. [2]
The current economic downturn and steps taken to address it have worsened the long-term fiscal outlook only slightly. [3] The effects of the recession on revenues and outlays are temporary, as are the measures that Congress has enacted to provide fiscal stimulus and rescue the financial system. They will have far less fiscal impact than permanent policies, which will long outlast the recession.
Methodology
Ten-year projections. CBO follows budget baseline rules that call for assuming current laws will be extended — an assumption that is sometimes unrealistic. In many respects, current laws differ from current policies. For this reason, we and many other budget-watchers regularly adjust the CBO baseline.
Specifically, we assume that Congress will continue the 2001 and 2003 tax cuts that are scheduled to expire in 2010 under current law and certain other so-called tax “extenders” (provisions, such as the research and development tax credit, that Congress initially enacted on a temporary basis but routinely extends) and will continue relief from the Alternative Minimum Tax (AMT). CBO’s baseline, in contrast, assumes that the tax cuts will expire on schedule and that the AMT will expand to snare tens of millions of middle-class taxpayers.
In addition, we assume that Congress will continue to defer scheduled cuts in payments for Medicare providers, as it routinely has in recent years, and instead provide doctors with a payment increase based on the Medicare Economic Index. (CBO’s baseline assumes that deep cuts in Medicare payments to doctors will go into effect.) We also account for a gradual phasedown of operations in Iraq and Afghanistan and unanticipated natural disasters. (See Table 2.)
We assume that all other spending will grow at the rate of inflation and population growth combined, meaning that it will gradually shrink as a percentage of GDP.
Long-term revenue projections. Our revenue projections largely follow CBO’s alternative fiscal scenario, which assumes extension both of the 2001 and 2003 individual income tax cuts and of AMT relief. In addition, our numbers — like CBO’s — assume a decrease in revenues due to increased private health care spending: as health care costs rise, workers are likely to receive more of their compensation in the form of tax-exempt health care benefits and less in the form of taxable wages, so total revenues decline. But because we project that excess cost growth in other health-care spending will mimic that in Medicare and Medicaid, whereas CBO estimates it will be somewhat lower than in those programs, our revenue estimates are lower than CBO’s.
Conclusion
These projections confirm the findings of numerous independent budget analysts, including the Congressional Budget Office and the Government Accountability Office. Continuing current policies will lead the federal budget down an unsustainable track. Policymakers need to take significant steps — the most important of which is system-wide health care reform — to put the federal budget on a sound long-term trajectory.
End Notes
[1] These new projections update those in Kris Cox, James Horney, and Richard Kogan, “The Long-Term Fiscal Outlook Is Bleak: Restoring Fiscal Sustainability Will Require Major Changes to Programs, Revenues, and the Nation’s Health Care System,” Center on Budget and Policy Priorities, December 16, 2008. CBPP will issue a revised version of the paper incorporating the updated projections in coming weeks.
[2] The fiscal gap is a summary measure over many years and therefore is a very abstract guide to policymakers over the medium term. CBPP will discuss the fiscal gap and alternative guideposts for fiscal sustainability in a forthcoming paper.
[3] CBPP estimates, for instance, that 97 percent of the fiscal gap would remain even without the $787 billion cost of the American Recovery and Reinvestment Act.
[4] Congressional Budget Office, “The Budget and Economic Outlook: An Update,” August 2009; Congressional Budget Office, “The Long-Term Budget Outlook,” June 2009.
[5] CBO’s long-term report featured two scenarios: the baseline extended and an alternative fiscal scenario. The alternative scenario resembles our assumptions in many key respects — for example, by assuming continuation of the 2001 and 2003 tax cuts and AMT relief, as well as modest increases in Medicare’s physician fees — and we generally use its growth rates, with adjustments as described in the text.
[6] We believe that in the absence of changes in health care policy, “excess cost growth” (the rate by which per-capita spending growth exceeds per-capita economic growth) will continue to move in tandem for the entire health care sector. Therefore, unlike CBO, which assumes that Medicare will grow faster than Medicaid, we assume both programs will experience the same excess cost growth.
More from the Authors

Areas of Expertise

Areas of Expertise

Areas of Expertise