Low-Income Programs Not Driving Nation’s Long-Term Fiscal Problem
Programs Outside Health Projected to Decline Relative to Economy
Programs assisting low- and moderate-income people are not driving the nation’s long-term fiscal problems, contrary to assertions from some policymakers. Despite this, the first two Trump budgets as well as recent congressional Republican budget plans — including the one for fiscal year 2019 recently approved by the House Budget Committee — target these programs for deep cuts.
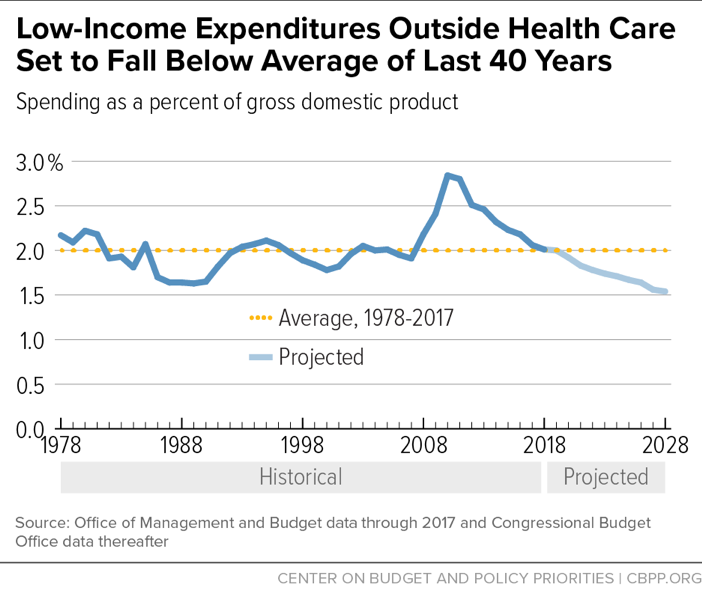
Low-income program spending grew significantly between 2007 and 2010 in response to the severe recession.[1] But as a percent of the economy, federal spending on low-income programs other than health care has fallen considerably since then. This year, spending on these programs as a percent of gross domestic product (GDP) will be well below its level in the first full year of the recession and roughly equal to its average level over the past 40 years. New Congressional Budget Office (CBO) estimates indicate, moreover, that spending on low-income programs other than health care will continue declining below its 40-year average as a percent of GDP over the next decade.[2] (See Figure 1.)
Spending on low-income health care programs — including Medicaid, the Children’s Health Insurance Program (CHIP), and premium tax credits that subsidize marketplace coverage under the Affordable Care Act (ACA) — has risen for many decades as a percent of the economy, as have costs for other health care programs and private-sector health care costs. While health care cost growth has slowed from prior decades, the combination of increases in health care prices and the aging of the population means that spending in these areas will continue to rise as a percent of the economy.
Yet since 2010, the increase in health care programs as a percent of the economy has been more than offset by declines in cost of all other low-income programs. And this net decline is projected to continue, albeit at a slower pace, over the coming decade.
These trends indicate that low-income programs are not adding to the nation’s long-term fiscal problem — they are not the reason that CBO projects that debt will rise faster than the economy in future decades. Nor are they especially expensive. Federal spending on low-income programs outside health care will be 2.0 percent of GDP in 2018, claiming two cents for every dollar the economy produces. And spending on low-income health care programs — which provide coverage for an estimated 93 million Americans in a typical month — will be 2.4 percent of GDP in 2018.
More specifically, federal spending for low-income programs outside health care — including refundable tax credits such as the Earned Income Tax Credit and the Child Tax Credit — rose from 1.9 percent of GDP in 2007 to a peak of 2.8 percent of GDP in 2010. This rise reflected increased need during the economic downturn as well as policies adopted in response. But this spending has now dropped eight years in a row as a percent of the economy, and at 2.0 percent of GDP in 2018, it has returned roughly to the prior 40-year average. It is projected to decline further in the decade ahead, to 1.5 percent in 2028, which would be the lowest level since 1970.
Spending on low-income health care programs also rose sharply in response to the recession; after falling as a percent of GDP in 2011 and 2012, it has resumed rising and is expected to continue rising as a percent of GDP over the next decade. The upward trend results from factors such as the longstanding rise in costs throughout the U.S. health care system — which affects private-sector health care spending as much as public programs such as Medicaid — and the aging of the population. Coverage expansions under the ACA also increased costs in recent years, though the ACA’s revenue-raising provisions more than covered those increases.
Over the coming decade, the projected rise in spending on low-income health programs as a percent of GDP, as estimated by CBO, will be more than offset by the projected decline in other low-income programs. Overall spending on low-income programs — health care and non-health combined — is expected to fall slightly, from 4.4 percent of GDP in 2018 to 4.3 percent in 2028.
To ignore these facts and impose large cuts in low-income programs based on the claim that low-income spending is growing rapidly would have serious consequences. Low-income programs such as SNAP (formerly known as food stamps), Supplemental Security Income (SSI) for the elderly and disabled poor, refundable tax credits, housing assistance, Medicaid, CHIP, and the ACA’s premium subsidies keep millions of families out of poverty, reduce the depth of poverty for millions more, help tens of millions of people obtain health insurance, and improve the nutrition, housing, and education of families in need.[3] The dramatic budget cuts that President Trump and some congressional budget plans have proposed would threaten these accomplishments.[4]
Low-Income Programs Outside Health Care Are Shrinking Relative to Economy
Federal spending for low-income programs other than health care has averaged 2 percent of the economy over the last 40 years and is projected to fall below that average in coming years (see Figure 1).
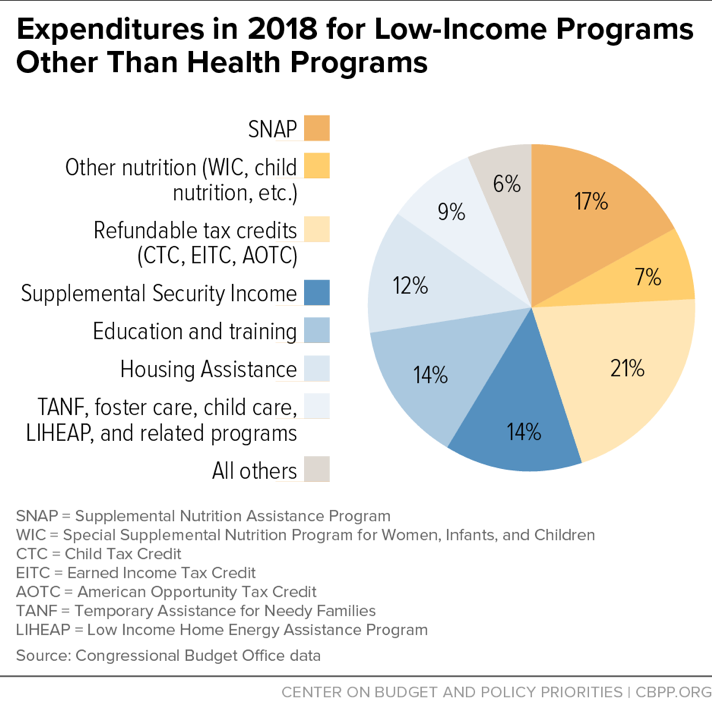
Figure 2 shows the major components of this spending, including both discretionary (annually appropriated) and mandatory (entitlement) programs.
Spending on low-income discretionary programs outside health care, such as educational aid targeted on schools with large numbers of low-income children, job training, and low-income housing assistance, is already slightly below its 40-year average as a percent of GDP, and is projected to decline further. After 2019, this drop will largely be driven by the 2011 Budget Control Act’s (BCA) cap on annual non-defense discretionary (NDD) funding, as further reduced by sequestration, which is set to shrink overall NDD spending substantially over the coming decade.[5] Total NDD spending is projected to fall from 3.3 percent of GDP in 2018 to 2.5 percent in 2028 — well below the lowest level on record, with data going back to 1962.
Such a large decline in overall NDD appropriations would make it virtually inevitable that spending for low-income NDD programs would decline as well. If low-income discretionary programs shrink by the same percentage as NDD spending as a whole, they (other than health programs) will fall from 0.6 percent of GDP in 2018 to less than 0.5 percent in 2028, the lowest level since 1966. Even if policymakers repealed the BCA caps and allowed discretionary funding to grow with inflation over the next decade, low-income discretionary spending outside health care would still fall to only slightly more than 0.5 percent of GDP in 2028.
Federal spending on low-income mandatory programs outside of health care generally rose during the recession but has since fallen:
- In 2018, federal spending for low-income mandatory programs outside health care will equal 1.4 percent of GDP, slightly above the 40-year average of 1.3 percent. These programs’ costs as a percent of the economy rose from 2007 through 2011 but have diminished significantly since then.
- Spending for low-income mandatory programs outside health care will continue to decline over the next decade. CBO projects that this spending will fall to below its historical average of 1.3 percent of GDP by 2022. Specifically, CBO projects spending on each of the three largest low-income mandatory programs outside health care — refundable tax credits for the working poor, SNAP, and SSI — will fall or remain stable as a percent of the economy over the next decade.[6]
Together, mandatory and discretionary low-income expenditures outside health care will total 2.0 percent of GDP in 2018, roughly equivalent to their 40-year average. Over the next decade, they will fall to about 1.5 percent of GDP. Even if discretionary funding is allowed to grow with inflation, spending on these programs will still fall to 1.6 percent of GDP over the decade.
Low-Income Health Programs Growing Relative to Economy
Medicaid is the largest low-income health program. Others include CHIP, subsidies to help pay the premiums and cost-sharing for low-income Medicare prescription drug beneficiaries, and subsidies to help purchase coverage in the ACA marketplaces. CBO projects that low-income health programs will grow from 2.4 percent of GDP in 2018 to 2.8 percent in 2028.
This projected rise is due to several factors. To begin with, costs throughout the U.S. health care system — in both the public and private sectors — have grown faster than GDP for many decades and continue to do so, though health care cost growth has slowed noticeably in recent years.[7] CBO projects that health care costs will continue growing at a more moderate pace than in previous decades; although a share of the recent cost slowdown is expected to be temporary, a portion is expected to be more long-lasting.[8]
Per-beneficiary costs have recently risen more slowly in Medicaid than under private health insurance and are expected to rise no faster than private health insurance costs in coming years.[9] Moreover, per-beneficiary costs in Medicaid are substantially lower than those under private health insurance (after adjusting for differences in beneficiaries’ health status), largely because Medicaid pays providers much lower rates and has lower administrative costs and no profit margin.[10] Even so, Medicaid is not immune to system-wide health care cost increases, which are driven in part by medical advances that improve health and lengthen life but add to costs. Medicaid costs are still expected to rise faster than GDP in coming years and decades.
Another reason that Medicaid costs will continue to rise faster than GDP is the aging of the population. By 2028, an estimated 19.3 percent of Americans will be 65 or older, up from 15.5 percent in 2018 and 10.8 percent in 1978.[11] And the share of the population over age 85 — who have much higher health care costs than other elderly individuals — will grow even faster. Older people account for a disproportionate share of Medicaid costs (as do people with serious disabilities).[12] As the population ages, the number and share of Medicaid beneficiaries who are elderly will increase, raising program costs. The same phenomenon will push up the costs of the low-income subsidies for Medicare’s prescription drug program.
Although CBO projects that spending on low-income health programs will rise as a percent of GDP, it also projects that spending on low-income programs outside health care will fall at a slightly greater pace. As a result, after peaking at 5.0 percent of GDP in 2010, total spending on low-income programs is expected to equal 4.4 percent of GDP in 2018 and 4.3 percent in 2028. (See Table 1.) These programs now exceed their 40-year average as a percent of GDP and are projected to remain above it, due to the growth in low-income health care programs.
| TABLE 1 | ||||
|---|---|---|---|---|
| Spending on Low-Income Programs (percent of GDP) | ||||
| 1977-2016=7 average | 2010 | 2018 | 2028 | |
| Low-income programs, excluding health | 2.0 | 2.8 | 2.0 | 1.5 |
| Low-income health programs | 1.3 | 2.2 | 2.4 | 2.8 |
| Total, all low-income programs | 3.3 | 5.0 | 4.4 | 4.3 |
Long-Term Fiscal Problem Remains Challenging
In short, outside of health care costs, low-income programs are shrinking modestly as a percent of GDP and are on a path to continue declining below their historical average over the next decade. While spending on low-income health programs will continue rising, total spending on low-income programs is projected to decline slightly over the next decade, measured as a percent of the economy.
This picture is consistent with another CBPP analysis,[13] which finds that outside of Social Security and Medicare, total federal program spending is below its 40-year average as a percent of GDP and is projected to decline further. When Social Security and Medicare are added in, total program spending (i.e., spending exclusive of interest costs) will rise by the end of the decade, from 19.2 percent of GDP in 2018 to 20.0 percent in 2028. Spending on Social Security and Medicare will rise by 2.1 percent of GDP during this period, due largely to the aging of the population but also to the continuing rise in health care costs.
As a result of these structural factors, the nation faces a challenging long-term fiscal problem. The pressures for higher spending mean that revenues, too, will need to rise if the federal debt is to grow no faster than the economy, even if responsible measures to reduce program costs — including reforms to slow health care cost growth — are taken. Unfortunately, the recent tax legislation moved the budget in the wrong direction. Restoring the federal revenue base should be the major goal of fiscal policy in the next few years.
Appendix: CBPP Budget Projections
This analysis is based on CBPP spending projections for the coming decade, which we calculate by starting with CBO’s projections and then making the following two changes.
First, we remove certain timing anomalies from the CBO’s projection. Some programs — e.g., Medicare Part C; Supplemental Security Income (SSI); and Veterans’ Compensation and Pensions — accelerate their monthly payments by a few days if the payments would otherwise fall on a weekend. And October 1, the start of the federal fiscal year, sometimes falls on a weekend. So in some fiscal years there are 11 or 13 “monthly” payments, distorting the year-to-year path of program expenditures, deficits, and debt. We smooth the path by assuming 12 such payments each year.[14] (See Figure 3.)
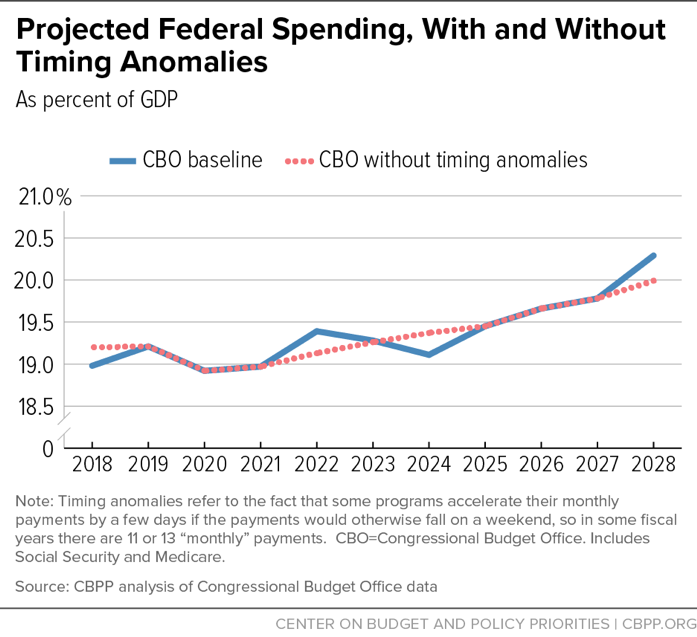
Fiscal year 2018 has 11 such “monthly” payments and 2028 has 13, so smoothing also makes the comparison between 2018 and 2028 expenditures, which we cite frequently in this analysis, more meaningful. Without this smoothing, 2018 program expenditures would be artificially low and 2028 program expenditures would be artificially high.
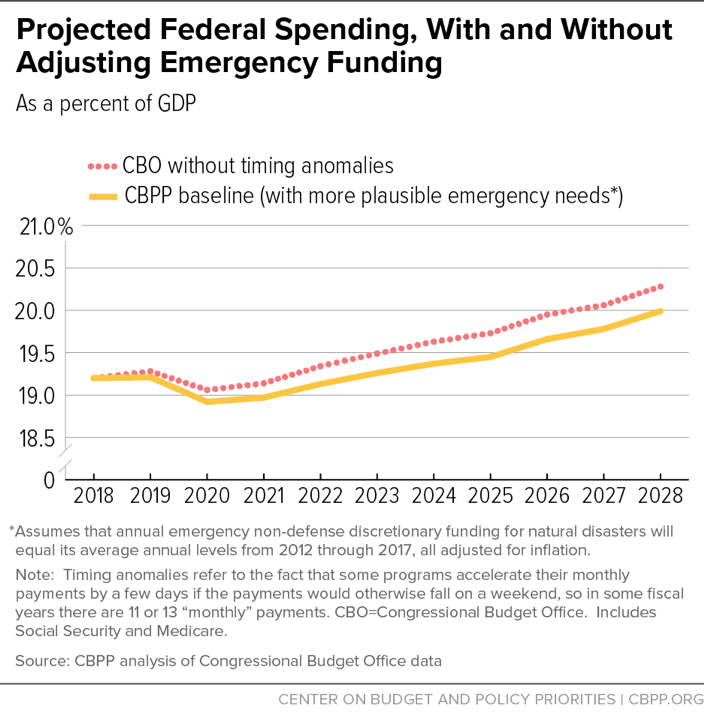
Second, CBO assumes that discretionary funding for natural disasters will grow with inflation for ten years, following formal baseline rules. But fiscal year 2018 disaster funding was extraordinarily high because of last summer’s hurricanes. So we reduce projected disaster funding to a level akin to a “statistical likelihood,” using alternative figures supplied by CBO. CBO’s alternative projects that annual emergency non-defense discretionary funding for natural disasters will equal its average annual levels in 2012-2017, all adjusted for inflation. This knocks $657 billion off CBO’s ten-year deficit and debt. (See Figure 4.) A very small portion of the disaster funding in CBO’s baseline is for programs that we designate as “low-income,” and our lower baseline projection of these costs also assumes the same small share.
End Notes
[1] Arloc Sherman, “Obama’s, and the Safety Net’s, Anti-Poverty Achievement,” CBPP, December 19, 2016, https://www.cbpp.org/blog/obamas-and-the-safety-nets-anti-poverty-achievement.
[2] The budget projections in this analysis come from CBO, with CBPP adjustments that assume discretionary spending for natural disasters will fall to its “statistical likelihood” and removing certain timing anomalies. See Appendix for details. The authors divided all federal programs into two categories: low-income and not low-income.
[3] See “Chart Book: Economic Security and Health Insurance Programs Reduce Poverty and Provide Access to Needed Care,” CBPP, updated March 21, 2018, https://www.cbpp.org/research/poverty-and-inequality/chart-book-economic-security-and-health-insurance-programs-reduce.
[4] Sharon Parrott, Aviva Aron-Dine, Dottie Rosenbaum, Douglas Rice, Ife Floyd, and Kathleen Romig, “Trump Budget Deeply Cuts Health, Housing, and Other Assistance for Low- and Moderate- Income Families,” CBPP, February 14, 2018, https://www.cbpp.org/research/federal-budget/trump-budget-deeply-cuts-health-housing-other-assistance-for-low-and.
[5] Policymakers provided partial relief from sequestration from 2014-2017. In 2018, Congress passed a two-year budget deal that permits higher discretionary funding for 2018 and 2019, but the BCA caps will push discretionary spending down to historically low levels soon thereafter.
[6] For instance, SNAP spending rose considerably during the Great Recession, leveled off in 2012 and 2013 as a percent of GDP, and started declining in 2014. CBO projects that, as the economy continues to recover, SNAP spending will fall to 1995 levels as a percent of the economy. And over the coming decade, CBO projects it will decline from 0.34 percent of GDP to 0.24 percent. For a detailed analysis, see Dottie Rosenbaum and Brynne Keith-Jennings, “SNAP Caseloads and Spending Declines Accelerated in 2016,” CBPP, updated January 27, 2017, https://www.cbpp.org/research/food-assistance/snap-caseload-and-spending-declines-accelerated-in-2016 and Dottie Rosenbaum, “SNAP Caseloads Falling More Quickly in 2017,” CBPP, July 19, 2017, https://www.cbpp.org/blog/snap-caseloads-falling-more-quickly-in-2017.
[7] Health care cost growth slowed to historically low annual rates during the recession and recovery. According to the National Health Expenditure projections from the Office of the Actuary at the Centers for Medicare & Medicaid Services, health spending growth will tick up slightly in the next few years but remain well below pre-recession growth rates. Sean G. Cuckler et al., “National Health Expenditure Projections: 2017-26,” Health Affairs, February 2018, https://www.healthaffairs.org/doi/10.1377/hlthaff.2017.1655.
[8] Richard Kogan, Paul N. Van de Water, and Chloe Cho, “Long-Term Budget Outlook Has Improved Significantly Since 2010 But Remains Challenging,” CBPP, August 18, 2016, https://www.cbpp.org/research/federal-budget/long-term-budget-outlook-has-improved-significantly-since-2010-but-remains.
[9] Cuckler et al., “National Health Expenditure Projections.”
[10] Teresa Coughlin et al., “What Difference Does Medicaid Make?,” Kaiser Family Foundation, May 2013, https://kaiserfamilyfoundation.files.wordpress.com/2013/05/8440-what-difference-does-medicaid-make2.pdf. See also Leighton Ku and Matthew Broaddus, “Public and Private Insurance: Stacking Up the Costs,” Health Affairs (web exclusive), June 24, 2008, https://www.healthaffairs.org/doi/10.1377/hlthaff.27.4.w318.
[11] Social Security Administration, Office of the Chief Actuary, 2018 Trustees Report population projections.
[12] The Medicaid and CHIP Payment and Access Commission (MACPAC), “MACStats: Medicaid and CHIP Data Book,” December 2017, https://www.macpac.gov/publication/macstats-medicaid-and-chip-data-book-2/.
[13] Robert Greenstein, Richard Kogan, and Roderick Taylor, “Program Spending Outside Social Security and Medicare Historically Low as a Percent of GDP and Projected to Fall Further,” CBPP, updated June 26, 2018, https://www.cbpp.org/research/federal-budget/program-spending-as-a-percent-of-gdp-historically-low-outside-social.
[14] SSI and Veterans’ Pensions are the two low-income programs with these timing anomalies. For consistency, we also remove timing anomalies from the historical budget figures.