BEYOND THE NUMBERS
Safety Net’s Anti-Poverty Effectiveness Has Grown Nearly Ten-Fold Since 1967
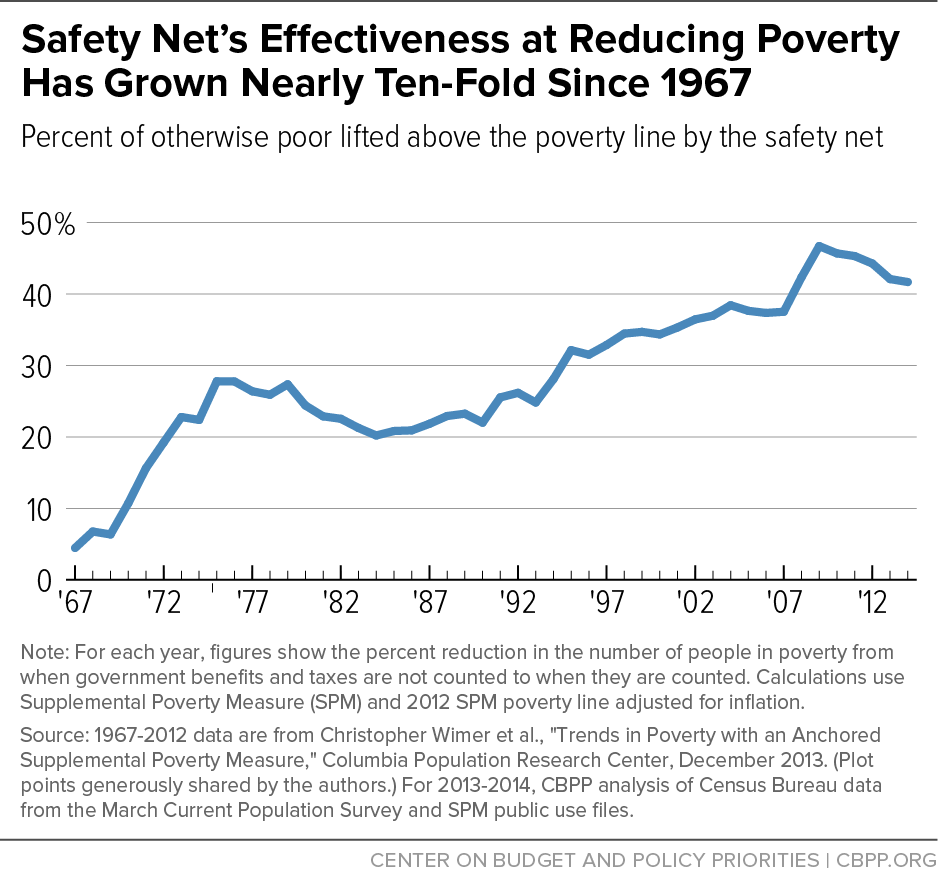
The safety net was nearly ten times more effective at reducing poverty in 2014 as in 1967, new data show.
That is, safety net programs reduced the number of otherwise-poor people by 42 percent in 2014. In sharp contrast, safety net programs cut the number of otherwise-poor people by just a little more than 4 percent in 1967, the first year for which this data is available. (See chart.)
In 2014, before accounting for government benefits and taxes (including tax credits), about 87 million people had incomes below the poverty line. Counting benefits and taxes, however, lowers that number by 36 million people — a drop of 42 percent.
These figures come from our update of a data series by Columbia University researchers. They use the federal government’s Supplemental Poverty Measure (SPM) which, unlike the official poverty measure, counts government non-cash benefits like food assistance, rent subsidies, and tax-based benefits (such as the Earned Income Tax Credit) as income. It also subtracts from a family’s income various taxes, work expenses, and out-of-pocket medical spending. The Columbia researchers measured income levels in each year relative to the 2012 SPM poverty line adjusted for inflation, in order to reflect consistent living standards; we used similar methods to create figures for 2013 and 2014.
The new data confirm a notable finding of the Columbia researchers. If measured without considering the effects of taxes and government income support, the poverty rate is now similar to its 1967 level. But after accounting for these benefits and tax credits, the poverty rate fell from 26 percent in 1967 to 16 percent in 2014.
Moreover, these impressive figures understate the current safety net’s anti-poverty effect. That’s because they don’t account for the benefits that households receive but don’t report when surveyed by the Census Bureau. It’s possible to correct for some of this underreporting of benefits for as recently as 2012. Doing so shows that the safety net reduced poverty by 52 percent, or slightly more than half, that year. (Absent this correction for underreporting, the figure for 2012 was 44 percent.)
To be sure, the safety net lifted a smaller share of the otherwise poor out of poverty in 2014 than in 2009. That, however, is largely due to the expiration or phase-out of some of the 2009 Recovery Act’s temporary boosts in aid, including initiatives such as an increase in SNAP (food stamp) benefit levels, enhancements to unemployment insurance, and the Making Work Pay tax credit.