BEYOND THE NUMBERS
Safety Net Programs Lift Millions From Poverty, New Census Data Show
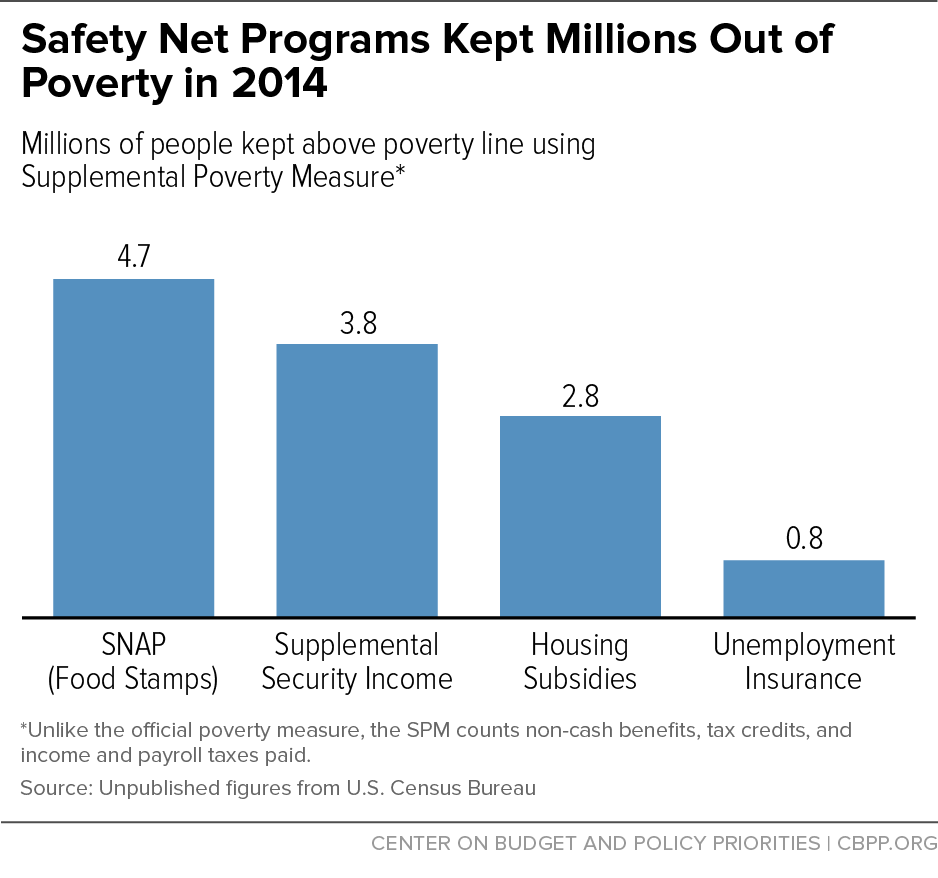
Safety net programs — from Social Security to food and housing assistance to working-family tax credits — kept millions of people above the poverty line in 2014, today’s Census data using the Supplemental Poverty Measure (SPM) show (see chart).
Because the SPM includes taxes and non-cash benefits, it gives a more accurate picture of the impact of anti-poverty programs than the official poverty measure, which counts only cash income. Non-cash and tax-based benefits were small or nonexistent in the 1960s but now constitute a large part of the safety net, so the official poverty measure’s exclusion of them masks the nation’s progress in reducing poverty over the last five decades.
For example, according to the new data:
- SNAP (formerly food stamps) lifted about 4.7 million people above the SPM poverty line (about $25,460 for a typical renter family of four).
- Supplemental Security Income, which assists aged and disabled individuals, lifted about 3.8 million people out of poverty.
- Rent subsidies lifted about 2.8 million people out of poverty.
- Unemployment insurance lifted about 0.8 million people out of poverty.
In addition, two working-family tax credits — the Earned Income Tax Credit and the low-income portion of the Child Tax Credit — lifted roughly 10 million people out of poverty, including more than 5 million children.
Some policymakers and pundits have used comparisons based on the official poverty measure to argue that federal anti-poverty programs are ineffective. But comparing poverty rates in the 1960s and today using the official measure, which doesn’t count programs like SNAP, the EITC, and rental vouchers, implies that the growth of those programs did nothing to reduce poverty, which clearly is not the case.
Columbia University researchers using an SPM-like measure (and adjusting the poverty line for inflation) found that the poverty rate fell from 26 percent in 1967 to 16 percent in 2012 if one includes non-cash and tax-based assistance. Today’s Census figures provide further evidence of the safety net’s strong anti-poverty impact.