

House Reconciliation Bill Proposes Deepest SNAP Cut in History, Would Take Food Assistance Away From Millions of Low-Income Families
More Than 2 Million Children Live in Households That Would Lose at Least Some SNAP Benefits; SNAP Could End in Some States Entirely
Summary
The House-passed Republican reconciliation plan would cut nearly $300 billion from the Supplemental Nutrition Assistance Program (SNAP) through 2034, based on Congressional Budget Office (CBO) estimates — by far the largest cut to SNAP in history.[1] As a result of these cuts and other policies in the legislation — which are being used to pay partly for trillions in tax cuts skewed to the wealthy — millions of people would lose some or all of the food assistance they need to afford groceries, when many low-income households are struggling to afford the high cost of food and other basic needs.
The House Republican plan would cut SNAP, the nation’s most important and effective anti-hunger program, by roughly 30 percent. As a share of the program, the cut would be about twice the size of the deep cuts to food assistance enacted in 1996.[2] And these extreme cuts are deeper than the $230 billion in cuts the budget resolution called for because the bill adds tens of billions of dollars in new spending for farm programs, paid for by taking more food assistance away from people with low incomes.
The bill cuts SNAP benefits by:
Reducing the federal contribution to states’ SNAP programs, cutting federal funding for food benefits in a state by as much as 25 percent, slashing the federal share of states’ administrative costs in half, and shifting those costs to already strained state budgets. When a state doesn’t have sufficient revenues to backfill for these large federal cuts totaling billions nationally, it will have to shift funds from other vital public services, choose how to cut SNAP benefits and restrict the number of people getting help, or opt out of having a SNAP program entirely.
This plan walks away from the 50-year, bipartisan commitment to ensure that low-income children, adults, and seniors get the help they need, regardless of where they live. The consequences of ending SNAP would be severe. Hunger, including childhood hunger, would soar, despite the well-documented detrimental impacts of even short periods of food insecurity on children’s health and cognitive development. Every $1 invested in SNAP for children returns $62 in value over the long-term.[3]
- Expanding SNAP’s harsh, ineffective, and red tape-laden work requirement to more SNAP recipients, including older adults and parents with children 7 and older, putting basic nutrition for millions of children at serious risk. This provision would take food assistance away from roughly 3.2 million adults in a typical month, including 1 million older adults aged 55 through 64 and 800,000 parents of school-aged children, CBO estimates.[4] Terminating SNAP for these 3.2 million adults would also dramatically cut food benefits for everyone who lives with them. As a result, we estimate this would reduce food benefits for roughly 1 million children and a quarter of a million adults aged 65 or older or who have a disability.
- Ending food assistance for 120,000 to 250,000 people with a lawful immigration status, including about 50,000 children. People who have proven they have fled persecution, domestic violence survivors, and victims of sex and labor trafficking are among those whose benefits would be terminated.
- Cutting food benefits for people with low incomes by permanently freezing the cost of the Thrifty Food Plan (TFP) outside of inflation adjustments, increasing the paperwork burden required to get utility deductions, and removing internet costs as an eligible deduction.
The House bill would increase child poverty and hardship. It puts all children at risk of losing some or all of their benefits based on how states respond to the deep cut in federal funding. Based on CBO’s estimates of the impacts of all of the SNAP provisions outside of the cuts to future benefits (the TFP cut and removing internet costs as a deductible expense), we estimate that more than 2 million children will see food assistance to their families cut substantially or terminated.
Even as the risk of a recession remains elevated, the House Republicans’ policies would also substantially weaken SNAP’s ability to respond to economic downturns, worsening hunger and undermining SNAP’s ability to stimulate the economy.

Unprecedented Cut in Federal Funding for Food Benefits Would Jeopardize Food Assistance for Millions of Low-Income People
The House Republicans’ deepest cuts to SNAP would come from an unprecedented structural change that would cut billions of dollars in federal funding for food benefits each year and try to impose those costs on states.
States are in no position to backfill for this massive disinvestment in good times or bad. States are required to balance their budgets each year, so taking on additional costs would require them to raise an equal amount of revenue or cut funding for other public services that people count on, like education, transportation, or health care.[5] And since most states are unlikely to fully bridge the gap, they would likely make up the difference by restricting SNAP eligibility, cutting benefits, or both. Because SNAP is an optional program for states, some states could even opt to end SNAP entirely.
This cut would walk away from a decades-long nationwide commitment to addressing hunger — ensuring that eligible low-income children, adults, and seniors receive a food benefit that allows them to afford an adequate diet regardless of the state they live in. The consequences would be severe — prior to SNAP, childhood hunger was common.[6]
All States Would Face Significant Increased Costs, Many Would Owe Far More
Since SNAP’s start in its current form nearly 50 years ago, the federal government has fully funded the cost of SNAP food benefits while states, which screen for eligibility and issue benefits, have paid roughly half of the cost of administering the program. But the House Republican bill would require all states to pay at least 5 percent of SNAP food benefits starting in fiscal year 2028.
But many, if not most, states would owe far more — up to five times that amount — based on their combined payment error rate, a measure of the under- and over-payments states made in their SNAP programs. (See Figure 2.) Errors largely reflect unintentional mistakes by state workers and households, and the vast majority of households that receive overpayments were indeed eligible for food assistance — they just received an incorrect allotment.[7]
States with an error rate of 6 to 8 percent would owe 15 percent of food benefit costs; states with an error rate of 8 to 10 percent would owe 20 percent, and states with an error rate exceeding 10 percent would owe 25 percent.[8]
Over the last two decades, every state except South Dakota has had an error rate exceeding 6 percent for at least one year. Put another way, virtually every state is at risk of being forced to pay for at least 15 percent of food benefits in at least some years under this proposal. (See Appendix Table 1 for states’ fiscal year 2023 payment error rates — which were higher than usual due to issues stemming from the pandemic — as well as each state’s lowest and highest payment error rate since 2003.)
Even the minimum 5 percent cost-shift would force states to make painful tradeoffs between raising revenue, cutting other state-funded programs and services, or cutting food assistance for low-income families. If every state had needed to pay 5 percent of food benefit costs last year, collectively they would have needed to pay about $4.7 billion.[9]
As just one example, we estimate 5 percent of food benefit costs in Pennsylvania will be about $212 million in 2028 — roughly 1.5 times what the state spent in its 2025 budget on its Attorney General’s office, which prosecutes organized crime and public corruption, conducts statewide criminal investigations, and manages drug enforcement programs. But if Pennsylvania owed 15 percent of food benefits, its required payment would triple to $636 million. That would be more than double what the state spent on community colleges. (See Appendix Table 2 for the range of what each state could owe in 2028, and Appendix Table 3 for examples of how these projected costs compare to other items in a selection of state budgets.)
State error rates vary from year to year, which in practice could introduce significant new complexity to states’ annual budgeting process.[10] From one year to the next, a state would not know with any certainty whether it would be required to pay 5 percent of benefit costs, 15 percent, or even more. A state whose error rate rises from 5.6 percent to 6.0 percent, for instance, would be required to pay three times the amount in food benefit costs — potentially sending state lawmakers scrambling in search of either new revenues or budget cuts to cover the unexpected costs. Further exacerbating the uncertainty, the Department of Agriculture (USDA) finalizes states’ error rates annually in late June, after most states’ legislative sessions have ended and state budgets have been finalized, and the federal fiscal year for which the error rate will apply begins only three months later, in October.

This unprecedented cost-shift would cut federal spending on food benefits by more than $128 billion through 2034, CBO estimates. (See Table 1 for CBO’s cost estimates for each provision.) Nearly $100 billion of that amount would come from states, instead of the federal government, paying for a portion of SNAP benefits based on the cost-shift requirements described above. The remainder, about $30 billion, would come from SNAP benefit cuts; CBO confirms that, “some states would maintain current benefits and eligibility and others would modify benefits or eligibility or possibly leave the program altogether because of the increased costs.”[11]
Across all states, CBO estimates that 1.3 million people in an average month would lose some amount of their SNAP benefits under this provision, and that federal spending on school lunches and breakfasts would be cut by $700 million over the 2028 to 2034 period, affecting 420,000 children in an average month. This calculation likely is the result of school-aged children who would be cut from SNAP due to the state match requirement and thus lose automatic enrollment in free school meals.
It is important to note that the uncertainty around this CBO estimate is substantially greater than is often the case. The amount of the cost-shift is highly dependent on future SNAP error rates, which are uncertain, as described above, and how states would respond to the new funding requirement is unknowable. CBO is responsible to Congress to make assumptions and provide its best estimates, but it is possible that many more people than CBO has estimated could lose all or some of their SNAP benefits under this provision if SNAP error rates are higher in the future and more states are unable or unwilling to fund the required amount.
CBO also has ruled that the provision is an unfunded mandate on states under the Unfunded Mandates Reform Act because “the [states] lack authority to offset those costs while continuing to provide required services.”[12]
Other Bill Provisions Increase Likelihood That States Will Be Forced to Pay More
Other changes in this bill would substantially increase the risk that a state would have to pay these substantially higher amounts. First, it cuts in half (changing from a federal-state match ratio of 50-50 to a ratio of 25-75) the federal funding states receive for program administration — including eligibility determinations, quality control reviews, and fraud investigations — immediately upon enactment. This alone would leave a $27 billion hole in state budgets through 2034, CBO estimates. States that have been improving payment accuracy by investing in staff, training, and technology upgrades may be forced to pull back on those investments given the sharp and immediate cut in federal program administration funding.
Second, the bill also expands what counts as an error by eliminating the current tolerance threshold for small errors ($57 per month per household in fiscal year 2025). While SNAP rules require states to identify, correct, and report on errors below the threshold, excluding them from the payment error rate calculation allows states to focus on preventing and addressing larger errors that cost the federal government more. Eliminating the tolerance threshold would increase the payment error rate for every state, potentially tipping a state over a given threshold and causing it to owe substantially more.[13]
Finally, other provisions in the bill (described below) would substantially increase states’ administrative burden and increase the risk of errors, including dramatically expanding SNAP’s harsh and complex work requirement and eliminating an administrative simplification in calculating utility costs for many households.
This combination — policy changes that make errors more likely, slashing federal resources for states to reduce errors, and adding unprecedented and disproportionate error rate penalties — would align states’ incentives in one direction: to erect barriers so far fewer people receive the food assistance they need and are eligible for. A state, faced with a new requirement to pay hundreds of millions toward the SNAP program, could decide to end SNAP entirely. Whether a state severely restricts access or ends the program entirely, all SNAP participants are at risk of losing all of their benefits, including children, seniors, and people with disabilities. If that happens, hunger will rise and children’s health and development will be seriously harmed.
To Cut Costs, States May End SNAP Food Assistance for Millions of Working Families With Children, Seniors, and People With Disabilities
A long-standing federal policy allows states to modestly expand eligibility and facilitate access to SNAP to additional low-income people. More than 40 states across the political spectrum use the option, known as broad-based categorical eligibility (BBCE), to allow households to save for the future without losing SNAP and to alleviate a work-disincentivizing benefit cliff by modestly raising the income eligibility limit, allowing households’ benefits to phase out more gradually as they increase their earnings. Alleviating benefit cliffs has been a goal shared by policymakers of both parties.
Ending BBCE is one of the few major eligibility options available under federal law if states decide to reduce the size of their SNAP programs, and, by extension, their costs. Doing so nationwide, however, could terminate SNAP eligibility for nearly 6 million people, most of whom are in working families with children, older adults, or people with disabilities. It would also end automatic eligibility for free school meals and streamlined enrollment in WIC for the children cut off SNAP. [14] Indeed, Republicans on the House Agriculture Committee have explicitly described this enormous cost-shift as a mechanism to “hold states accountable” and encourage states to end the use of this option.[15]
Worsening SNAP’s Harsh Work Requirement Would Take Food Away From Families With Children, Older Adults, Veterans, and Others
Under current SNAP rules, most adults aged 18 through 54 without children in their household can receive food benefits for just three months in a three-year period unless they show compliance with a 20-hour-per-week work requirement or prove they qualify for an exemption, such as having a disability.
The House Republican bill would drastically expand the population subject to this harsh, ineffective, and red tape-laden three-month time limit, applying it to adults aged 55 to 64 and adults living with children aged 7 or older for the first time. (See Figure A.) This would put millions of children’s basic food assistance and health at risk if their parents are between jobs or bureaucratic red tape makes it impossible for their parents to prove they are working or should be exempt. In addition, the plan essentially eliminates states’ ability to request temporary waivers of the three-month time limit in areas with higher rates of unemployment or insufficient jobs, substantially increasing the risk that anyone subject to the time limit would have their food benefits terminated.[16]
The bill also sunsets the current exemptions added under the Fiscal Responsibility Act of 2023, allowing exemptions for veterans, people experiencing homelessness, and young people who have aged out of foster care to expire in 2030.
CBO estimates that, together, these provisions would cut 3.2 million adults off SNAP in a typical month, including 1 million older adults aged 55 through 64, 800,000 parents of school-aged children, and 1.4 million adults in areas with insufficient jobs, reducing federal spending by more than $92 billion through 2034. But the harm of this provision would extend much further: when these adults are cut off, their entire households receive reduced food benefits, putting children, people with disabilities, and seniors who live with them at greater risk of hunger. For example, if a mother with a second grader is cut off of SNAP, her family’s benefit would fall from a maximum of $536 per month to just $292, based on this year’s benefit levels. That’s far too little to afford food for two people. In a small number of cases, an adult being cut off SNAP would end eligibility for their entire household.[17]
Expanding Harsh Three-Month Time Limit Would End SNAP for 3.2 Million People, Harm Millions More
We previously estimated that roughly 6 million adults would be at risk of being cut off SNAP in a typical month under the expansion of SNAP’s three-month time limit:
- 1.4 million older adults aged 55 through 64 without children in their household;
- More than 3 million adults aged 18 through 64, who live with more than 4 million children aged 7 to 17 (74 percent of these adults are women);[18] and
- 1.6 million adults aged 18 to 54, based on the share of people who are currently subject to the work requirement but live in a waived area in a typical year.[19]
CBO’s projection that the bill would end SNAP eligibility and cut off roughly 3.2 million of these 6 million adults at risk of losing SNAP is consistent with research findings that SNAP’s time limit cuts off a large share of those subject to it without increasing their employment or earnings.[20]
Of the 3.2 million adults cut off SNAP, we estimate this would reduce food benefits for roughly 1 million children aged 7 through 17, putting them at greater risk of hunger. Similarly, about a quarter of a million adults aged 65 or older or who have a disability would see the food assistance their families receive significantly reduced when someone they live with is cut off SNAP.
Finally, though CBO estimates that 3.2 million adults will be cut off SNAP, the larger number of 6 million adults at risk of losing SNAP is important: it represents the number of people who would be newly subject to the work requirements and therefore would have to document their work hours or prove that they qualify for an exemption. And states would have to screen for exemptions and process work documentation for the larger number of individuals — at the same time the bill cuts federal funding for these activities in half, as described above.
Curtailing State Waivers Would Take Food Away From Unemployed Workers Struggling to Find Jobs, Worsen Recessions
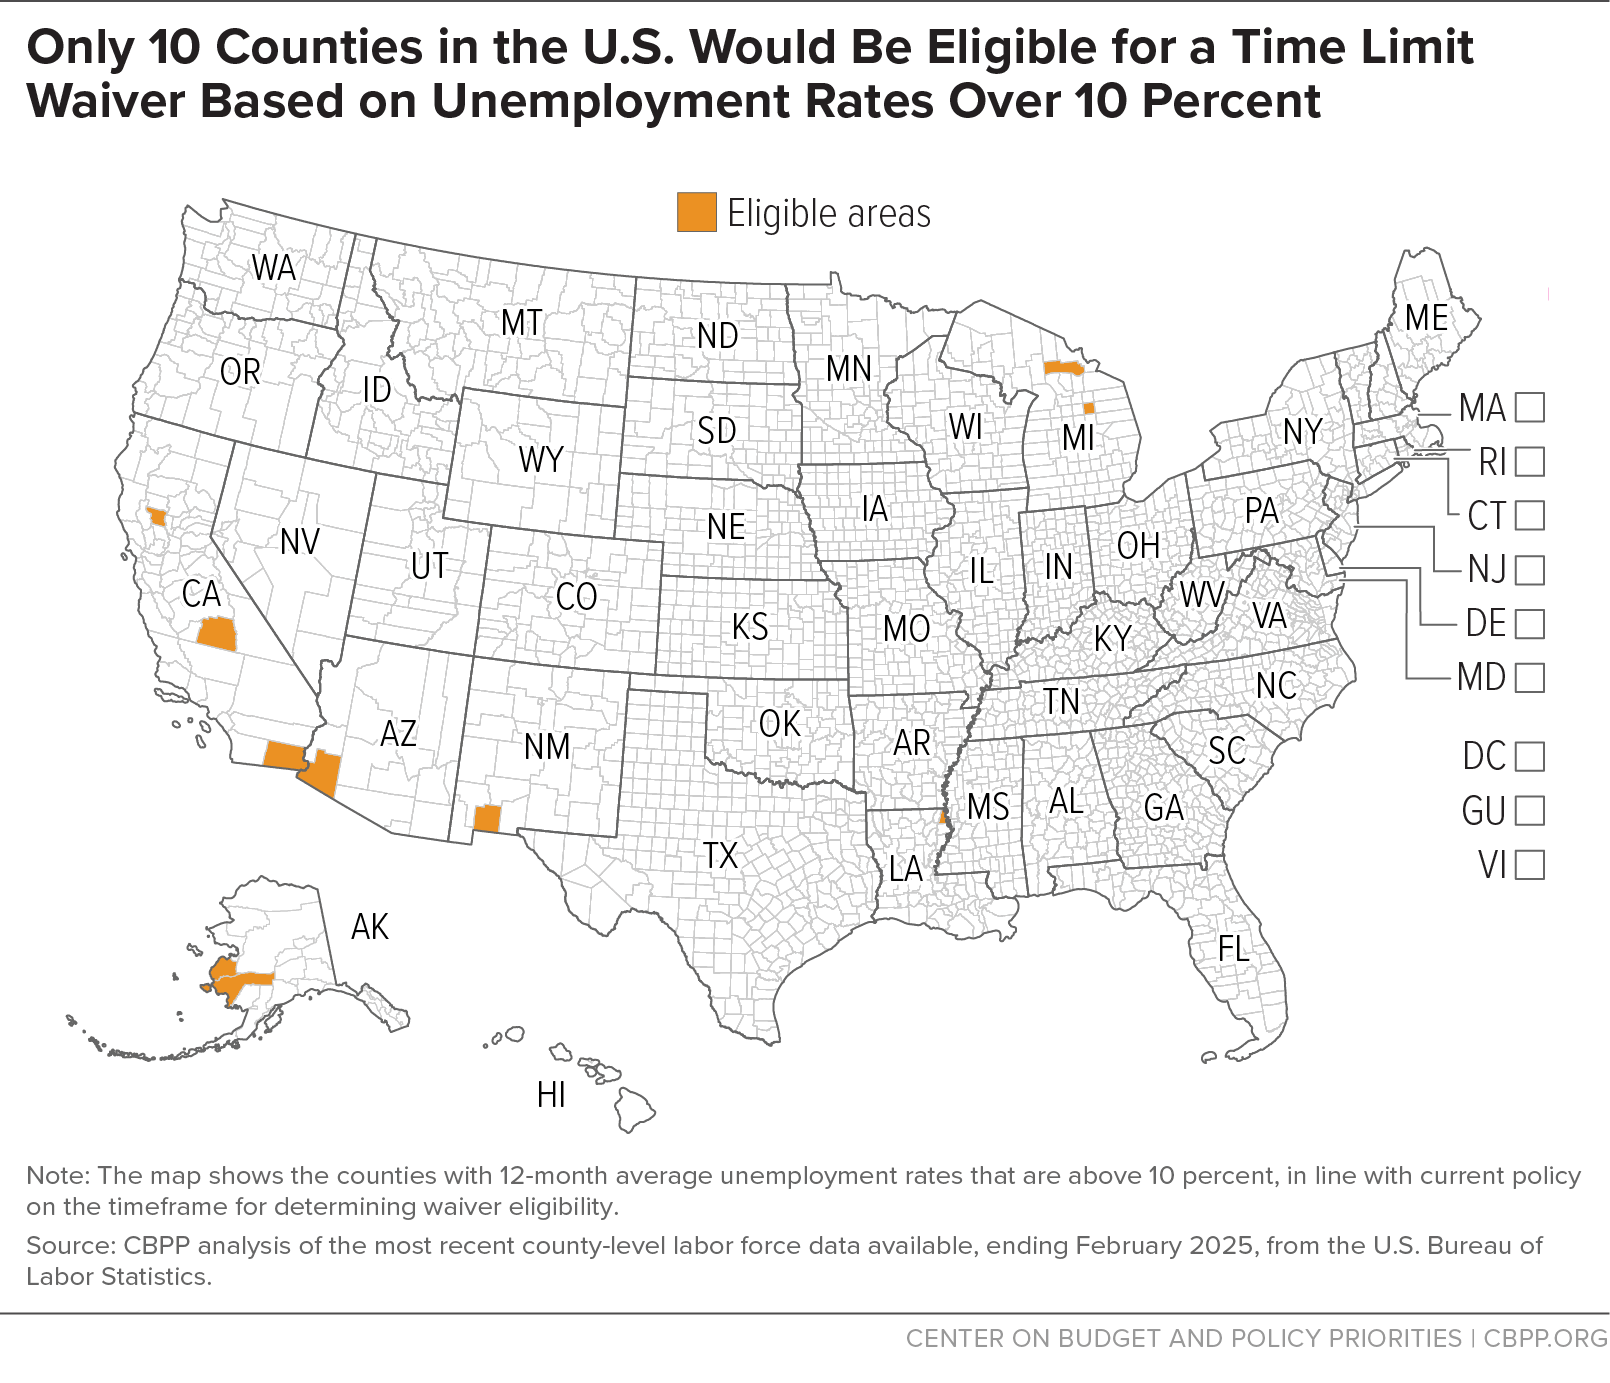
The provision restricting temporary waivers of the three-month time limit would substantially worsen the harm of this dramatically expanded work requirement, particularly in local areas with weaker economies and higher unemployment, including many rural and tribal communities, and when the national economy is weaker. Only counties or county-equivalents with an unemployment rate over 10 percent would qualify for a waiver. We estimate that only ten counties in the country would currently qualify for a waiver under these criteria. (See Figure 3).

But many unemployed workers need longer than three months to find a job. Even when national unemployment is below 5 percent, 1 in 3 workers are out of work for 15 weeks or longer.[21] And due to structural racism, ageism, and other forms of discrimination, people in some racial groups and older workers are more likely to be unemployed for longer periods.[22] For example, a larger share of workers who are Black (43 percent), Asian (42 percent), or aged 55 through 64 (44 percent) were unemployed for 15 weeks or longer in 2024, a year the unemployment rate ranged from 3.7 to 4.2 percent.[23]
Additionally, the population at risk of being cut off SNAP typically faces additional barriers to securing steady employment. Based on our analysis, more than 4 out of 5 people who would be at risk of being cut off SNAP by this policy have at most a GED or high school diploma.[24] These individuals may have more limited employment opportunities and may need longer than three months to find new work when they are between jobs.
Cutting people off SNAP after three months who are looking for a job but can’t find one due to economic conditions or because they face barriers to employment would substantially worsen hunger and undermine SNAP’s ability to stimulate the economy, making future recessions far longer and more damaging.
Ending SNAP for Many People With Lawful Immigration Status, Including Children, Would Worsen Hunger
The House Republican plan would end SNAP for hundreds of thousands of currently eligible immigrants, restricting food benefits only to U.S. citizens, lawful permanent residents (LPR, also known as green card holders), certain Cuban entrants, and Compacts of Free Association (COFA) citizens.[25]
SNAP has complex and restrictive eligibility rules for immigrants. People without a documented immigration status are not and have never been eligible for food benefits. But even many low-income people who are lawfully residing in the United States and otherwise meet SNAP’s eligibility criteria are excluded from participating in the program. For example, adult lawful permanent residents are generally not eligible for SNAP unless they have lived in the U.S. for at least five years.[26] In part due to these complicated eligibility rules, only half of eligible immigrants participate in SNAP.[27]
The people who would be cut off SNAP by this provision are primarily refugees and individuals who have been granted asylum — people who have fled their homes seeking safety from persecution and violence and have been heavily vetted by the U.S. government in order to be granted this humanitarian relief. Others losing food assistance under the provision include certain immigrants who are victims of domestic violence (as well as their children and parents) and certain survivors of labor or sex trafficking. In 2023, according to program data, 434,000 refugees and people granted asylum received SNAP, representing 1.1 percent of participants.[28] More than 100,000 were children. CBO estimates that the provision would take food assistance away from between 120,000 and 250,000 people and would cut federal spending by $3.9 billion through 2034. We estimate that roughly 50,000 children would be cut from SNAP in an average month under this provision, despite the evidence that even short periods of food insecurity hurt children’s health and cognitive development, as described above.
In CBO’s estimate, cuts are higher in the near term and lower in the longer term. This is likely because people in these statuses have a path to apply for LPR status, and the U.S. is currently admitting fewer refugees and making it harder for people to apply for asylum.
Other Provisions Would Cut Food Benefits for Low-Income Households
In addition to ending SNAP eligibility for millions of SNAP participants, the bill would also cut the amount of food benefits households receive.
Restricts Thrifty Food Plan Updates, Harming All SNAP Recipients in the Future
The bill would cut SNAP food benefits by roughly $35 billion over the next decade, based on CBO estimates, by blocking increases in the cost of the U.S. Department of Agriculture’s (USDA) Thrifty Food Plan (TFP) outside of inflation adjustments — regardless of the evidence about the changing cost of a healthy diet.[29] The TFP is a market basket of foods that represents a nutritionally adequate diet at minimal cost.
In 2021, based on a bipartisan statutory requirement to periodically re-evaluate the TFP, the USDA revised the TFP to more accurately reflect the cost of a healthy diet. That update resulted in a modest but meaningful benefit increase for all SNAP participants, though benefits today stand at just an average of $6.20 per person per day. The updated benefit levels lifted more than 2 million SNAP participants above the poverty line when it took effect, according to the Urban Institute, with the greatest poverty-reducing impact for Black and Hispanic individuals.[30]
Future TFP re-evaluations, now required by law to occur every five years, are essential to ensuring that SNAP benefits reflect the changing cost of a healthy diet. (See Figure 4.)



But the bill would return SNAP to the de facto policy prior to 2021, in which the cost of the TFP was adjusted only for inflation, regardless of whether the cost of a healthy diet increased by more.
Every SNAP participant would experience a benefit cut: roughly $7 less per person per month over the 2027-2031 period and $15 less per month over 2032-2034, we estimate. Since SNAP benefits under CBO’s baseline will average only about $7 per person per day in 2027, rising to about $8 in 2032 and 2033, the cut would equal a day’s worth of benefits each month initially, rising to almost two days’ worth by the end of the decade.
After 2034, SNAP benefits would likely fall further behind the cost of a healthy diet, resulting in an even deeper benefit cut in subsequent years.
In addition to cutting future SNAP benefits for all participants, people who participate in several other programs would experience a cut because those programs’ benefits or grant amounts also are tied to the Thrifty Food Plan, including:
- the Emergency Food Assistance Program, which provides food for food banks and food pantries to distribute to individuals and families would receive about $100 million less through 2034;
- the Nutrition Assistance Program block grant, which funds nutrition assistance in Puerto Rico and American Samoa (two of the U.S. territories that are excluded from SNAP), would receive nearly $1 billion less through 2034; and
- the new Summer EBT program, which provides grocery benefits to children in low-income families during the summer when schools are closed, would be reduced by nearly $1 billion through 2034.
These figures are based on CBPP estimates under CBO’s June 2024 baseline assumptions.
Cutting Food Benefits for Many Households With Utility Costs
The bill includes two cuts related to SNAP’s Standard Utility Allowances (SUAs), a component of SNAP’s excess shelter deduction. States can use SUAs to reflect typical utility bills for households incurring utility costs in that state rather than require each household to provide — and state eligibility workers to review — the household’s many monthly utility bills. Qualifying for an SUA can increase the SNAP allotment a household receives, reflecting that resources spent on utility costs are not available to the household to purchase food.
Severing the LIHEAP/SUA simplification. Currently, states can use a household’s receipt of benefits under the Low Income Home Energy Assistance Program (LIHEAP) or other energy assistance to qualify them for the SUA. The House Republican bill would cut some SNAP households’ food benefits immediately upon enactment by eliminating this administrative simplification for all households that do not include an elderly or disabled member — another way the bill targets children and parents. This change would require many more households to provide documentation of utility costs to continue receiving the SUA, reducing SNAP benefits for households that struggle to produce verification of their utility bills and increasing the administrative burden on state agencies. This change would cut food benefits by roughly $100 per month for about 3 percent of SNAP households (roughly 600,000 households) in an average month, totaling almost $6 billion through 2034, CBO estimates. We estimate that more than 500,000 children would be in these households, based on SNAP program data.
Preventing SNAP from accounting for internet costs. The bill would block a revision to the SUA to incorporate the cost of basic internet service from going into effect on October 1, 2025. This would lower future benefit allotments for many SNAP households. Prohibiting this change from going into effect would cut SNAP food assistance by roughly $10 per month for roughly 65 percent of SNAP households (about 13 million households) in an average month, totaling almost $11 billion through 2034, CBO estimates. Allowing SNAP to account for internet service costs was proposed by the first Trump Administration in 2019, in recognition that access to the internet is essential for many aspects of modern life, including education and employment. People subject to the work requirement may also need to document their hours through an online system.
Remaining Provisions Would Impact Other Programs
Allowing SNAP’s National Accuracy Clearinghouse to be used for other programs. The National Accuracy Clearinghouse (NAC) is an interstate data matching system to prevent rare cases of duplicate participation in SNAP, when an individual receives benefits simultaneously in more than one state. The bill would expand the use of the NAC to prevent duplicate participation in other programs that are administered by a state using the same integrated eligibility system, which would include Medicaid in many states. This is a worthwhile program integrity improvement if the change protects individuals’ privacy and action is taken only after the SNAP agency has finished its investigation of the circumstances. The change would reduce federal spending by more than $7 billion through 2034, CBO estimates.
Ending SNAP nutrition education. The bill would end the Nutrition Education and Obesity Prevention Grant Program, more commonly known as SNAP-Ed. SNAP-Ed programs are implemented by state agencies and partnering organizations in every state to provide nutrition education and other public health programs targeted to SNAP participants and other people with low incomes. This would reduce federal spending by more than $5 billion through 2034, CBO estimates.
Extending Farm to Food Bank initiatives. The bill would extend current mandatory funding levels ($4 million annually) for TEFAP Farm to Food Bank projects through 2031. CBO estimates that this would increase federal spending by $28 million through 2034.
| TABLE 1 | ||
|---|---|---|
Congressional Budget Office (CBO) Estimate of Nutrition Changes in the House Agriculture Committee Reconciliation Bill (Subtitle A) | ||
| As ordered reported by the House Budget Committee on May 18. When combined with Subtitle B, which increases spending by $56 billion through 2034, the net estimated cut is -$238 billion, which satisfies the Agriculture Committee’s reconciliation instruction to cut $230 billion from programs in its jurisdiction by 2034. | ||
| Sec. | Provision | CBO Cost Estimate 2026-2034 |
| 10006 | Require states to pay 5 to 25 percent of SNAP benefits | -$128 billion |
| 10002 and 10003 | Expand SNAP’s work requirements to include adults with school-aged children, older adults ages 55-64, and people living in areas with insufficient jobs | -$92 billion |
| 10001 | Cut future SNAP benefits by restricting updates to the Thrifty Food Plan to account only for food inflation | -$37 billion |
| 10007 | Require states to pay 75 percent of SNAP administrative costs instead of 50 percent | -$27 billion |
| 10005 | Block inclusion of internet costs in state Standard Utility Allowances (SUAs) | -$11 billion |
| 10009 | Expand SNAP’s duplicate enrollment prevention process (the National Accuracy Clearinghouse) to include other co-administered federal and state benefit programs | -$7 billion |
| 10004 | Repeal of SUA simplification, except for households with elderly or disabled members | -$6 billion |
| 10011 | Eliminate SNAP National Education and Obesity Prevention Grant Program (SNAP-Ed) | -$5 billion |
| 10010 | Eliminate Quality Control (QC) error tolerance threshold | -$0.080 billion |
| 10008 | Conforming amendment to general work requirement | $0 billion |
| 10012 | Eliminate SNAP eligibility for people granted refugee, asylum, or certain other immigration statuses | -$4 billion |
| 10013 | Emergency food assistance | +0.028 billion |
| Interactions among provisions | +$24 billion | |
| Total Subtitle A ― Nutrition | -$295 billion | |
Based on CBO estimates published May 20, 2025. | ||
Appendix
| APPENDIX TABLE 1 | |||
|---|---|---|---|
States’ SNAP Error Rates Vary Substantially; Based on Past History, Most States Could Face at Least a 15% or Higher Cost-Shift at Some Point | |||
| Only 1 state has never had an error rate above 6% in data back to 2003 (the beginning of the current SNAP sanction system) | |||
| State | 2023 State Combined Payment Error Rate | Lowest Error Rate Between 2003 to 2023 | Highest Error Rate Between 2003 to 2023 |
| Alabama | 7.07 | 1.70 | 8.02 |
| Alaska | 60.37 | 0.76 | 60.37 |
| Arizona | 11.39 | 4.68 | 11.39 |
| Arkansas | 9.57 | 4.02 | 11.31 |
| California | 13.40 | 3.63 | 13.40 |
| Colorado | 8.61 | 2.72 | 8.67 |
| Connecticut | 8.91 | 4.94 | 10.50 |
| Delaware | 22.80 | 1.15 | 22.80 |
| District of Columbia | 20.26 | 3.03 | 20.26 |
| Florida | 12.60 | 0.42 | 12.60 |
| Georgia | 12.07 | 1.99 | 14.98 |
| Guam | 18.01 | 4.24 | 18.01 |
| Hawai'i | 20.94 | 3.04 | 21.78 |
| Idaho | 3.42 | 1.25 | 11.31 |
| Illinois | 9.91 | 1.70 | 10.91 |
| Indiana | 10.46 | 2.60 | 10.46 |
| Iowa | 5.19 | 3.36 | 12.47 |
| Kansas | 12.07 | 0.75 | 12.07 |
| Kentucky | 7.27 | 4.09 | 7.27 |
| Louisiana | 6.65 | 1.44 | 8.00 |
| Maine | 13.48 | 2.16 | 19.12 |
| Maryland | 18.98 | 2.12 | 35.56 |
| Massachusetts | 9.86 | 2.87 | 11.77 |
| Michigan | 10.72 | 2.70 | 13.00 |
| Minnesota | 6.40 | 3.95 | 9.78 |
| Mississippi | 10.15 | 1.16 | 10.15 |
| Missouri | 10.54 | 1.50 | 13.03 |
| Montana | 6.04 | 2.71 | 9.97 |
| Nebraska | 7.06 | 1.54 | 7.34 |
| Nevada | 6.71 | 2.86 | 8.25 |
| New Hampshire | 12.53 | 3.01 | 12.53 |
| New Jersey | 35.70 | 1.32 | 35.70 |
| New Mexico | 14.40 | 3.73 | 14.40 |
| New York | 12.68 | 3.33 | 12.89 |
| North Carolina | 9.72 | 2.23 | 19.07 |
| North Dakota | 9.51 | 1.73 | 9.51 |
| Ohio | 7.01 | 2.30 | 9.17 |
| Oklahoma | 10.64 | 3.78 | 10.64 |
| Oregon | 16.76 | 3.54 | 22.99 |
| Pennsylvania | 16.61 | 2.71 | 16.61 |
| Rhode Island | 12.40 | 3.67 | 22.66 |
| South Carolina | 22.57 | 1.09 | 22.57 |
| South Dakota | 3.27 | 0.75 | 3.27 |
| Tennessee | 12.56 | 1.08 | 19.79 |
| Texas | 6.70 | 0.63 | 7.86 |
| Utah | 5.09 | 2.11 | 6.61 |
| Vermont | 3.45 | 2.76 | 9.66 |
| Virgin Islands | 10.29 | 1.93 | 10.29 |
| Virginia | 9.86 | 0.44 | 10.52 |
| Washington | 6.74 | 0.77 | 9.33 |
| West Virginia | 10.98 | 4.90 | 10.98 |
| Wisconsin | 5.15 | 1.11 | 9.32 |
| Wyoming | 5.19 | 2.42 | 9.63 |
| United States | 11.68 | 3.20 | 11.68 |
Source: SNAP Quality Control Payment Error Rates, https://www.fns.usda.gov/snap/qc/per | |||
| APPENDIX TABLE 2 | ||||
|---|---|---|---|---|
States Would Be Hit Hard by the 5% to 25% Cost-Shift in the House Agriculture Committee’s Reconciliation Bill | ||||
| State | State Share of 5% Cost-Shift in FY2028 (millions) (under 6% error rate) | State Share of 15% Cost-Shift in FY2028 (millions) (6% to 7.99% error rate) | State Share of 20% Cost-Shift in FY2028 (millions) (8% to 9.99% error rate) | State Share of 25% Cost-Shift in FY2028 (millions) (10% or higher error rate) |
| Alabama | $86 | $258 | $344 | $431 |
| Alaska | $12 | $37 | $50 | $62 |
| Arizona | $100 | $300 | $400 | $501 |
| Arkansas | $27 | $82 | $109 | $137 |
| California | $615 | $1,844 | $2,458 | $3,076 |
| Colorado | $65 | $194 | $259 | $324 |
| Connecticut | $44 | $133 | $177 | $222 |
| Delaware | $13 | $38 | $51 | $63 |
| District of Columbia | $16 | $48 | $63 | $79 |
| Florida | $328 | $984 | $1,312 | $1,641 |
| Georgia | $162 | $487 | $649 | $812 |
| Guam | $6 | $18 | $24 | $30 |
| Hawai'i | $36 | $109 | $145 | $182 |
| Idaho | $14 | $42 | $56 | $70 |
| Illinois | $222 | $666 | $888 | $1,111 |
| Indiana | $71 | $214 | $285 | $356 |
| Iowa | $26 | $79 | $105 | $131 |
| Kansas | $20 | $61 | $81 | $101 |
| Kentucky | $57 | $172 | $229 | $286 |
| Louisiana | $95 | $283 | $378 | $473 |
| Maine | $18 | $54 | $72 | $90 |
| Maryland | $75 | $223 | $298 | $373 |
| Massachusetts | $130 | $390 | $520 | $651 |
| Michigan | $152 | $456 | $608 | $761 |
| Minnesota | $43 | $128 | $170 | $213 |
| Mississippi | $42 | $125 | $167 | $209 |
| Missouri | $75 | $225 | $300 | $376 |
| Montana | $8 | $25 | $34 | $42 |
| Nebraska | $16 | $49 | $66 | $82 |
| Nevada | $50 | $150 | $200 | $250 |
| New Hampshire | $8 | $23 | $31 | $38 |
| New Jersey | $96 | $287 | $383 | $479 |
| New Mexico | $51 | $153 | $204 | $255 |
| New York | $366 | $1,095 | $1,461 | $1,828 |
| North Carolina | $146 | $438 | $584 | $731 |
| North Dakota | $6 | $17 | $22 | $28 |
| Ohio | $158 | $473 | $631 | $790 |
| Oklahoma | $75 | $224 | $299 | $374 |
| Oregon | $79 | $238 | $317 | $397 |
| Pennsylvania | $212 | $636 | $848 | $1,061 |
| Rhode Island | $17 | $51 | $68 | $85 |
| South Carolina | $64 | $193 | $257 | $321 |
| South Dakota | $9 | $27 | $36 | $45 |
| Tennessee | $81 | $242 | $322 | $403 |
| Texas | $358 | $1,074 | $1,432 | $1,792 |
| Utah | $19 | $57 | $76 | $95 |
| Vermont | $7 | $22 | $29 | $37 |
| Virgin Islands | $4 | $10 | $14 | $18 |
| Virginia | $88 | $263 | $351 | $439 |
| Washington | $95 | $286 | $381 | $477 |
| West Virginia | $28 | $84 | $112 | $141 |
| Wisconsin | $68 | $203 | $271 | $339 |
| Wyoming | $3 | $8 | $11 | $14 |
| United States | $4,664 | $13,979 | $18,639 | $23,321 |
Note: Based on each state’s share of fiscal year 2024 benefit issuance and projected benefit costs in 2028 under the Congressional Budget Office’s June 2024 baseline, assuming each state’s share of the national total is the same as its share in fiscal year 2024, adjusted for a separate provision freezing the cost of the Thrifty Food Plan outside of inflation adjustments. These estimates do not account for other provisions in the bill that would directly cut food benefits and terminate eligibility for many SNAP participants, reducing each state’s obligation. Puerto Rico, American Samoa, and the Commonwealth of the Northern Mariana Islands are not included in this table because they receive a nutrition assistance block grant in lieu of participation in SNAP. | ||||
| APPENDIX TABLE 3 | ||||
|---|---|---|---|---|
House Republican Reconciliation Bill SNAP Cost-Shift Would Force States to Make Painful Tradeoffs | ||||
| Projected costs under proposed state payment of share of SNAP food benefit costs compared to other items in a selection of state budgets | ||||
| State | 5% match $ (millions) | 5% match comparison | 15% match $ (millions) | 15% match comparison |
| Alabama | $86 | Annual state spending for the Department of Agriculture and Industries, which supports farmers, ensures food is safe to consume, and runs the state’s farm to school program ($85m). | $258 | Annual state spending for the Alabama Law Enforcement Agency, which runs the highway patrol, issues driver’s licenses, and runs state criminal investigations ($237m). |
| Alaska | $12 | Annual state spending for the Alaska Performance Scholarship award, a merit-based scholarship program that supports high school students attending post-secondary institutions in the state ($12m). | $37 | Annual state spending for foster care services, which serve approximately 3,000 children monthly ($34m). |
| Arizona | $100 | Annual state spending for the community college system, which serves more than 118,000 students ($96m). | $300 | Close to total the annual state spending for the Department of Forestry and Fire Management ($51m) and the Department of Public Safety ($264m) combined. |
| Arkansas | $27 | Annual state spending for the Department of Agriculture, which develops and implements policies and programs to support agriculture, forestry, natural resources, and food safety ($28m). | $82 | Two times annual state spending for higher education grants and scholarships including the Arkansas Future (ArFuture) program, which covers tuition and fees for students in STEM and high-demand fields ($41m). |
| California | $615 | Half of annual state spending for the Housing Financial Assistance Program, which increases housing supply by providing loans and grants to develop and preserve safe and affordable housing for lower-income households ($1.2b). | $1,844 | Annual state spending for the Department of Public Health, which protects and promotes health and well-being through health quality, health emergency response, and population health programs ($1.9b). |
| Colorado | $65 | More than three-fourths of annual state spending for the Department of Agriculture, which supports farmers and ranchers, ensures a safe food supply, and promotes environmental stewardship ($77m). | $194 | Two-thirds of annual state spending for the Department of Public Safety, whose responsibilities include the state highway patrol, Bureau of Investigation, and fire prevention and code enforcement ($284m). |
| Georgia | $162 | Three times annual state appropriations for the Indigent Care Trust Fund, which supports rural and other health care providers, primarily hospitals, that serve medically indigent Georgians ($53m). | $487 | Two times annual state spending for child welfare services, including investigating allegations of child abuse, abandonment, and neglect and providing services to protect children and strengthen families generally ($244m). |
| Kansas | $20 | More than annual state spending for the Office of Veterans Services, which works to ensure all veterans have access to the benefits they earned through military service and provides long-term nursing and assisted living care ($16m). | $61 | More than annual state spending for the Department of Agriculture, which supports and assists farmers, ranchers, food establishments, and agribusiness ($51m). |
| Louisiana | $95 | Annual state spending for the Department of Agriculture and Forestry, whose services include food safety and inspection, forest and fire management, soil and water conservation, and food distribution ($93m). | $283 | Nearly three times annual state spending for services for the aging population through the Office of Aging and Adult Services and the Office of Elderly Affairs, including senior centers and access to quality long-term care ($106m). |
| Maine | $18 | Funding approved last year for a rent relief pilot program under the Maine State Housing Authority that pays up to $800 per month directly to landlords for up to two years for people with low incomes who are at risk of eviction ($18m). | $54 | More than annual state spending for the child care subsidy program, which provides subsidies for qualifying families and supports training for child care providers ($46m). |
| Maryland | $75 | Close to total annual state spending for grants to early childhood programs for at-risk students ($41m) and the Department of Aging ($41m) combined. | $223 | Roughly half of annual state spending for the Department of State Police ($452m). |
| Massachusetts | $130 | Total annual state spending for veterans’ services ($106m) and transportation to school for elementary school students who are homeless ($28m) combined. | $390 | Annual state spending for community colleges, which serve more than 77,000 students ($382m). |
| Michigan | $152 | More than annual state spending for the Department of Agriculture and Rural Development, which promotes food safety and provides assistance to farmers ($137m). | $456 | Roughly annual state spending for community colleges, which serve more than 280,000 students ($462m). |
| Mississippi | $42 | Nearly four times annual state spending for the Department of Agriculture and Commerce, which supports farmers, ensures food safety, and helps market the state’s agricultural products ($12m). | $125 | More than annual state spending on public health programs, including testing drinking water, preventing and tracking infectious disease, and fire safety ($108m). |
| Missouri | $75 | Roughly half of annual state spending for the Department of Economic Development, which supports businesses and helps develop a skilled workforce ($154m). | $225 | Two times annual state spending for the Department of Agriculture, which supports farmers and promotes the state's agriculture industry ($114m). |
| Nebraska | $16 | Roughly half of annual state spending for financial assistance and scholarship support for Nebraska students attending state universities and community colleges ($30m). | $49 | Close to total annual state spending for early childhood education programs ($11m), public health ($11m), programs to support the aging population ($12m), and rural broadband ($20m) combined. |
| New Jersey | $96 | Three-fourths of annual state spending for support and services for military members, veterans, and their families ($125m). | $287 | Annual state spending for county colleges, which serve more than 168,000 students ($290m). |
| New York | $366 | Roughly annual state spending for the Department of Environmental Conservation, which protects the state's natural resources and prevents and abates water and air pollution ($351m). | $1,095 | More than annual state spending for the state police, who promote highway safety and help local police respond to criminal activity such as burglaries, missing children, assaults, robberies, and homicides ($981m). |
| North Carolina | $146 | Annual state spending for the Division of Public Health, which works to stop the spread of infectious diseases, ensures food and water safety, and provides supports to protect and promote the health and well-being of infants and mothers ($134m). | $438 | Total annual state spending for child development and early education, which supports the Smart Start program, subsidized child care, and pre-K programs ($254m), and agriculture and consumer services ($182m), which promote and improve agriculture, agribusiness, and forest management, combined. |
| Ohio | $158 | Annual state spending for the Department of Natural Resources, which oversees state parks, wildlife resources, forest management, and regulation of the state’s oil and natural gas industry ($163m). | $473 | Three-quarters of annual state spending for the Department of Mental Health and Addiction Services ($600m). |
| Pennsylvania | $212 | About 1.5 times annual state spending for the Attorney General's office, which prosecutes organized crime and public corruption, conducts statewide criminal investigations, and manages drug enforcement programs ($144m). | $636 | More than two times annual state spending for community colleges, which serve more than 160,000 students ($277m). |
| Texas | $358 | More than five times annual state spending for the Texas Veterans Commission, which provides job assistance, health care, and educational access for veterans ($67m). | $1,074 | Roughly one-quarter of annual state spending for the Department of Criminal Justice, which manages more than 146,000 people in state correctional facilities and supervises people on parole or mandatory supervision ($4.3b). |
Sources: CBPP analysis of state budget documents; Katie Bergh and Dottie Rosenbaum, “House Agriculture Committee Proposal Would Worsen Hunger, Hit State Budgets Hard,” CBPP, May 13, 2025, https://www.cbpp.org/research/food-assistance/house-agriculture-committee-proposal-would-worsen-hunger-hit-state-budgets | ||||
End Notes
[1] Congressional Budget Office (CBO), “Estimated Budgetary Effects of a Bill to Provide for Reconciliation Pursuant to Title II of H. Con. Res. 14, the One Big Beautiful Bill Act, as ordered reported by the House Committee on the Budget on May 18, 2025,” May 20, 2025, https://www.cbo.gov/publication/61420, and CBO, Letter to the Honorable Amy Klobuchar and the Honorable Angie Craig, May 22, 2025, https://www.cbo.gov/system/files/2025-05/Klobuchar-Craig-Letter-SNAP_5-22-25.pdf
[2]CBPP analysis of the proposed cut relative to the CBO SNAP baseline. The House Republican plan proposes a $295 billion cut, which is roughly 30 percent of the June 2024 CBO baseline over fiscal years 2026 through 2034. At the time of enactment, the Personal Responsibility and Work Opportunity Reconciliation Act of 1996 was estimated to be an approximately 15 percent cut relative to SNAP’s baseline. See Congressional Budget Office, “Federal Budgetary Implications of the Personal Responsibility and Work Opportunity Reconciliation Act of 1996, December 1996, https://www.cbo.gov/sites/default/files/104th-congress-1995-1996/reports/1996doc32.pdf.
[3] Joseph Llobrera, “SNAP Food Assistance Is a Sound Investment in Our Nation’s Health, Well-Being, and Economy,” CBPP, April 4, 2025, https://www.cbpp.org/blog/snap-food-assistance-is-a-sound-investment-in-our-nations-health-well-being-and-economy.
[4] CBO, 2025, op. cit.
[5] Wesley Tharpe, “Shifting Federal Costs for Food Assistance, Health Care, Other Priorities to States Would Cause Widespread Harm, CBPP, April 9, 2025, https://www.cbpp.org/blog/shifting-federal-costs-for-food-assistance-health-care-other-priorities-to-states-would-cause.
[6] Nick Kotz, “Hunger in America: The Federal Response,” The Field Foundation, 1979; Brynne Keith-Jennings, Joseph Llobrera, and Stacy Dean, “Links of the Supplemental Nutrition Assistance Program With Food Insecurity, Poverty, and Health: Evidence and Potential,” American Journal of Public Health, 109, 1636-1640, https://ajph.aphapublications.org/doi/abs/10.2105/AJPH.2019.305325; and Dorothy Rosenbaum and Zoë Neuberger, “Food and Nutrition Programs: Reducing Hunger, Bolstering Nutrition, August 2005, 7-19-05fa-rev.doc.
[7] Dottie Rosenbaum and Katie Bergh, “SNAP Includes Extensive Payment Accuracy System,” CBPP, updated June 21, 2024, https://www.cbpp.org/research/food-assistance/snap-includes-extensive-payment-accuracy-system.
[8] The bill also maintains the current penalty structure for states with persistently high error rates on top of requiring states to pay a large share of benefit costs, potentially adding millions of dollars to what a state may be required to pay.
[9] Katie Bergh and Dottie Rosenbaum, “House Agriculture Committee Proposal Would Worsen Hunger, Hit State Budgets Hard,” CBPP, May 13, 2025, https://www.cbpp.org/research/food-assistance/house-agriculture-committee-proposal-would-worsen-hunger-hit-state-budgets.
[10] “State Budgets Basics,” Center on Budget and Policy Priorities, revised May 24, 2022, https://www.cbpp.org/research/policy-basics-the-abcs-of-state-budgets.
[11] CBO, 2025, op. cit.
[12] CBO, 2025, op. cit.
[13] CBO estimates that, in isolation, eliminating the tolerance threshold would cut federal spending by $80 million through 2034. It is not clear how CBO’s estimates address the elimination of the tolerance threshold likely increasing the percentage of food benefit costs many states are required to pay beginning in fiscal year 2028.
[14] USDA estimates that 5.6 million participants were eligible through BBCE policies and would not otherwise have been eligible for SNAP in FY22. Current caseloads are slightly higher, and additional states have since adopted more generous BBCE policies, so the impact would likely be greater now. See Alma Vigil and Nima Rahimi, “Trends in Supplemental Nutrition Assistance Program Participation Rates: Fiscal Year 2020 and Fiscal Year 2022,” U.S. Department of Agriculture Food and Nutrition Service, October 2024, https://fns-prod.azureedge.us/sites/default/files/resource-files/ops-snap-trendsfy20-fy22-report.pdf.
[15] House Agriculture Committee, “Holding States Accountable, Incentivizing a More Efficient and Effective SNAP Program,” https://agriculture.house.gov/uploadedfiles/holding_states_accountable.pdf.
[16] Katie Bergh, Catlin Nchako, and Luis Nuñez, “Worsening SNAP’s Harsh Work Requirement Would Take Food Assistance Away From Millions of Low-Income People,” CBPP, April 30, 2025, https://www.cbpp.org/research/food-assistance/worsening-snaps-harsh-work-requirement-would-take-food-assistance-away.
[17] In rare cases, reducing the household size while counting a prorated share of the sanctioned adult’s income would mean that the household exceeds SNAP’s gross income limit or qualifies for $0 in monthly benefits. See 7 C.F.R. 273.11(c)(2) for how the eligibility and benefit level of remaining household members is determined when a household member is cut off SNAP by the three-month time limit.
[18] The bill includes a poorly structured attempt to mitigate the impact on households that include school-aged children and multiple adults subject to the time limit. These households would be at risk of an even larger reduction in their food benefits if more than one adult is cut off SNAP. The bill exempts one adult caregiver if they are married to, and reside with, an adult meeting the 20-hour work rule. But this exemption would not apply to most people at risk of being cut off SNAP by this policy, 75 percent of whom live in households that do not include any married people (based on CBPP analysis of 2022 SNAP Quality Control data). Requiring parents, grandparents, or other caregivers to be married to qualify for this exemption excludes without justification a variety of family arrangements, including single parents, unmarried partners, and multi-generational households.
[19] Katie Bergh, Catlin Nchako, and Luis Nuñez, “Worsening SNAP’s Harsh Work Requirement Would Take Food Assistance Away From Millions of Low-Income People,” CBPP, April 30, 2025, https://www.cbpp.org/research/food-assistance/worsening-snaps-harsh-work-requirement-would-take-food-assistance-away.
[20] Lauren Bauer and Chloe N. East, “A primer on SNAP work requirements,” The Hamilton Project, April 2025, https://www.hamiltonproject.org/publication/paper/a-primer-on-snap-work-requirements.
[21] Brendan Duke, “Emerging Tax and Budget Bill Flunks the Rules of Fighting Recessions,” CBPP, April 24, 2025, https://www.cbpp.org/blog/emerging-tax-and-budget-bill-flunks-basic-rules-for-fighting-recessions.
[22] “Chart Book: Tracking the Recovery From the Pandemic Recession,” CBPP, April 3, 2024, https://www.cbpp.org/research/economy/tracking-the-recovery-from-the-pandemic-recession; “Older Workers Face Unique Challenges Accessing Unemployment Insurance,” National Academy of Social Insurance, Sept. 2022, https://www.nasi.org/research/unemployment/older-workers-face-unique-challenges-accessing-unemployment-insurance.
[23] Labor Force Statistics from the Current Population Survey, Table 31: Unemployed persons by age, sex, race, Hispanic or Latino ethnicity, marital status, and duration of unemployment, 2024,” BLS, Jan. 25, 2025, https://www.bls.gov/cps/cpsaat31.htm
[24] CBPP analysis of Fiscal Year 2022 SNAP Quality Control Household Characteristics data.
[25] The Compacts of Free Association (COFA) allows citizens of Micronesia, the Marshall Islands, and Palau to live work, and study in the U.S. as lawfully present noncitizens in exchange for special access for the U.S. military.
[26] U.S. Department of Agriculture Food and Nutrition Service, “SNAP Eligibility for Non-Citizens,” updated March 18, 2025, https://www.fns.usda.gov/snap/recipient/eligibility/non-citizen.
[27] Alma Vigil and Nima Rahimi, “Trends in Supplemental Nutrition Assistance Program Participation Rates: Fiscal Year 2020 and Fiscal Year 2022,” U.S. Department of Agriculture Food and Nutrition Service, October 2024, https://fns-prod.azureedge.us/sites/default/files/resource-files/ops-snap-trendsfy20-fy22-report.pdf.
[28] Mia Monkovic and Ben Ward, “Characteristics of Supplemental Nutrition Assistance Program Households: Fiscal Year 2023,” U.S. Department of Agriculture Food and Nutrition Service, April 2025, https://fns-prod.azureedge.us/sites/default/files/resource-files/snap-FY23-Characteristics-Report.pdf.
[29] The $35 billion is an estimate of the impact of the TFP provision on SNAP benefits. We have backed out of the total CBO estimate of $36.8 billion CBPP estimates of the impact of the provision on spending in other programs (Nutrition Assistance in Puerto Rico and American Samoa, Summer EBT, and commodities for the Emergency Food Assistance Program) where funding is also tied to the TFP.
[30] Laura Wheaton and Danielle Kwon, “Effect of the Reevaluated Thrifty Food Plan and Emergency Allotments on Supplemental Nutrition Assistance Program Benefits and Poverty,” Urban Institute, August 1, 2022, https://www.urban.org/research/publication/effect-reevaluated-thrifty-food-plan-and-emergency-allotments-supplemental.