

More Than the Unemployment Rate: What Metrics to Watch for on Jobs Day
On the first Friday of each month, known as Jobs Day, the Department of Labor’s Bureau of Labor Statistics (BLS) releases the Employment Situation, which reports a wide variety of labor market indicators from the previous month. These indicators are taken from two surveys: a household survey, which provides information on labor force status, unemployment, and demographics; and a payroll survey, which provides information on employment, hours, and earnings by industry. This monthly data release provides important information about the labor market — where employers and job seekers interact to determine employment levels, wages, and working conditions — that helps convey information about the direction of the broader economy.
The primary focus of Jobs Day is the unemployment rate and the change in non-farm payroll employment, which is a measure of net gain or loss of jobs during the month. While the unemployment rate is a standard measure of how an economy is doing, the trends can be difficult to interpret. The unemployment rate is calculated as the number of people who do not have a job and are actively looking for work as a percentage of the total labor force. The labor force includes people who are employed as well as those without a job who are actively looking for work. It excludes people who are not looking for work. Therefore, an increase in the unemployment rate could be caused by either an increase in the number of people without a job looking for work or an increase in the number of people who have left the labor force altogether. People leave the labor force because they retire, they are unable to work due to health or caregiving issues, they’ve decided not to work for other reasons, or because they become discouraged about their job prospects and stop looking for work at least temporarily.
The unemployment rate is an important indicator, but it is not the only one to watch. By itself, it doesn’t paint a full picture of the labor market, and it leaves out people who have left the labor force and masks the labor market dynamics of different groups. It also provides information at a moment in time. For example, if tariffs remain high it is likely that the economy will falter and unemployment will rise, but those impacts may not be visible yet in labor market data. The tariffs were being rolled out in April and some consumers pulled forward some expenditures in an effort to purchase goods before tariffs raise prices.
The Employment Situation release provides a wealth of information on employment, earnings, and many other related data on the labor market. This includes two other measures of the health of the labor force to pay attention to:
- the labor force participation rate, which tells us the share of the working-age population (age 16 and above) employed or actively looking for work.
- the employment-population ratio, which tells us the share of the working-age population with a job.
Additionally, it’s important to focus on data showing the difference between total unemployment compared to underemployment (when a person works part time, not by choice, but because full-time work wasn’t available or is in a position that is not commensurate with their skills and ability), as well as disaggregating unemployment, labor force participation, and the employment-population ratio by race to understand how different groups are faring.
The discourse around the economy can sound abstract and obtuse but having clear measures can help us understand how federal policies impact the national economy. Following the labor market trends can signal if a recession is imminent and inform responsible policy decisions to mitigate the harm.
Why the Labor Force Participation Rate and Employment-Population Ratio Are Important to Watch
One measure to watch alongside the unemployment rate to gauge the health of the labor market is the labor force participation rate (LFPR). Defined as the civilian labor force divided by the population (technically, the civilian non-institutional population), the LFPR measures the share of the population that is working or actively looking for work. Particularly when looking at prime-age workers, those between the ages of 25 and 54, this is a good measure of labor market strength because it illustrates the extent to which people feel good about job prospects and therefore the economy broadly. LFPR has been falling steadily due to the aging of the baby boomer generation, so following prime-age LFPR can reflect changes to participation not due to population dynamics. LFPR reflects the extent to which the labor market is improving or deteriorating. The LFPR rises when the labor market is strengthening, and it falls when there is slack in the labor market, meaning many people feel discouraged about their job prospects and are neither working nor actively looking for work. When the prime age LFPR is low, it indicates the economy has potential to grow if opportunities for discouraged workers become plentiful, because there are workers available to take them.
LFPR is important because it can help to forecast economic growth trends. Mathematically, long-term economic growth is a product of the growth rates of the labor force and labor productivity. In the post-war period, the labor force grew when there was a large influx of women into the labor force; more recently, it grew when immigration was rising — a central element in the strong economy of the last couple of years and the progress that was made against inflation. Rising LFPR leads to rising GDP and income and greater tax revenues. The Congressional Budget Office (CBO) uses LFPR for their projections of the economy’s “potential output” — the maximum sustainable growth rate for the economy. Following the labor force participation rate on Jobs Day provides a glimpse of the direction economic growth is headed.
Another important measure is the employment-population ratio (EPOP), a straightforward metric that represents the share of adults who are working. Specifically, it measures the ratio of civilian employment to the adult civilian non-institutional population. EPOP measures people with jobs relative to the working-age population, while LFPR measures the labor force (which includes people without jobs who are actively looking for work) relative to the population. Unlike the number of people employed, which can rise because the population is increasing, EPOP rises when a larger share of the population has a job. EPOP tells us the proportion of the adult population that have had success in gaining jobs.
In calculating labor market metrics, BLS defines the working-age population as anyone over the age of 16 and excludes individuals in the armed forces and in other institutions (like prisons). Given that school age individuals and retirement-eligible individuals are less likely to be employed, and that the U.S. population (even with immigration) is aging, economists particularly monitor LFPR and EPOP trends among prime-age individuals, those between the ages of 25 and 54. Prime-age individuals are the core of the labor market, and this group’s participation is an important determinant of overall labor availability.

Looking at prime-age LFPR for the last 25 years shows that it was falling from 1999 through 2015 (Figure 1). Research found that the post-Great Recession fall in prime-age LFPR was due to individuals without college degrees leaving the labor market.[1] Prime-age LFPR began to rise after 2015 until the pandemic, when it fell precipitously, but then rose quickly through 2024. Women (whose labor force participation reached a historic peak in 2023) and foreign-born workers drove much of the growth in the prime-age LFPR.[2]

Prime-age EPOP has a similar trajectory, but after a steep drop in the Great Recession it began to rise several years before LFPR rose (Figure 2). While the prime age labor force participation rate was falling, indicating that people were continuing to drop out of the labor market, those who were still in the labor market were able to get jobs. So EPOP showed the labor market recovery was beginning, but the LFPR showed it was not strong enough initially to expand the number of people seeking work. In contrast, during the post-pandemic period, people were both joining the labor market and seeing success in gaining employment right from the start. In 2024, LFPR continued to rise while EPOP started to plateau. This may reflect that the labor market was starting to show evidence of cooling so that while more people were entering the labor market, they were not able to gain jobs as quickly as before.
The Unemployment Rate by Itself Doesn’t Reveal Disparities Within the Labor Market
Solely focusing on the overall unemployment rate masks underlying dynamics within demographic groups. There are six disaggregated metrics (called U-1 through U-6) that provide a fuller context on the labor market. The most widely used unemployment number, described above, is called U-3, which is the total number of unemployed people who are actively looking for work as a share of the labor force. Other measures of unemployment either limit who is considered unemployed (i.e. just people who lost their jobs and people who completed a temporary job) or add in those who are marginally attached to the labor force. BLS defines marginally attached to the labor force as those who want to work but did not actively seek a job in the previous twelve months, including discouraged workers who have stopped looking for work for more than four weeks because of the lack of job opportunities.
Counting Unemployed and Underemployed Workers Gives Fuller Sense of Labor Market Dynamics
Following these metrics from U-1 (most restrictive definition) to U-6 (most expansive definition) can provide a sense of the labor market dynamics for different types of people in various stages of the job search. U-6 includes those who are unemployed plus those defined as marginally attached to the workforce and those who are working part-time for economic reasons. This metric is important to follow because it can measure the severity of downturns by capturing the degree to which individuals either are unable to find work at all or can’t find the amount of work they want.[3] People who are not able to find full-time employment are less likely to have access to important benefits, including health care and retirement plans, that come with full-time work.
In addition to LFPR, U-6 can be an indicator of the level of slack in the labor market, the number of potential workers who have stopped actively looking for work because of the perceived lack of opportunities. The gap between the standard U-3 unemployment rate and the U-6 underemployment rate isolates those workers who want to work but have stopped looking and those who are not working as much as they’d prefer. Thus, it is a good indicator of slack in the labor market — the larger the gap, the greater the amount of labor market slack. As seen in Figure 3, the gap between U-3 and U-6 rose during the 2001 recession and stayed consistent until the Great Recession, when it spiked and stayed elevated for several years until it slowly began to narrow after 2012. The gap spiked again during the pandemic recession but immediately fell until mid-2022 when it began to slowly rise. Research has shown that increases in underemployment are generally driven by workers in the leisure and hospitality and retail trade industries, which have lower levels of stability and whose hours offered by their employers are particularly sensitive to economic fluctuations.

Racial Disparities in Labor Market Trends Show Unequal Impacts of Economic Downturns and Recoveries
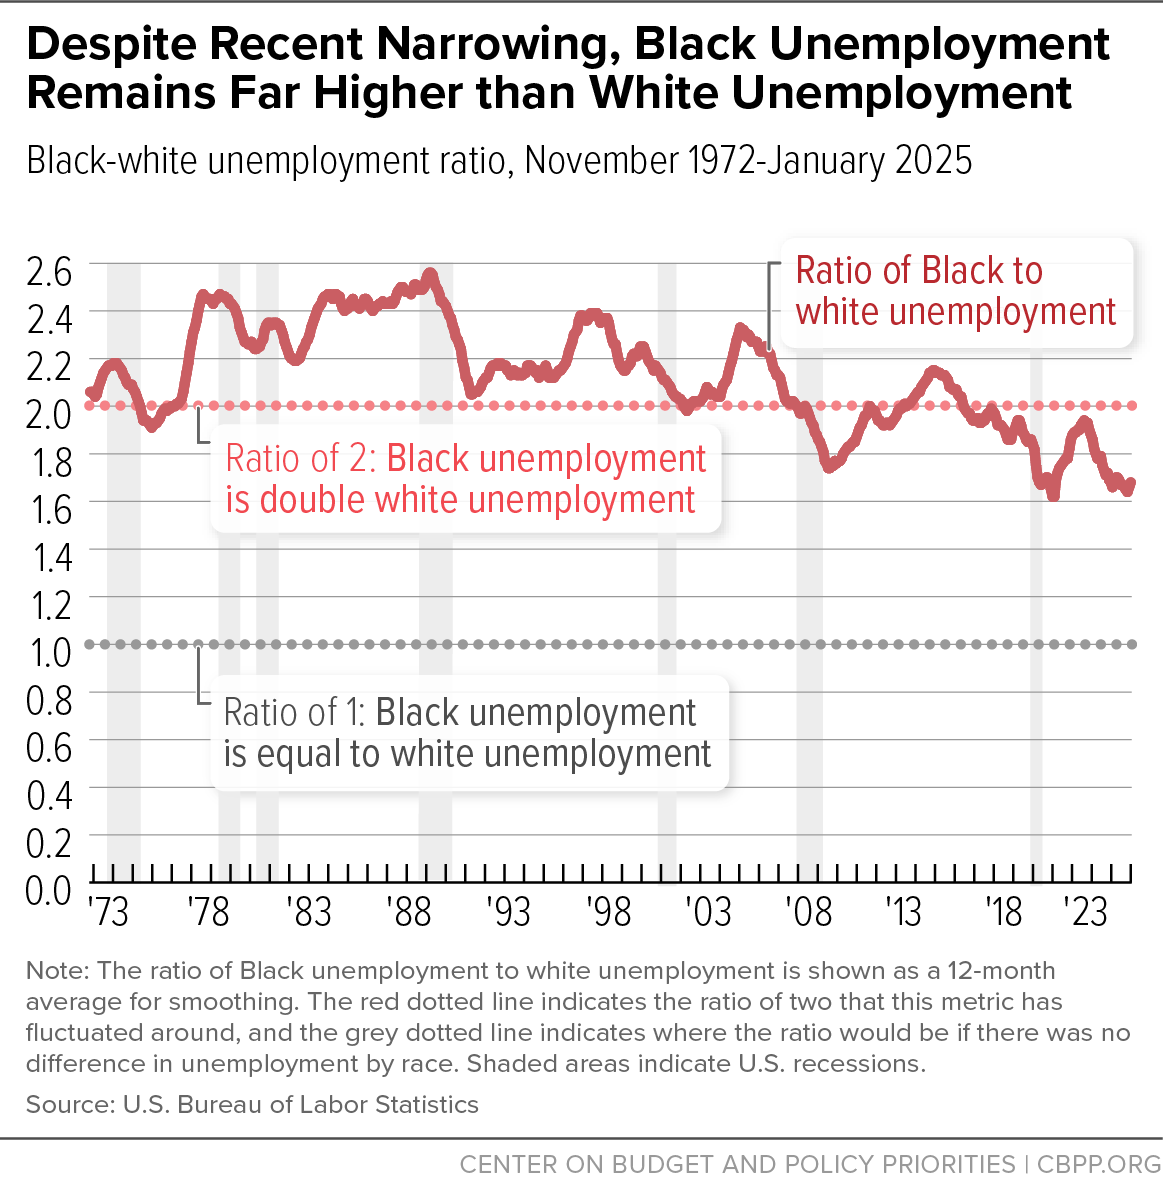
Racial disparities in the labor market are also important to follow and are evident when comparing the Black unemployment rate and the white unemployment rate.[4] Beginning in 1972, when the BLS began collecting data by race, through 2008, the Black unemployment rate was at least twice the white unemployment rate in nearly every year. Despite narrowing since then, significant differences in unemployment rates remain (Figure 4).

There is also evidence that during a business cycle, Black people are less likely to get hired until the economy is booming, while they are more likely to be fired during a downturn.[5] As Figure 4 shows, after a recession when unemployment rates for both Black and white workers are higher, the white unemployment rate falls faster than the Black unemployment rate, causing the ratio (i.e. the unemployment difference) to rise. When the recovery has strengthened and there is less slack in the labor market, the Black unemployment rate starts falling faster, so the ratio declines.
In 2010, immediately following the Great Recession, for instance, the Black unemployment rate was 16.5 percent while the white unemployment rate was 9.2 percent. In the early stages of the recovery, the white unemployment rate fell faster than the Black unemployment rate, so the ratio climbed above 2 to 1 (meaning the Black unemployment rate was more than double the white unemployment rate). Then after 2014, as the economy strengthened and the labor market tightened — a scenario when there are more jobs available and employers face challenges finding workers — the ratio fell, dropping below 2 to 1.
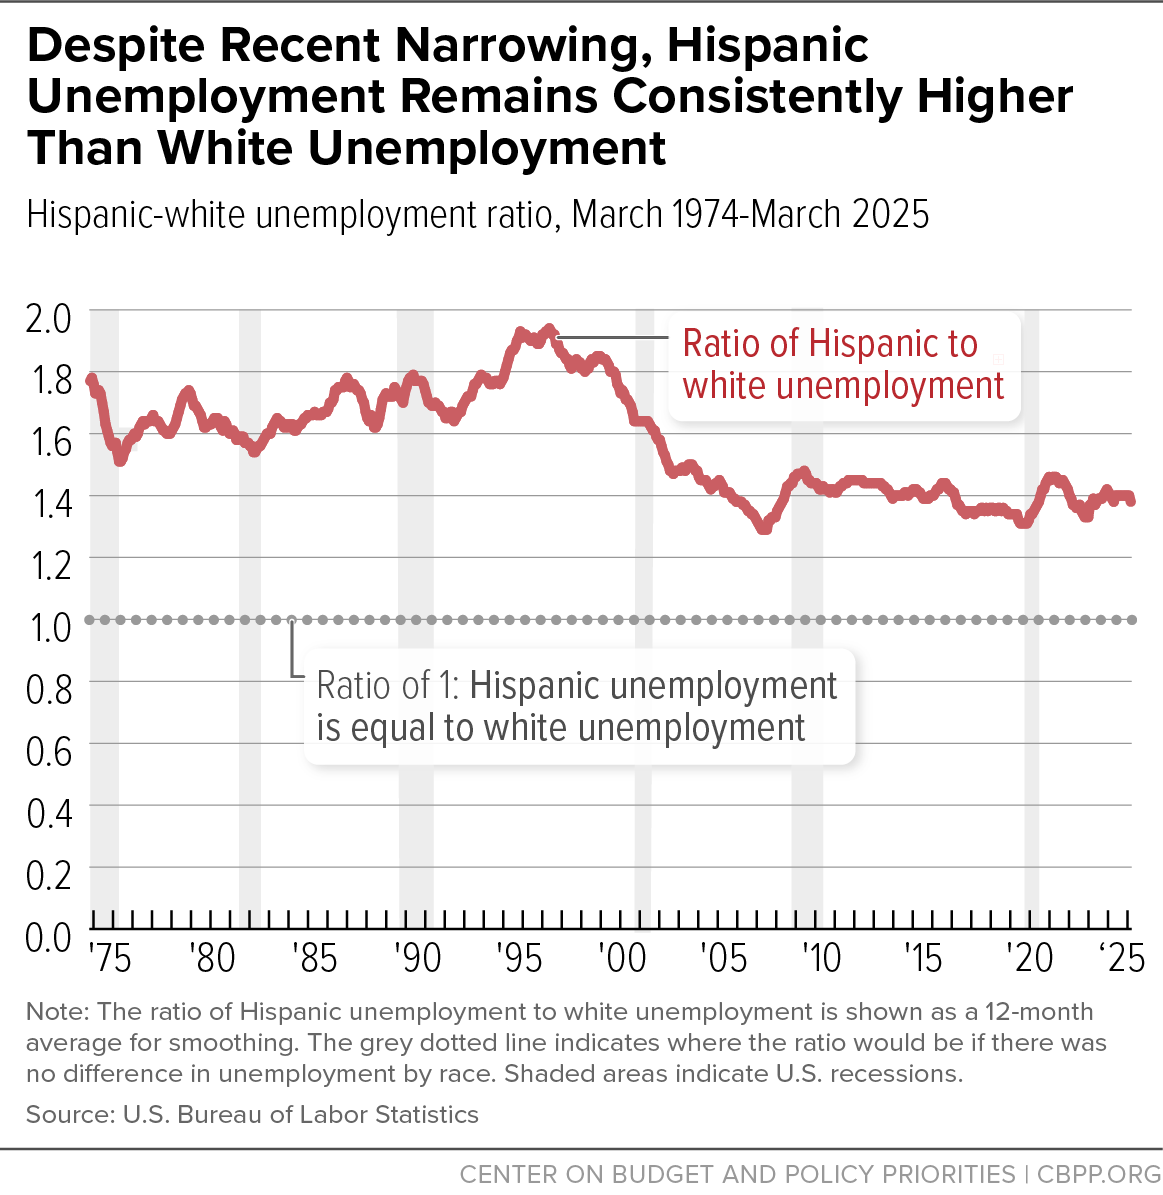
For Hispanic workers, the ratio has remained consistent at 1.4 to 1 since the end of the Great Recession through the pandemic recession (Figure 5).[6] As a general rule, members of marginalized groups are better able to find employment in tight labor markets.[7] However, it cannot fully close the difference between the unemployment rates.[8]

As these up-and-down patterns suggest, tight labor markets on their own are not sufficient to eliminate disparities both because slack eventually returns and because they don’t address the underlying reasons for the disparity.[9] A history of systemic inequality and structural racism has created outcome inequities across a variety of sectors like housing, education, and voting, and the labor market as well. Substantial research shows these disparities and finds that individual differences in skills cannot explain them.[10]
It is also instructive to look at the Black-white disparity in LFPR and EPOP. As shown in Figure 6, below, the differences were relatively stable until the Great Recession. After the recession, the difference in the LFPR — which looks at people who are employed as well as those who don’t have a job but are actively looking for one — continued to be relatively stable, while the difference in the EPOP — which looks only at people who are employed — spiked and then began to fall. The jump in EPOP is consistent with trends where the hiring rate of Black people lags that of white people in the immediate aftermath of a downturn. The EPOP difference began to narrow as labor markets improved. During this period, the Black EPOP was rising faster than the white EPOP. During the pandemic the Black-white disparity in LFPR and EPOP both rose with Black labor market outcomes experiencing a steeper drop, hitting their peak in early 2021, before falling and then stabilizing.



Jobs Day Trends and Economic Policies
At the end of 2024, the labor market was strong based on several labor market indicators. While the unemployment rate did tick up above 4 percent in the second half of 2024, it was under 4 percent between February 2022 and April 2024 — the longest since the 1960s. As the LFPR and EPOP data show, this fall in unemployment was driven by increased participation in the labor market and greater employment by those participating in the market. Even racial disparities, while persistent, were lower than they had been in previous decades.
On Jobs Day, following the trends with the labor force participation rate and employment-population ratio, along with disparities in the labor market, should inform how this economy responds to external shocks and the effects of various policies.
End Notes
[1] Didem Tüzemen and Thao Tran, “The Uneven Recovery in Prime-Age Labor Force Participation,” Federal Reserve Bank of Kansas City, October 17, 2019, https://www.kansascityfed.org/research/economic-review/3q19-tuzementhao-uneven-recovery-prime-age-labor-force-participation.
[2] Robert Valletta and Deepika Prabhakar, “Why Is Prime-Age Labor Force Participation So High?” Federal Reserve Bank of San Francisco, February 5, 2024, http://www.frbsf.org/research-and-insights/publications/economic-letter/2024/02/why-is-prime-age-labor-force-participation-so-high/.
[3] Kathryn Edwards, “Minorities, less-educated workers see staggering rates of underemployment,” Economic Policy Institute, November 4, 2009, http://epi.org/publication/minorities_less-educated_workers_see_staggering_rates_of_underemployment/.
[4] These values do not separate out ethnicity.
[5] Kenneth Couch, Robert Fairlie, and Huanan Xu, “Racial Differences in Labor Market Transitions and the Great Recession,” Social Science Research Network, February 11, 2016, https://papers.ssrn.com/sol3/papers.cfm?abstract_id=2731457.
[6] Ismael Cid-Martinez, Daniel Perez, and Stevie Marvin, “The strong labor market recovery has helped Hispanic workers, but the end of economic relief measures has worsened income and poverty disparities,” Economic Policy Institute, October 19, 2023, https://www.epi.org/blog/the-strong-labor-market-recovery-has-helped-hispanic-workers-but-the-end-of-economic-relief-measures-has-worsened-income-and-poverty-disparities/.
[7] Ben Casselman, “In a Tight Labor Market, a Disability May Not Be a Barrier,” New York Times, September 5, 2019, https://www.nytimes.com/2019/09/05/business/economy/recruiting-labor-force.html.
[8] Stephanie Aaronson, Mitchell Barnes, and Wendy Edelberg, “A hot labor market won’t eliminate racial and ethnic unemployment gaps,” The Brookings Institution, September 2, 2021, https://www.brookings.edu/articles/a-hot-labor-market-wont-eliminate-racial-and-ethnic-unemployment-gaps/
[9] Olugbenga Ajilore, “On the Persistence of the Black-White Unemployment Gap,” Center for American Progress, February 24, 2020, https://www.americanprogress.org/article/persistence-black-white-unemployment-gap/.
[10] Ajilore, op. cit.; Tomaz Cajner et al., “Racial Gaps in Labor Market Outcomes in the Last Four Decades and over the Business Cycle,” Federal Reserve Finance and Economics Discussion Series, June 2017, https://www.federalreserve.gov/econres/feds/racial-gaps-in-labor-market-outcomes-in-the-last-four-decades-and-over-the-business-cycle.htm.