States Are Still Funding Higher Education Below Pre-Recession Levels
A more recent version of this report is available here.
Most states have begun in the past year to restore some of the cuts they made to higher education funding after the recession hit. Eight states, though, are still cutting, and in almost all states — including those that are have boosted their support — higher education funding remains well below pre-recession levels. The large funding cuts have led to both steep tuition increases and spending cuts that may diminish the quality of education available to students at a time when a highly educated workforce is more crucial than ever to the nation’s economic future.
After adjusting for inflation:
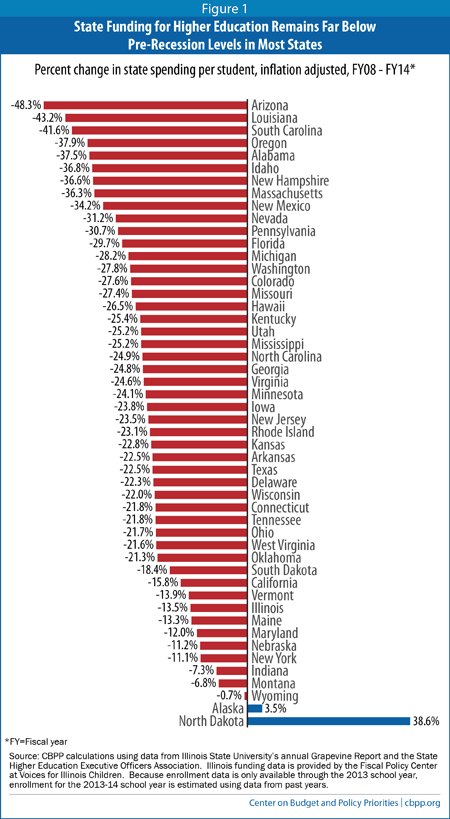
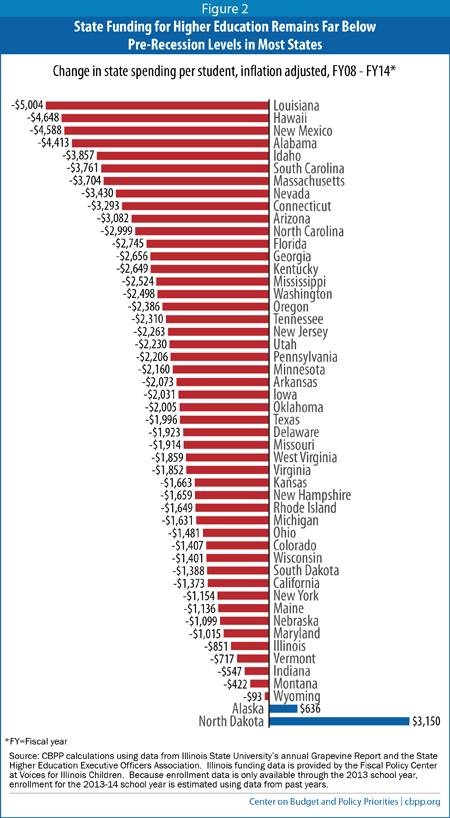
- Forty-eight states — all except Alaska and North Dakota — are spending less per student than they did before the recession.[1]
- States cut funding deeply after the recession. The average state is spending $2,026 or 23 percent less per student than before the recession.
- Per-student funding in Arizona, Louisiana, and South Carolina is down by more than 40 percent since the start of the recession (Louisiana is among the eight states that continued to cut funding over the last year).
- Wyoming, West Virginia, Louisiana, Wisconsin, and North Carolina cut funding the most over the last year. Of these, all but Wyoming have cut per student funding by more than 20 percent since the recession hit.
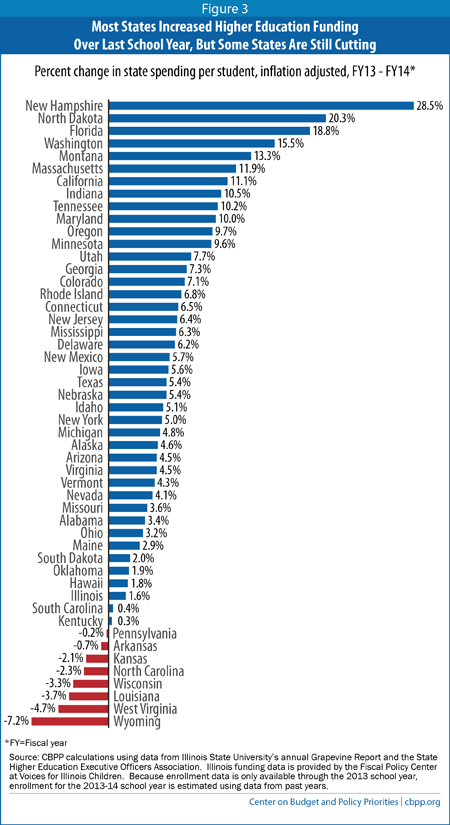
- In the last year, 42 states increased funding per student, by an average of $449 or 7.2 percent.[2]
Deep state funding cuts have major consequences for public colleges and universities. States (and to a lesser extent localities) provide 53 percent of the revenue that can be used to support instruction at these schools.[3] When this funding is cut, colleges and universities generally must either cut educational or other services, raise tuition to cover the gap, or both.
Indeed, since the recession, higher education institutions have:
- Increased tuition. Public colleges and universities across the country have increased tuition to compensate for declining state funding and rising costs. Annual published tuition at four-year public colleges has risen by $1,936, or 28 percent, since the 2007-08 school year, after adjusting for inflation.[4] In Arizona, published tuition at four-year schools is up more than 80 percent, while in two other states — Florida and Georgia — published tuition is up more than 66 percent.
- These sharp increases in tuition have accelerated longer-term trends of reducing college affordability and shifting costs from states to students. Over the last 20 years, the price of attending a four-year public college or university has grown significantly faster than the median income.[5] Federal student aid and tax credits have risen, but on average they have fallen short of covering the tuition increases.
- Cut spending, often in ways that may diminish access and quality and jeopardize outcomes. Tuition increases have compensated for only part of the revenue loss resulting from state funding cuts. Public colleges and universities have cut faculty positions, eliminated course offerings, closed campuses, shut computer labs, and reduced library services, among other cuts. For example, since 2008, the University of North Carolina at Chapel Hill has eliminated 493 positions, cut 16,000 course seats, increased class sizes, cut its centrally supported computer labs from seven to three, and eliminated two distance education centers.[6]
A large and growing share of future jobs will require college-educated workers.[7] Sufficient funding for higher education to keep tuition affordable and quality high at public colleges and universities, and to provide financial aid to those students who need it most, would help states to develop the skilled and diverse workforce they will need to compete for these jobs.
Such funding is unlikely to occur, however, unless policymakers make sound tax and budget decisions in the coming years. While some states are experiencing greater-than-anticipated revenue growth due to an economy that is slowly returning to normal, state tax revenues are barely above pre-recession levels, after adjusting for inflation.[8] To bring higher education back to pre-recession levels, many states may need to supplement that revenue growth with new revenue to fully make up for years of severe cuts.
But just as states have an opportunity to reinvest, lawmakers in many states are jeopardizing it by entertaining tax cuts their states and citizens can ill-afford. For example, Florida — where higher education funding is 30 percent below 2007 levels and tuition at four-year schools is 66 percent higher — is cutting taxes by $400 million in the current 2014 legislative session. Other states are also considering damaging changes to their tax codes that would make it very difficult to reinvest in higher education.
States Have Reversed Only a Portion of Funding Cuts, but They Must Do Much More to Make Up for Deep Cuts
State and local tax revenue is a major source of funding for public colleges and universities. Unlike private institutions, which may rely upon gifts and large endowments to help fund instruction, public two- and four-year colleges typically rely heavily on state and local appropriations. In 2013, state and local dollars constituted 53 percent of education revenue — funds used directly for teaching and instruction.[9]
While states have begun to restore funding, resources are well below what they were in 2008. Since the start of the recession, states have cut higher education funding by 23 percent per student. Even today, as state revenues return to pre-recession levels, most states continue to fund their colleges and universities at much lower levels than before the recession. Compared with the 2007-08 school year, when the recession hit, adjusted for inflation:
- State spending on higher education nationwide is down $2,026 per student, or 23 percent.
- Every state except Alaska and North Dakota has cut per-student funding.
- 37 states have cut funding per student by more than 20 percent.
- Nine states have cut funding per student by more than one-third.
- Per-student spending in Arizona, Louisiana, and South Carolina is down by more than 40 percent since the start of the recession.[10] (See Figures 1 and 2.) Louisiana continued to cut funding further over the last year.
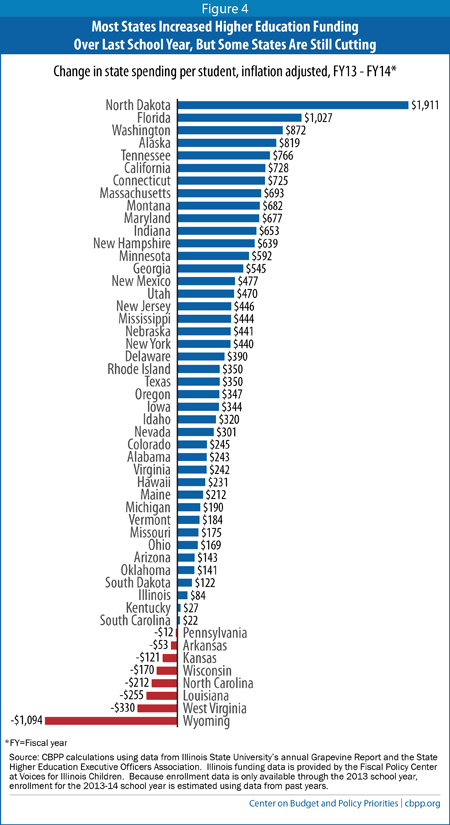
Over the past year, most states have started to increase funding for their public higher education systems after years of deep cuts. Forty-two states are investing more per student this school year than they did a year ago, adjusted for inflation. Over the past fiscal year, adjusted for inflation:
- Spending is up $449 per student, or 7.2 percent, on average, among states that have increased higher education funding.
- The funding increases vary from $22 per student in South Carolina to $1,911 in North Dakota.
- Twenty-six states increased funding by more than 5 percent per student.
- Ten states ? New Hampshire, North Dakota, Florida, Washington, Montana, Massachusetts, California, Indiana, Tennessee, Maryland ? increased funding by more than 10 percent.
- Eight states reduced higher education funding per pupil, with the deepest cuts coming in Wyoming, West Virginia, Louisiana, Wisconsin, and North Carolina. (See Figures 3 and 4.)
Why Did States Cut Higher Education Funding After the Recession?
The cuts resulted from state and federal responses to the deep recession and a slow recovery.
- State tax revenues fell very sharply and are only now returning to pre-recession levels. The recession of 2007-09 hit state revenues hard, and the slow recovery continues to affect them. High unemployment and a slow recovery in housing values left people with less income and less purchasing power. As a result, states took in less income and sales tax revenue, the main sources of revenue that they use to fund education and other services. By the fourth quarter of 2013, state tax revenues are only 0.4 percent greater than they were in 2008 after adjusting for inflation.[11]
- Limited revenues must support more students. Public higher education institutions must educate more students, raising costs. In part due to the “baby boom echo” causing a surge in the 18- to 24-year-old population, enrollment in public higher education increased by about 1 million full-time equivalent students, or 10 percent, between the beginning of the recession and the 2012-13 academic year (the latest year for which there is actual data).[12]
The recession also played a large role in swelling enrollment numbers, particularly at community colleges, reflecting high school graduates choosing college over dim employment prospects in the job market and older workers entering classrooms in order to retool and gain new skills.[13]
Other areas of state budgets also are under pressure. For example, about 492,000 more K-12 students are enrolled in the current school year than in 2008.[14] Long-term growth in state prison populations — with state facilities now housing more than 1.35 million inmates — also continues to put pressure on state spending.[15] - Many states chose not to reduce the size of spending cuts by enacting significant new revenues. Rather than choosing a balanced mix of spending cuts and targeted revenue increases, states relied disproportionately on damaging cuts to close the very large budget shortfalls they faced over the course of the recession. Between fiscal years 2008 and 2012, states closed 45 percent of their budget gaps through spending cuts and only 16 percent of their budget gaps through taxes and fees (they closed the remainder of their shortfalls with federal aid, reserves, and various other measures). States could have lessened the need for deep cuts to higher education funding if they had been more willing to raise additional revenue.
State Cuts Have Driven Up Tuition
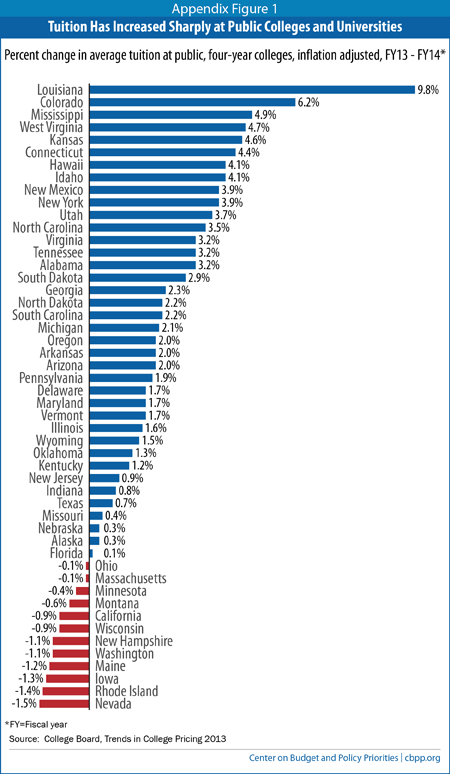
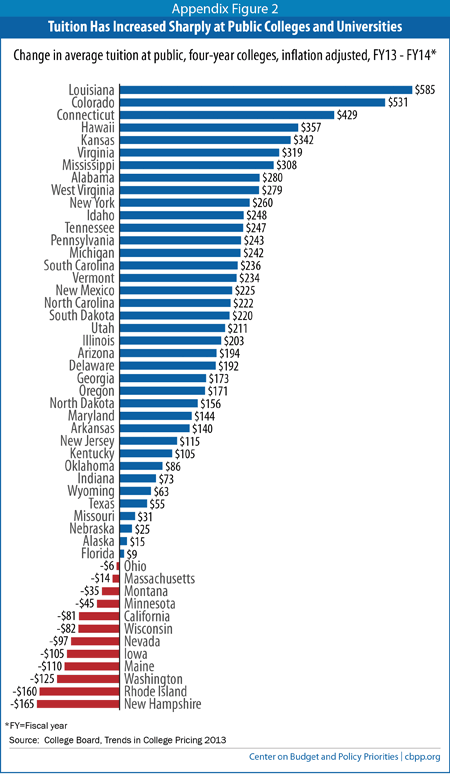
Over the past year, as states have started to restore funding for public higher education, tuition hikes have been much smaller than in recent years. Published tuition — the “sticker price” — at public four-year institutions rose in 38 states in the 2013-14 school year, but the average across all states was a modest $120 or 1.4 percent after inflation.[16]
- Just seven states — Louisiana, Colorado, Connecticut, Hawaii, Kansas, Virginia, and Mississippi — raised tuition by more than $300 after inflation.
- In 12 states, tuition actually fell slightly, adjusted for inflation, with declines ranging from $6 in Ohio to $165 in New Hampshire.[17]
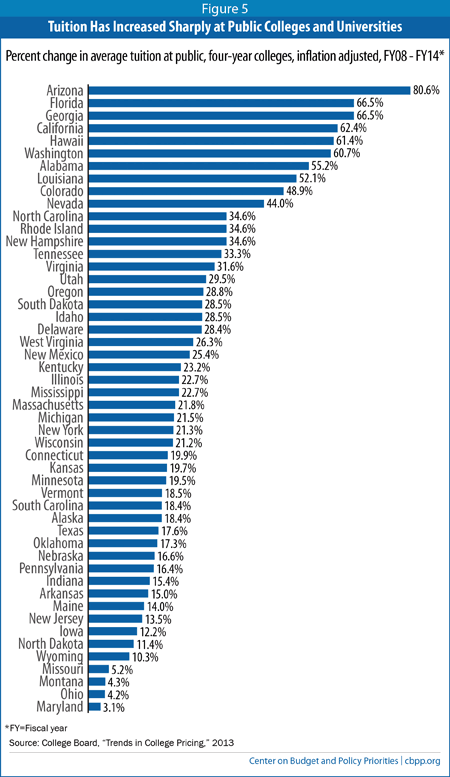
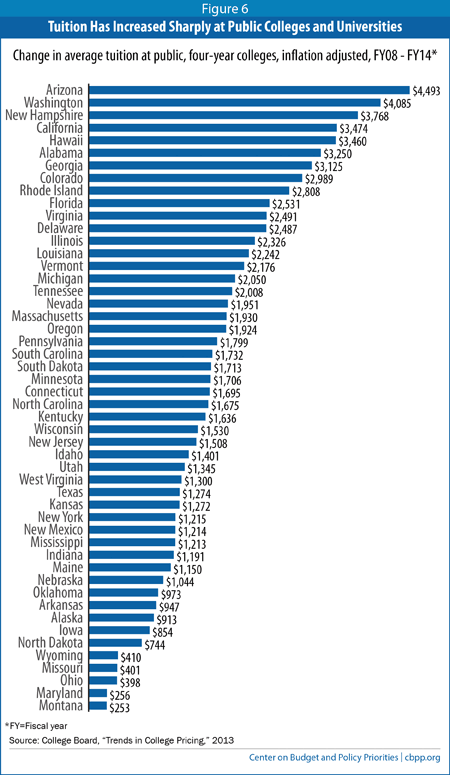
Still, since the 2007-08 school year, average annual published tuition has risen by $1,936 nationally, or 28 percent, above the rate of inflation (in non-inflation-adjusted terms, average tuition is up $2,702). Steep tuition increases have been widespread, and average tuition at public four-year institutions, adjusted for inflation, has increased by:
- More than 60 percent in six states;
- More than 40 percent in ten states; and
- More than 20 percent in 29 states. (See Figures 5 and 6.)
- In Arizona, the state with the greatest tuition increases since the recession, tuition has risen 80.6 percent or $4,493 per student after inflation.[18]
Public Colleges and Universities Also Have Cut Staff and Eliminated Programs
Recent tuition increases, while substantial in most states, have fallen far short of fully replacing the funding that public colleges and universities have lost due to state funding cuts.
Between 2009 and 2010 (the latest year for which data is available), tuition increases offset:
- Just over 60 percent of cuts to funding that state and local governments provided to public colleges that offer graduate degrees;
- About 30 percent of the cuts to funding that state and local governments provided to public colleges that offer bachelor’s degrees but not graduate degrees; and
- Only 14 percent of the cuts to funding that state and local governments provided to community colleges.[19]
Because tuition increases have not fully compensated for the loss of state funding, and because most public schools do not have significant endowments or other sources of funding, public colleges and universities have simultaneously cut spending to make up for declining state funding.
Data on spending at public institutions of higher learning in recent years are incomplete, but considerable evidence suggests that many public colleges and universities have constrained spending to make up for lost state funding, often in ways that reduce the quality and availability of their academic offerings. For example, since the start of the recession, in response to state budget cuts:
- The Pennsylvania State System of Higher Education has reduced the permanent workforce by 540 employees and frozen or discontinued new enrollment in 198 programs. Another 45 faculty positions may be furloughed this year.[20]
- Arizona’s university system has cut more than 2,100 positions; consolidated or eliminated 182 colleges, schools, programs, and departments; and closed eight extension campuses (local campuses that facilitate distance learning).[21]
- The University of North Carolina at Chapel Hill has eliminated 493 positions, cut 16,000 course seats, increased class sizes, cut its centrally supported computer labs from seven to three, and eliminated two distance education centers. [22]
- The University of Florida cut 261 positions for full-time tenure and tenure-track faculty while adding 234 part-time and non-tenure track positions, mirroring a national trend toward using adjunct instead of tenured professors.[23]
- The Louisiana State University has eliminated 1,210 full-time equivalent positions, including a net loss of 220 faculty members.[24]
- Between 2009 and 2013, Colorado State University-Fort Collins cut more than 355 faculty and staff positions.[25]
More recently, even as states have begun to reinvest in higher education, public colleges and universities continue to deal with financial strain from years of budget cuts and enrollment declines. For example:
- In Ohio, the University of Akron will lay off 18 employees due to another budget shortfall. Combined with the budget reductions approved in the summer of 2013, the university will have eliminated an estimated 150 positions.[26]
- To reduce administrative costs, the University System of Georgia merged Southern Polytechnic State University with Kennesaw State University. This marks the fifth consolidation within the system since 2012.[27]
- In the 2014 academic year, funding cuts led North Carolina State University to eliminate 187 full-time equivalent positions while the NCST Library system will need to eliminate 27 positions and a reduction in an online media service.[28]
- The College of Central Florida will eliminate 28 positions for the 2014 school year, which will require closing two certificate programs and one associate’s degree program.[29]
Nationwide, employment at public colleges and universities has grown modestly since the start of the recession, but less than the growth in the number of students. Between the 2007-08 and the 2012-13 school years, the number of full-time equivalent instructional staff at public colleges and universities grew by about 7 percent, while the number of students at these institutions grew by 10 percent. In other words, the number of faculty per student declined nationwide. In three states — California, Nevada, and New Hampshire — full-time equivalent instructional staff at public colleges and universities fell between the 2007-08 and the 2012-13 school years, even as enrollment grew.[30]
Funding Cuts and Tuition Increases Have Shifted Costs From States to Students
During and immediately following recessions, state and local funding for higher education has tended to plummet, while tuition has tended to spike. During periods of economic growth, funding has tended to largely recover while tuition stabilizes at a higher level as share of total higher educational funding.[31] (See Figure 7.)
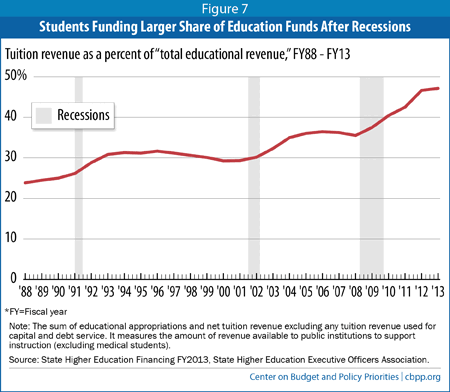
This trend has meant that over time students have assumed much greater responsibility for paying for public higher education. In 1988, public colleges and universities received 3.2 times as much in revenue from state and local governments as they did from students. They now receive about 1.1 times as much from states and localities as from students.
Nearly every state has shifted costs to students over the last 25 years — with the most drastic shift occurring since the onset of the recession. In 1988, average tuition amounts were larger than per-student state expenditures in only two states, New Hampshire and Vermont. By 2008, that number had grown to ten states. Today, tuition revenue now outweighs government funding for higher education in 23 states with six states — New Hampshire, Vermont, Delaware, Colorado, Rhode Island, Michigan, and Pennsylvania — asking students and families to shoulder higher education costs by a ratio of at least 2-to-1.[32]
With Incomes Stagnant or Declining, Families Have Been Hard-Pressed to Absorb Rising Tuition Costs
The cost shift from states to students has happened over a period when absorbing additional expenses has been difficult for many families because their incomes have been stagnant or declining. In the 1970s and 1980s, tuition and incomes both grew modestly faster than inflation, but in about 1990, tuition began to rise much faster than incomes. (See Figure 8.)
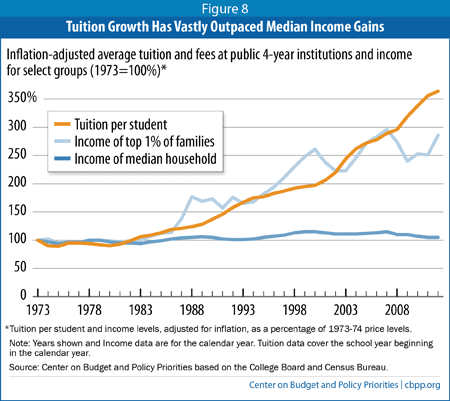
- Since 1973, average inflation-adjusted public college tuition has more than tripled, but median household income has barely changed, up merely 5 percent.
- There is one group for whom income growth has held up reasonably against public college tuition: the highest-income 1 percent of families. Over the past 40 years, the incomes of the top 1 percent of families have climbed 186 percent.
- The sharp tuition increases states have imposed since the recession have exacerbated the longer-term trend. Tuition was up 26.1 percent between the 2007-08 and 2012-13 school years, while real median income was down roughly 8.3 percent over the same time period.
Cost Shift Harms Students and Families, Especially Those With Low Incomes
Rapidly rising tuition at a time of weak or declining income growth has a number of damaging consequences for families, students, and the national economy.
- Students are taking on more debt. Student debt levels have swelled since the start of the recession. Collectively, across all institutional sectors, students held $1.08 trillion in student debt — eclipsing both car loans and credit card debt — by the fourth quarter of 2013.[33] Between the 2007-08 and the 2011-12 school years, the median amount of debt incurred by the average bachelor’s degree recipient with loans at a public four-year institution grew from $11,900 to $14,300 (in 2012 dollars), an inflation-adjusted increase of $2,400, or 20 percent. The average level of debt incurred had grown from $11,200 to $11,900, an increase of about 6.3 percent, over the previous eight years.[34]
- Tuition costs are deterring some students from enrolling in college. While the recession encouraged many students to enroll in higher education, the large tuition increases of the past few years may have prevented further enrollment gains. Rapidly rising tuition makes it less likely that students will attend college. Research has consistently found that college price increases result in declining enrollment.[35] While many universities and the federal government provide financial aid to help students bear the price, research suggests that both the advertised tuition cost and the actual price net of aid affect whether students go to college; in other words, a high sticker price can dissuade students from enrolling even if the net price doesn’t rise.
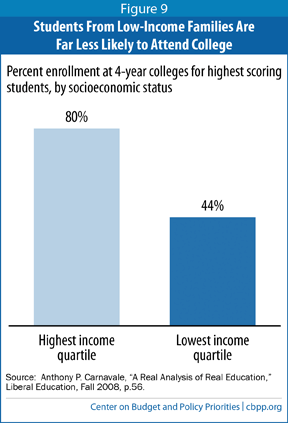
- Tuition increases are likely deterring low-income students, in particular, from enrolling. Research further suggests that college cost increases have the biggest impact on students from low-income families. For example, a 1995 study by Harvard University researcher Thomas Kane concluded that states that had the largest tuition increases during the 1980’s and early 1990’s “saw the greatest widening of the gaps in enrollment between high- and low-income youth.”[36]Gaps in college enrollment among higher- and lower-income youth are already pronounced, even among prospective students of similar ability levels. In a 2008 piece, Georgetown University scholar Anthony Carnavale pointed out that “among the most highly qualified students (the top testing 25 percent), the kids from the top socioeconomic group go to four-year colleges at almost twice the rate of equally qualified kids from the bottom socioeconomic quartile.”[37] (See Figure 9.) Rapidly rising costs at public colleges and universities may widen these gaps further.Image
- Tuition increases may be pushing lower-income students toward less-selective institutions, reducing their future earnings. Perhaps just as important as a student’s decision to enroll in higher education is the choice of which college to attend. Even here, research indicates financial constraints and concerns about cost push lower-income students to narrow their list of potential schools and ultimately enroll in less-selective institutions.[38] In a 2013 study, economists Eleanor Dillon and Jeffrey Smith found evidence that some high-achieving low-income students are more likely to “undermatch” in their college choice in part due to financial constraints.[39]
Where a student decides to go to college has broad economic implications, especially for disadvantaged students and students of color. A 2011 study conducted by researchers from Stanford University and Mathematica Policy Research found students who had parents with less education, as well as African-American and Latino students, experienced higher postgraduate earnings by attending more elite colleges relative to similar students who attended less-selective universities.[40]
Increases in Federal Financial Aid Since the Recession Have Offset Some Costs to Students and Families, but State Aid Has Declined
While tuition has soared since the recession, federal financial aid also has increased. Between the 2007-08 and 2012-13 school years, Pell Grants — the nation’s primary student grant aid program — doubled from $16 billion to nearly $33 billion. This substantial funding boost allowed the program not only to reach a greater number of students, but also to provide the average recipient with more funding. The average grant rose by 24 percent — to $3,704 from $2,975, after adjusting for inflation.[41]
The increase in federal financial aid has helped many students and families pay for recent tuition hikes. The College Board calculates that the annual value of grant aid and higher education tax benefits for students at four-year public colleges nationally has increased by an average of $1,411 in real terms since the 2007-08 school year, offsetting over 73 percent of the $1,936 tuition increase paid by the average student nationwide. For community colleges, increases in student aid have more than made up the difference, leading to a decline in the net tuition cost for the average student.[42]
Since the sticker-price increases have varied so much across the states while federal grant and tax-credit amounts are uniform across the country, students in states with large tuition increases — such as Arizona, New Hampshire, or Washington — likely experienced substantial increases in their net tuition and fees, while students in states with smaller tuition increases may have realized net cost reductions.
While the increase in federal financial aid has played a critical role in partially offsetting state cuts to higher education, this funding is threatened. The 2015 budget passed by the U.S. House of Representatives in early April would reduce Pell Grant funding by up to $125 billion over the next ten years, freezing the maximum grant amount and restricting program eligibility.[43]
In contrast to federal dollars, financial aid provided by states, which was much smaller than federal aid even before the recession, has declined on average since then. In the 2007-2008 school year, state grant dollars equaled $729 per student. By 2012 — the latest year for which full data are available — that number had fallen to $680, a decline of roughly 7 percent.[44]
Low-Income Students Still Face High Levels of Debt Due to Rising Costs of Room and Board and Other Living Expenses
While rising federal financial aid has reduced the impact of tuition and fee increases on low-income students, the overall cost of attending college has risen for these students because the costs of room and board have increased, too. As a result, the net cost of attendance at four-year public institutions for low-income students increased 12 percent from 2008 to 2012, after adjusting for inflation. For low-income students attending public community colleges, the increase over the same time period was 4 percent.[45]
Because grants and tax credits rarely cover the full cost of college attendance, most students — low-income students in particular — borrow money. In 2008, roughly 70 percent of low-income students graduating from a public four-year college or university had student loans (compared with 40 percent of graduating students from wealthy families).[46] Rising costs mean that low-income students are likely borrowing more. In 2008, the median debt level for a low-income student graduating from a public four-year university was just under $17,600. By 2012, that number had increased 17 percent to nearly $20,700.[47]
Funding Cuts Jeopardize Both Students’ and States’ Economic Futures
The reduced college access and graduation rates that research suggests are likely to result from budget cuts affect more than just the students, because college attainment has grown increasingly important to long-term economic outcomes for states and the nation.
Getting a college degree is increasingly a pre-requisite for professional success and for entry into the middle class or beyond. A young college graduate earns $12,000 a year more annually than someone who did not attend college.[48]
The benefits of academic attainment extend beyond those who receive a degree; research suggests that the whole community benefits when more residents have college degrees. Areas with highly educated residents tend to attract strong employers who pay their employees competitive wages. Those employees, in turn, buy goods and services from others in the community, broadly benefitting the area’s economy. Economist Enrico Moretti of the University of California at Berkeley finds that as a result, the wages of workers at all levels of education are higher in metropolitan areas with high concentrations of college-educated residents.[49] This finding implies that — even though not all good jobs require a college degree — having a highly educated workforce can boost an area’s economic success.
The economic importance of higher education will continue to grow into the future. The Georgetown Center on Education and the Workforce projects that by 2020, 65 percent of all jobs will require at least some college education. That is up from 59 percent in 2007, 56 percent in 1992, and 28 percent in 1973.[50]
The Georgetown Center further projects that, based on current trends — without significant new investment in capacity — the nation’s education system will not be able to keep pace with the rising demand for educated workers. By 2020, the county’s system of higher education will produce 5 million fewer college graduates than the labor market will demand, Georgetown projects.[51]
The increase in student debt in recent years also has important implications for the broader economy. While debt is a crucial tool for financing higher education, excessive debt can impose considerable costs on both students and society as a whole. Research finds that higher student debt levels are associated with lower rates of homeownership among young adults; can create stresses that reduce the probability of graduation, particularly for students from lower-income families; and reduce the likelihood that graduates with majors in science, technology, engineering, and mathematics will go on to graduate school.[52]
This research suggests that states should strive to expand college access and increase college graduation rates to help build a strong middle class and develop the skilled workforce needed to compete in today’s global economy. It suggests further that the severe higher education funding cuts that states have made since the start of the recession will make it more difficult to achieve those goals.
States’ Budget Choices Will Determine Whether They Can Successfully Rebuild Their Higher Education Systems
State revenues are starting to improve, albeit slowly. Under current trends, it will be many years before states can resume funding services fully at pre-recession levels, or greater. It is imperative, however, that states begin to reinvest today.
State lawmakers face the simultaneous challenge of adequately funding higher education while supporting other important state priorities. Elementary and secondary education, like higher education, has been cut in most states in recent years.[53] Health care services require states’ continued support, given rising health costs. The nation’s system of roads and bridges is deteriorating and in need of new public investments, and states have limited ability to cut back on public safety or human services without risking real harm to communities. Those areas of spending account for more than 80 percent of state and local government funding; the rest of state budgets pay for environmental protection, the court system, and other important areas that also are hard to cut without significant negative consequences.
This means that to make significant progress in renewing state investment in higher education, and to prevent investment from sliding even further, states would need to reject calls for tax cuts and instead consider options for new revenues. These revenues could come from repealing ineffective tax deductions, exemptions, and credits; rolling back past years’ tax cuts; or raising certain tax rates.[54] In May 2013, Minnesota state lawmakers voted to create a new income tax bracket for the state’s richest households, repeal certain tax breaks for companies operating outside the United States, and raise revenues through changes to estate and gift taxes. The additional revenue helped prevent hundreds of millions of dollars in budget cuts and allowed the state to put sizeable resources toward investments in higher education, including enabling the state to freeze tuition for its public colleges and universities, among other educational investments.[55]
States may also wish to consider more funding for higher education as an alternative to new tax cuts. This may be particularly true in a number of states that have made deep cuts to higher education funding and where policymakers are proposing deep new tax cuts that would lock in — even add to — those higher education cuts.
Florida lawmakers, for example, have cut taxes by nearly $400 million in the current 2014 legislative session with another $100 million in cuts still under consideration. These cuts come at a time when Florida’s higher education funding stands 30 percent below pre-recession levels, and tuition at its public four-year colleges has increased by 66 percent over the last five years. Other states that have made deep cuts to higher education funding and yet are considering or have made sizeable tax cuts this year include Arizona, Kansas, Michigan, Missouri, New York, North Carolina, Ohio, Oklahoma, and Wisconsin.
Tax cuts are often sold as a recipe for economic growth. But to the extent that tax cuts prevent investments in higher education that would increase access to college, improve graduation rates, and reduce student debt, their net effect could be a drag on the economy.
In many cases, economic growth alone will not be sufficient to propel higher education funding to previous levels any time soon. To rebuild their states’ higher education systems, policymakers will need to raise additional revenue and, at the very least, to avoid shortsighted tax cuts that stifle higher education investments, making it harder to develop the skilled workforce that states will need to compete in the future.
Conclusion
States have cut higher education funding deeply since the start of the recession. These cuts were in part the result of a revenue collapse caused by the economic downturn, but they also resulted from misguided policy choices. State policymakers relied overwhelmingly on spending cuts to make up for lost revenues. They could have lessened the need for higher education funding cuts if they had used a more balanced mix of spending cuts and revenue increases to balance their budgets.
To compensate for lost state funding, public colleges have both steeply increased tuition and pared back spending, often in ways that may compromise the quality of the education and jeopardize student outcomes. Now is the time to renew investment in higher education to promote college affordability and quality.
Strengthening state investment in higher education will require state policymakers to make the right tax and budget choices over the coming years. A slow economic recovery and the need to reinvest in other services that also have been cut deeply means that many states will need to raise revenue to rebuild their higher education systems. At the very least, states must avoid shortsighted tax cuts, which would make it much harder for them to invest in higher education, strengthen the skills of their workforce, and compete for the jobs of the future.
Appendix:
Tuition Increases Fiscal Years 2013-2014
| Appendix Table Change in State Higher Education Appropriations, Enrollment, and Appropriations Per-Student, 2007-08 School Year to 2012-13 School Year |
||||
| 2007 - 2008 | 2012 - 2013 | Change | Percent Change | |
| State Appropriations for Higher Education | $89,822,364,537 | $74,146,488,552 | ($15,675,875,985) | -17.5% |
| Full-time Equivalent Enrollment at Public Colleges and Universities | 10,254,148 | 11,011,046 | 756,898 | 7.4% |
| State Appropriations Per Full-Time Enrolled Student | $8,760 | $6,734 | ($2,026) | -23.1% |
| Sources: Education appropriations data comes from the Grapevine survey conducted by Illinois State University, enrollment data comes from the State Higher Education Executive Officers’ Association. Since enrollment data is only available through the 2012-2013 school years, enrollment data for 2013-14 is an estimate based on data from past years. Dollar figures adjusted for inflation using the consumer price index. | ||||
End Notes
[1] CBPP calculation using the “Grapevine” higher education appropriations data from Illinois State University, enrollment data from the State Higher Education Executive Officers’ Association, and the Consumer Price Index, published by the Bureau of Labor Statistics. Since enrollment data are available only through the 2012-13 school year, enrollment for the 2013-14 school year is estimated using data from past years.
[2] CBPP calculations, unweighted average across states that have increased per-student funding.
[3] State Higher Education Executive Officers’ Association, “State Higher Education Finance: FY2013,” 2014, p. 20, http://www.sheeo.org/sites/default/files/publications/SHEF_FY13_04172014.pdf.
[4] Calculated from College Board, “Trends in College Pricing,” table 2, http://trends.collegeboard.org/college-pricing.
[5] Calculated from “Trends in College Pricing 2013: Tuition and Fee and Room and Board Charges over Time,” Table 2 https://trends.collegeboard.org/college-pricing/figures-tables/tuition-and-fee-and-room-and-board-charges-over-time, and the Census Bureau’s Income, Poverty and Health Insurance in the United States, September 2013, Table A-1, http://www.census.gov/prod/2012pubs/p60-243.pdf.
[6] University of North Carolina at Chapel Hill, “Impact of Budget Reductions,” September 2011, http://execbranch.web.unc.edu/files/2011/09/2011-12-UNC-CH-Budget-Reduction-Impacts.pdf.
[7] See Anthony P. Carnevale, Nicole Smith, and Jeff Strohl, “Recovery: Job Growth and Education Requirements through 2020,” Georgetown University Center on Education and the Workforce, June 2013, https://georgetown.app.box.com/s/tll0zkxt0puz45hu21g6.
[8] Michael Leachman, “Caution is the Right Approach to State ‘Surpluses’” January 2014, http://www.offthechartsblog.org/caution-is-the-right-approach-to-state-surpluses/ & CBPP analysis of Census quarterly state and local tax revenue, http://www.census.gov/govs/qtax/.
[9] State Higher Education Executive Officers’ Association, “State Higher Education Finance: FY2013 2014,” http://www.sheeo.org/sites/default/files/publications/SHEF_FY13_04172014.pdf.
[10] CBPP calculation using the “Grapevine” higher education appropriations data from Illinois State University, enrollment and combined state and local funding data from the State Higher Education Executive Officers Association, and the Consumer Price Index, published by the Bureau of Labor Statistics. Since enrollment data is only available through the 2012-13 school year, enrollment for the 2013-14 school year is estimated using data from past years.
[11]CBPP analysis of Census quarterly state and local tax revenue, http://www.census.gov/govs/qtax/.
[12] State Higher Education Executive Officers’ Association, “State Higher Education Finance: FY2013,” 2014, http://www.sheeo.org/sites/default/files/publications/SHEF_FY13_04172014.pdf; Note, while full-time equivalent enrollment at public two- and four-year institutions is up by over 1 million since FY 2008, between FY 2012 and 2013 it fell by approximately 280,000 enrollees — a 2.4 percent decline.
[13] See, for example, “National Postsecondary Enrollment Trends: Before, During and After the Great Recession,” National Student Clearinghouse Research Center, page 6 , July 2011, http://pas.indiana.edu/pdf/National%20Postsecondary%20Enrollment%20Trends.pdf ; a survey conducted by the American Association of Community College indicated that increases in Fall 2009 enrollment at community colleges was, in part, due to workforce training opportunities; see Christopher M. Mullin, “Community College Enrollment Surge: An Analysis of Estimated Fall 2009 Headcount Enrollments at Community Colleges,” AACC, December 2009, http://files.eric.ed.gov/fulltext/ED511056.pdf.
[14] National Center for Education Statistics, Projections of Education Statistics to 2022, Table 6.
[15] National Association of State Budget Officers, “State Spending for Corrections: Long-Term Trends and Recent Criminal Justice Policy Reforms,” September 2013, https://www.nasbo.org/sites/default/files/pdf/State%20Spending%20for%20Corrections.pdf.
[16] This paper uses CPI-U-RS inflation adjustments to measure real changes in costs. Over the past year CPI-U-RS increased by 1.47 percent. We use the CPI-U-RS for the calendar year that begins the fiscal/academic year.
[17] CBPP calculation using College Board “Trends in College Pricing,” 2013, http://trends.collegeboard.org/college-pricing. See appendix for FY13-FY14 change in average tuition at public, four-year colleges.
[18] Ibid.
[19] American Institutes for Research, Delta Cost Project, “Spending, Subsidies, and Tuition: Why Are Prices Going Up? What Are Tuitions Paying For?” September, 2012, p. 5.
[20] Ry Rivard, “Wither Pennsylvania,” Insider Higher Ed, December 2, 2013, http://www.insidehighered.com/news/2013/12/02/pennsylvanias-14-university-system-feeling-pain-budget-cuts-and-demographic-shifts.
[21] Arizona Board of Regents Media Release, “ABOR Responds to Governor’s FY12 Budget Recommendations,” January 14, 2011, http://azregents.asu.edu/legislativeaffairs/newsreleases/ABOR%20Responds%20to%20Governor%27s%20FY12%20Budget%20Recommendations.pdf.
[22] University of North Carolina at Chapel Hill, “Impact of Budget Reductions,” September 2011, http://execbranch.web.unc.edu/files/2011/09/2011-12-UNC-CH-Budget-Reduction-Impacts.pdf.
[23] Jeff Schweers, “UF Responded to Budget Cets by Reducing Tenured Positions,” The Gainesville Sun, June 28, 2013, http://www.gainesville.com/article/20130628/ARTICLES/130629615?p=1&tc=pg.
[24] William L. Jenkins, Presentation to the Joint Legislative Committee on the Budget, November 9, 2012, https://www.lsusystem.edu/docs/budget/JLCB%20Presentation%2011092012/LSU%20System%20Presentation%20to%20JLCB_11-9-12.pdf. See also, Melinda Deslatte, “LSU Employees to Get First Pay Raises in Over Four Years” Diverse, July 28, 2013, http://diverseeducation.com/article/54887/.
[25] Jeff Tucker, “Fort Collins Campus has Suffered Cutbacks,” The Pueblo Chieftain, January 17, 2014, http://www.chieftain.com/news/region/2196652-120/csu-pueblo-budget-million.
[26] Encarnacion Pyle, “Public College Enrollment Dip Leads to Cutbacks,” The Columbus Dispatch, October 27, 2013, http://www.dispatch.com/content/stories/local/2013/10/27/enrollment-dip-leads-to-cutbacks.html.
[27] Ry Rivard, “Merging Into Controversy,” Inside Higher Ed, November 6, 2013, http://www.insidehighered.com/news/2013/11/06/secret-merger-now-public-meets-opposition-georgia#ixzz2xZK8RYOt.
[28] NC State University, “Cut Create Challenges,” October 30, 2013, http://bulletin.ncsu.edu/2013/10/cuts-create-challenges/ see also; Jake Moser, “Devastating Cuts,” Technician Online, January 14, 2014, http://www.technicianonline.com/news/article_540c7000-7cdc-11e3-b55a-0019bb30f31a.html.
[29] Joe Callahan, “CF Eliminates 28 Positions,” Ocala StarBanner, May 30, 2013, http://www.ocala.com/article/20130530/ARTICLES/130539977/1005/sports01?p=2&tc=pg.
[30] CBPP analysis of employment data from the National Center for Education Statistics and enrollment data from the State Higher Education Executive Officers Association.
[31] State Higher Education Executive Officers’ Association, “State Higher Education Finance: FY2013,” 2014, Figure 4 p. 22, http://www.sheeo.org/sites/default/files/publications/SHEF_FY13_04252014.pdf.
[32] State Higher Education Executive Officers’ Association, “State Higher Education Finance: FY2013,” 2014, http://www.sheeo.org/sites/default/files/publications/SHEF_FY13_04252014.pdf; government funding includes dollars from both state and local funding sources.
[33] Federal Reserve Bank of New York, “Quarterly Report on Household Debt and Credit,” February 2014, http://www.newyorkfed.org/householdcredit/2013-Q4/HHDC_2013Q4.pdf.
[34] College Board “Trends in Student Aid,” Figure 10A, http://trends.collegeboard.org/sites/default/files/student-aid-2013-full-report-140108.pdf.
[35] See, for example, Steven W. Hemelt and Dave E. Marcotte, “The Impact of Tuition Increases on Enrollment at Public Colleges and Universities,” Educational Evaluation and Policy Analysis, September 2011; Donald E. Heller, “Student Price Response in Higher Education: An Update to Leslie and Brinkman,” The Journal of Higher Education, Volume 68, Number 6 (November-December 1997), pp. 624-659.
[36] Thomas J. Kane, “Rising Public College Tuition and College Entry: How Well Do Public Subsidies Promote Access to College?” National Bureau of Economic Research, 1995, http://www.nber.org/papers/w5164.pdf?new_window=1.
[37] Anthony P. Carnavale, “A Real Analysis of Real Education,” Liberal Education, Fall 2008, p. 57.
[38] Terenzini, Patrick T., Alberto F. Cabrera, and Elena M. Bernal. “Swimming Against the Tide,” College
Board, 2001, http://www.collegeboard.com/research/pdf/rdreport200_3918.pdf.
[39] Eleanor W. Dillon and Jeffrey A. Smith, “The Determinants of Mismatch Between Students and Colleges,” National Bureau of Economic Research, August 2013, http://www.nberg.org/papers/w19286. Additionally, other studies have found that undermatching is more likely to occur for students of color. In 2009 Bowen, Chingos, and McPherson found that undermatching was more prevalent for Black students — especially black women — relative to comparable white students.
[40] Stacey Dale and Alan Krueger, “Estimating the Return to College Selectivity Over the Career Using Administrative Earning Data.” Mathematica Policy Research and Princeton University, February 2011, http://www.mathematica-mpr.com/publications/PDFs/education/returntocollege.pdf.
[41] College Board, “Trends in Student Aid 2013,” pg. 24, https://trends.collegeboard.org/sites/default/files/student-aid-2013-full-report-140108.pdf.
[42] CBPP calculation using “Trends in College Pricing,” October, Table 7, http://trends.collegeboard.org/college-pricing/figures-tables/average-net-price-full-time-students-over-time-public-institutions.
[43] Richard Kogan and Joel Friedman, “Ryan Plan Gets 69 Percent of Its Budget Cuts From Programs for People With Low or Moderate Incomes,” Center on Budget and Policy Priorities, April 9, 2014, https://www.cbpp.org/cms/index.cfm?fa=view&id=4122.
[44] College Board, “Trends in Student Aid, 2013: Need-Based and Non-Need-Based State Grants per FTE Student over Time,” Figure 17A, https://trends.collegeboard.org/student-aid/figures-tables/grants#State Grants.
[45] College Board, “Trends in College Pricing, 2013: Net Prices by Income over Time: Public Sector” October, Figure 12 http://trends.collegeboard.org/college-pricing/figures-tables/net-prices-income-over-time-public-sector.
[46] College Board “Trends in Student Aid, 2013: Median Debt Levels of 2007-08 Bachelor’s Degree Recipients by Income Level,” October 2013, Figure 2010_9, https://trends.collegeboard.org/student-aid/figures-tables/median-debt-levels-2007-08-bachelors-degree-recipients-income-level.
[47] CBPP calculations data from NPSAS. Median debt levels for dependent student borrowers at public 4-year institutions at graduation. Interpret with caution, small sample size.
[48] Michael Greenstone and Adam Looney, The Hamilton Project, “Regardless of the Cost, College Still Matters,” October 5, 2012, http://www.brookings.edu/blogs/jobs/posts/2012/10/05-jobs-greenstone-looney.
[49] Enrico Moretti, “Estimating the Social Return to Higher Education: Evidence from Longitudinal and Repeated Cross-Sectional Data,” Journal of Econometrics, Vol. 121, 2004, pp. 175-212.
[50] See Anthony P. Carnevale, Nicole Smith, and Jeff Strohl, “Recovery: Job Growth and Education Requirements through 2020,” Georgetown University Center on Education and the Workforce, June 2013 https://georgetown.app.box.com/s/tll0zkxt0puz45hu21g6.
[51] Ibid.
[52] For impacts of debt on homeownership, see Jennifer M. Shand, “The Impact of Early-Life Debt on the Homeownership Rates of Young Households: An Empirical Investigation,” November 2007, http://www.fdic.gov/bank/analytical/cfr/2008/jan/CFR_SS_2008Shand.pdf.; for relationship between debt and graduation see for example, Rachel E. Dwyer, Laura McCloud, and Randy Hodson, “Debt and Graduation from American Universities,” Social Forces, June 15, 2012 http://sf.oxfordjournals.org/content/90/4/1133; for information Lindsey E. Malcolm and Alicia C. Dowd, “The Impact of Undergraduate Debt on the Graduate School Enrollment of STEM Baccalaureates,” The Review of Higher Education, Volume 35, Number 2, Winter 2012, pp. 265-305.
[53] Michael Leachman and Chris Mai, “Most States Funding Schools Less Than Before the Recession,” Center on Budget and Policy Priorities, September 12, 2013, https://www.cbpp.org/cms/index.cfm?fa=view&id=4011.
[54] Nicholas Johnson and Michael Leachman, “Four Big Threats to State Finances Could Undermine Future U.S. Prosperity,” Center on Budget and Policy Priorities, February 14, 2013, https://www.cbpp.org/sites/default/files/atoms/files/2-14-13sfp.pdf.
[55] Nan Madden “Tax bill makes strides toward tax fairness, investments in our future,” Minnesota Budget Project, May 20, 2013, http://minnesotabudgetbites.org/2013/05/20/tax-bill-makes-strides-toward-tax-fairness-investments-in-our-future/#.UyNSFPldV8E.
More from the Authors

Areas of Expertise
Areas of Expertise