Years of Cuts Threaten to Put College Out of Reach for More Students
Even as states restore some funding that was cut in recent years, their support for higher education remains well below pre-recession levels, straining college affordability ― especially for students whose families struggle to make ends meet.
Many public two- and four-year colleges and universities avoided significant tuition increases for the second year in a row, as most states continued to replenish higher education support. Still, 13 states further cut funding in the past year. And in almost all states, higher education support remains below what it was in 2008, at the onset of the Great Recession.
These cuts led to steep tuition increases that threaten to put college out of reach for more students. They also raise concerns about diminishing the quality of education at a time when a highly educated workforce is more crucial than ever to the nation’s economic future.
After adjusting for inflation:
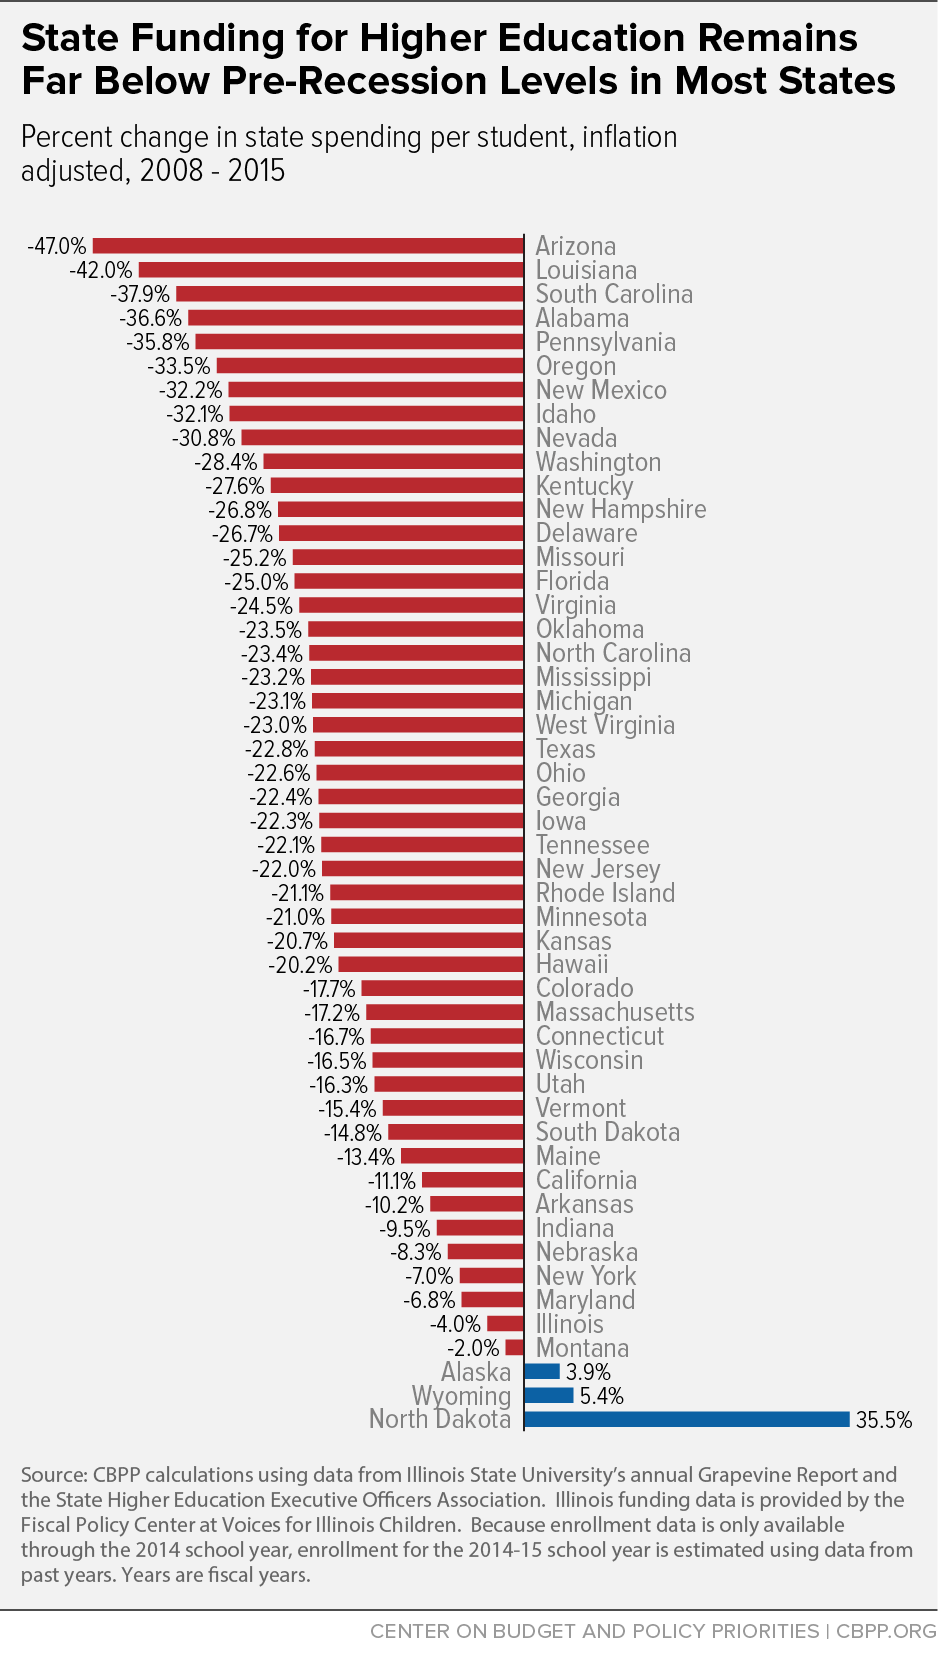
- Forty-seven states — all except Alaska, North Dakota, and Wyoming — are spending less per student in the 2014-15 school year than they did at the start of the recession.[2]
- States cut funding deeply after the recession hit. The average state is spending $1,805, or 20 percent, less per student than it did in the 2007-08 school year.
- Per-student funding in Alabama, Arizona, Louisiana, Pennsylvania, and South Carolina is down by more than 35 percent since the start of the recession.
- In 13 states, per-student funding fell over the last year. Of these, three states — Kentucky, Oklahoma, and West Virginia — have cut per-student higher education funding for the last two consecutive years.
- In the last year, 37 states increased funding per student. Per-student funding rose $268, or 3.9 percent, nationally.
Deep state funding cuts have had major consequences for public colleges and universities. States (and to a lesser extent localities) provide roughly 53 percent of the revenue that can be used to support instruction at these schools.[3] When this funding is cut, colleges and universities look to make up the difference with higher tuition levels, cuts to educational or other services, or both.
Indeed, since the recession, higher education institutions have:
-
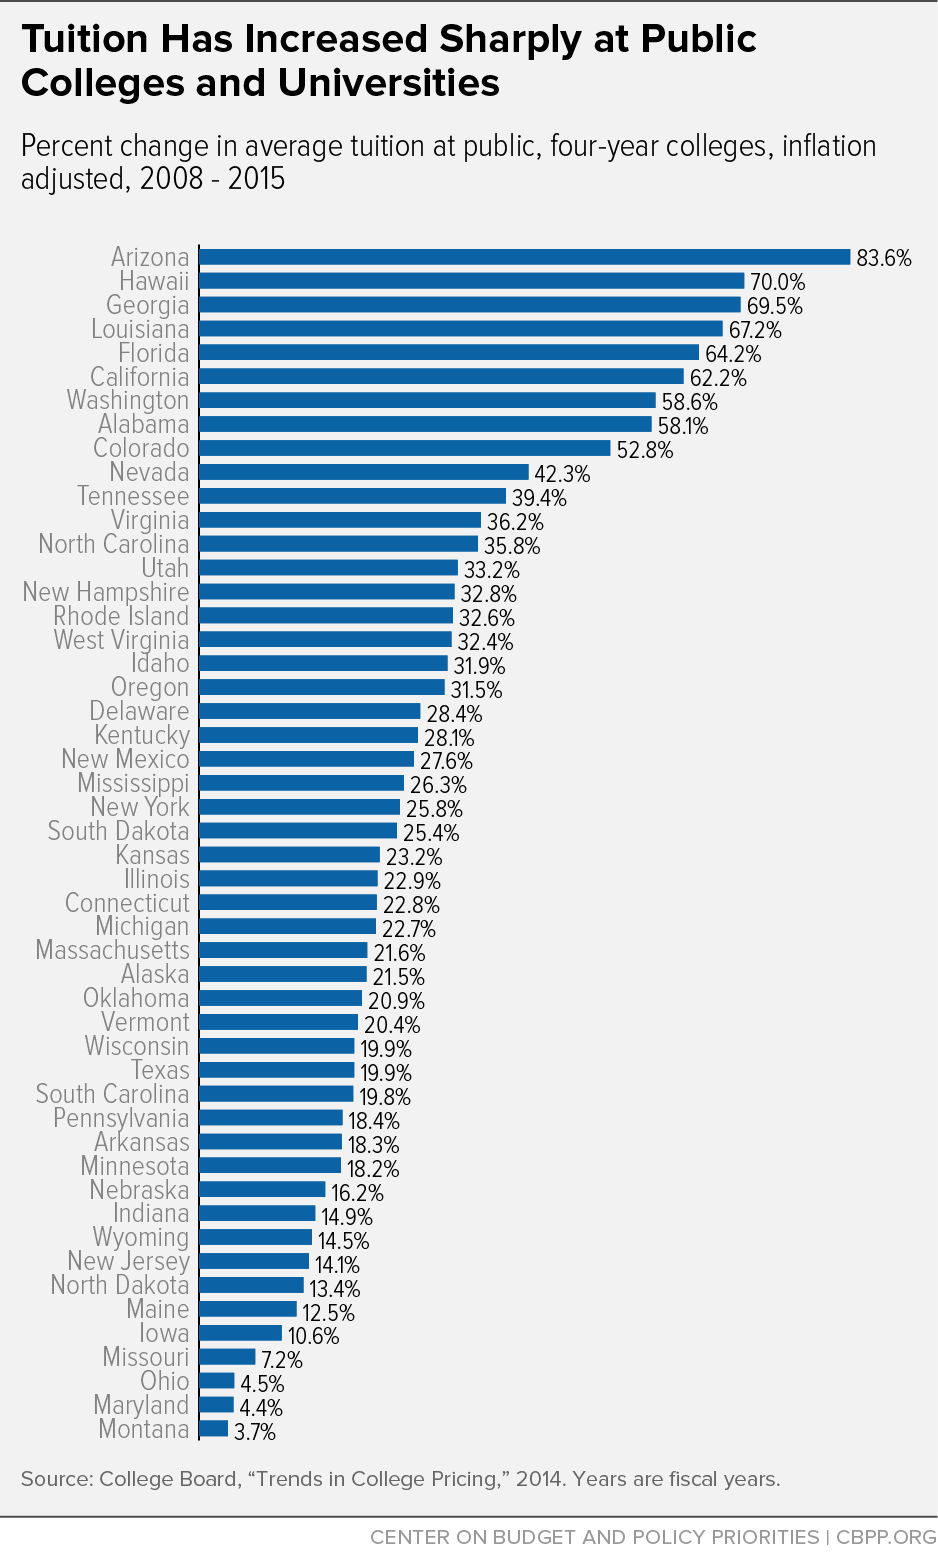
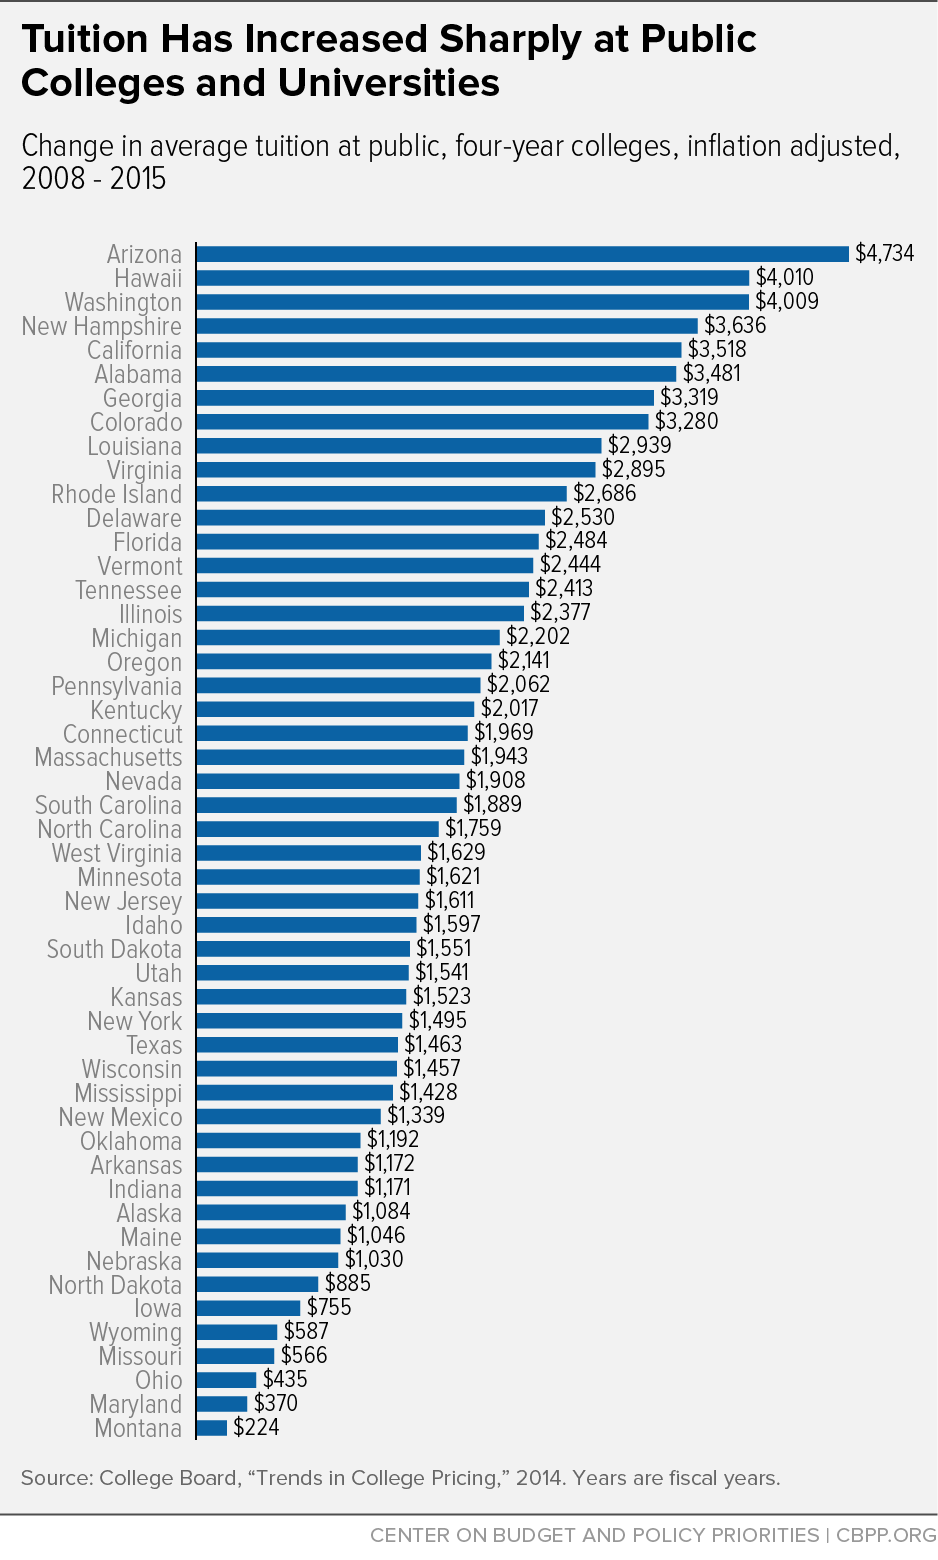
Increased tuition. Public colleges and universities across the country have increased tuition to compensate for declining state funding and rising costs. Annual published tuition at four-year public colleges has risen by $2,068, or 29 percent, since the 2007-08 school year, after adjusting for inflation.[4] In Arizona, published tuition at four-year schools is up more than 80 percent, while in five other states — California, Florida, Georgia, Hawaii, and Louisiana — published tuition is up more than 60 percent.
These sharp increases in tuition have accelerated longer-term trends of college becoming less affordable and costs shifting from states to students. Over the last 20 years, the price of attending a four-year public college or university has grown significantly faster than the median income.[5] Federal student aid and tax credits have risen, but on average they have fallen short of covering the tuition increases.
- Cut spending, often in ways that may diminish access and quality and jeopardize outcomes. Tuition increases have compensated for only part of the revenue loss resulting from state funding cuts. Over the past several years, public colleges and universities have cut faculty positions, eliminated course offerings, closed campuses, shut computer labs, and reduced library services, among other cuts.
A large and growing share of future jobs will require college-educated workers.[6] Sufficient funding for higher education to keep tuition affordable and quality high at public colleges and universities, and to provide financial aid to those students who need it most, would help states to develop the skilled and diverse workforce they will need to compete for these jobs.
Responsible reinvestment can only occur, however, if policymakers make sound tax and budget decisions. State revenues have improved significantly since the depths of the recession but are still only slightly above pre-recession levels, after adjusting for inflation.[7] To return higher education funding to pre-recession levels, many states may need to supplement that revenue growth with new revenue to fully make up for years of severe cuts.
But just as the opportunity to reinvest is emerging, lawmakers in many states are jeopardizing it by entertaining unaffordable tax cuts. In states such as Alabama, Maine, New Hampshire, North Carolina, and Wisconsin, lawmakers are considering costly changes to their tax codes. Some have already enacted cuts: for example, legislators in Arkansas earlier this year passed a tax cut that will reduce revenue by nearly $100 million, while at the same time the state is spending more than $13 million less on higher education than it in 2008 — amounting to nearly $1,000 less in state support per student.
States Have Reversed Some Funding Cuts, but They Must Do Much More
State and local tax revenue is a major source of funding for public colleges and universities. Unlike private institutions, which may rely upon gifts and large endowments to help fund instruction, public two- and four-year colleges typically rely heavily on state and local appropriations. In 2014, state and local dollars constituted 53 percent of education revenue — the funds used directly for teaching and instruction.[8]
While states have begun to restore funding, resources are well below what they were in 2008 — 20 percent per student lower — even as state revenues have returned to pre-recession levels. Compared with the 2007-08 school year, when the recession hit, adjusted for inflation:
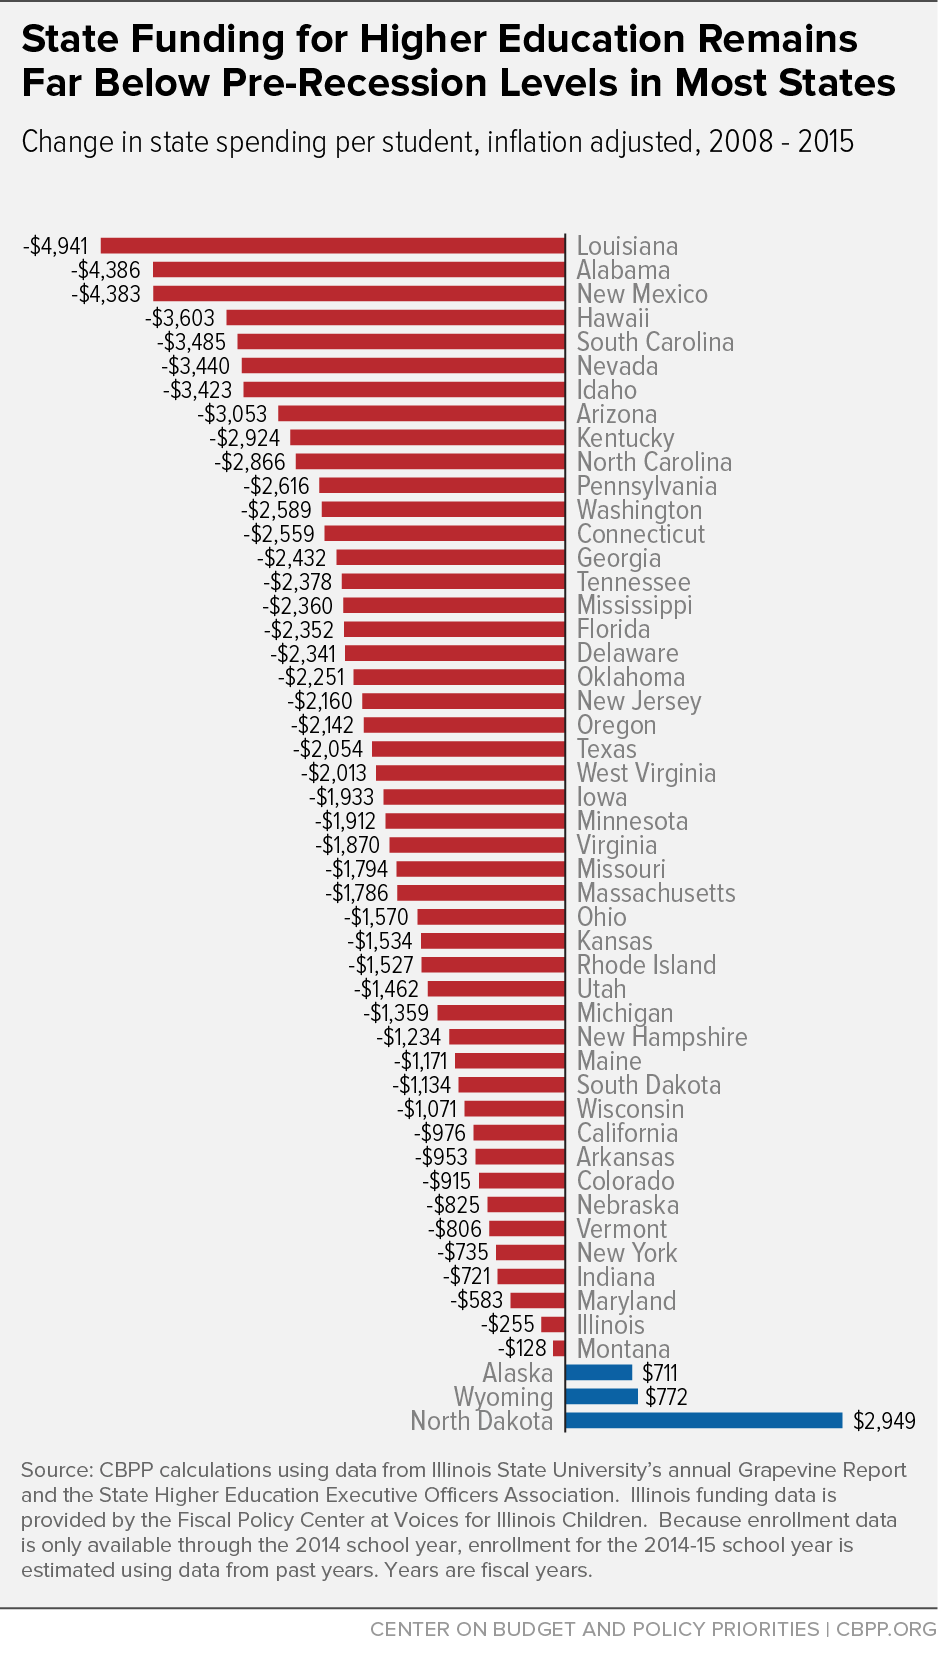
- State spending on higher education nationwide is down an average of $1,805 per student, or 20.3 percent.
- Every state except Alaska, North Dakota, and Wyoming has cut per-student funding.
- 31 states have cut funding per student by more than 20 percent.
- Six states have cut funding per student by more than one-third.
- Per-student funding in Arizona and Louisiana is down by more than 40 percent.[9] (See Figures 1 and 2.)
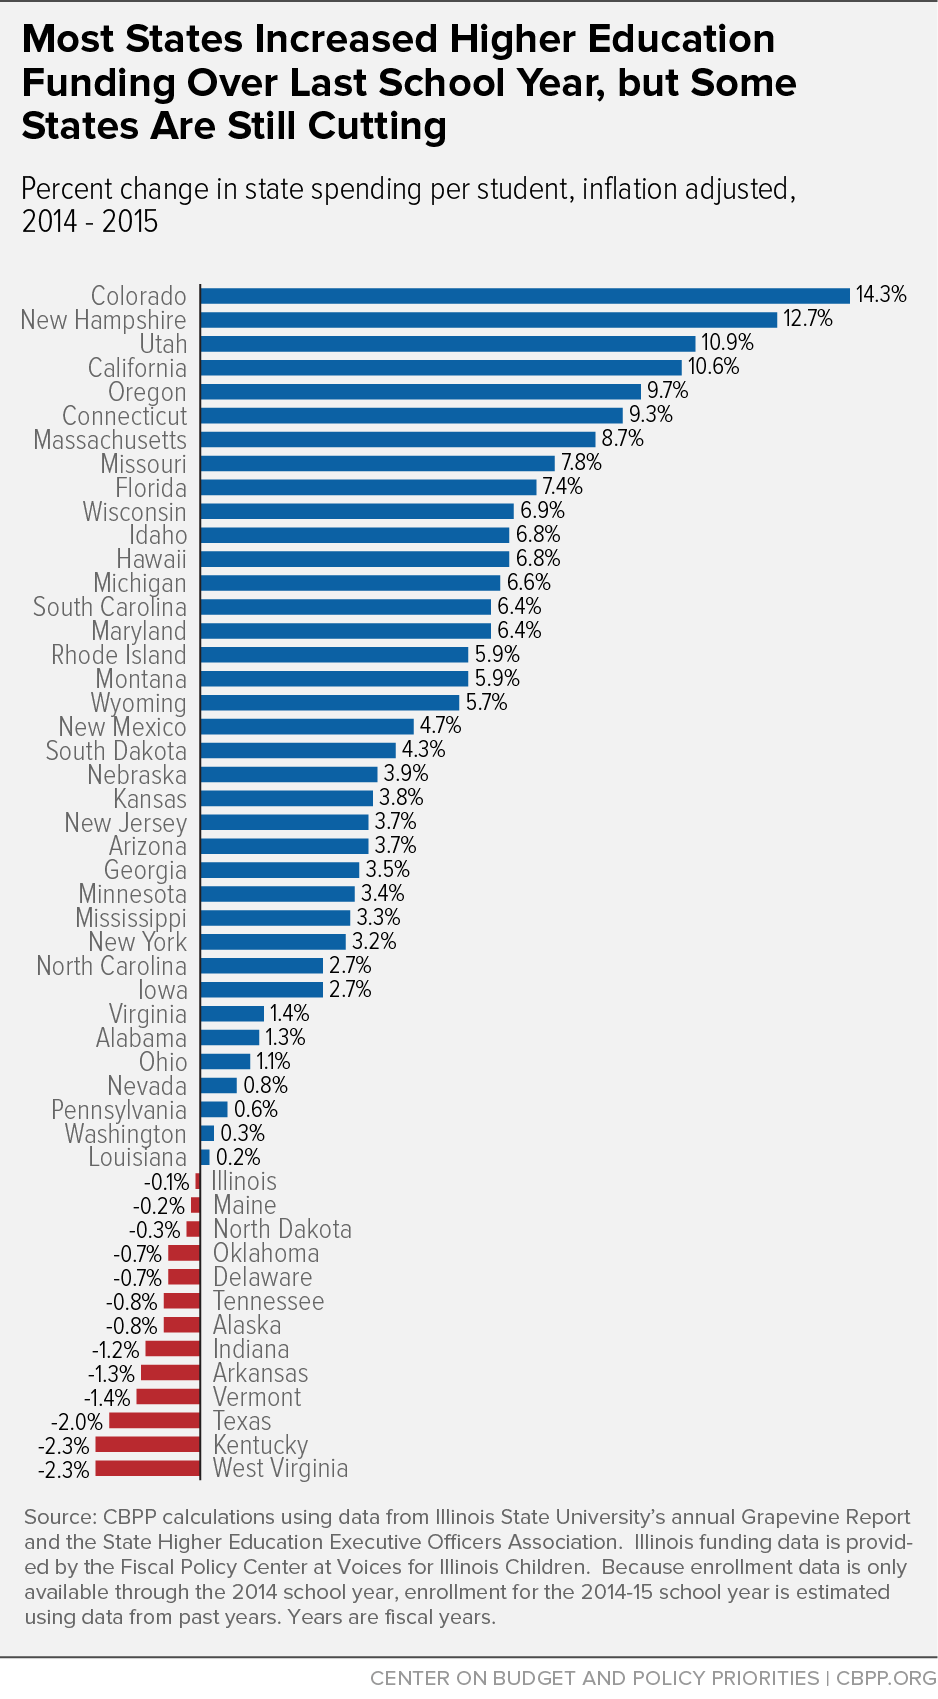
Over the past year, most states increased per-student funding for their public higher education systems. (See Figures 3 and 4.) Thirty-seven states are investing more per student in the 2014-15 school year than they did in 2013-14. Adjusted for inflation:
- Nationally, spending is up an average of $268 per student, or 4 percent.
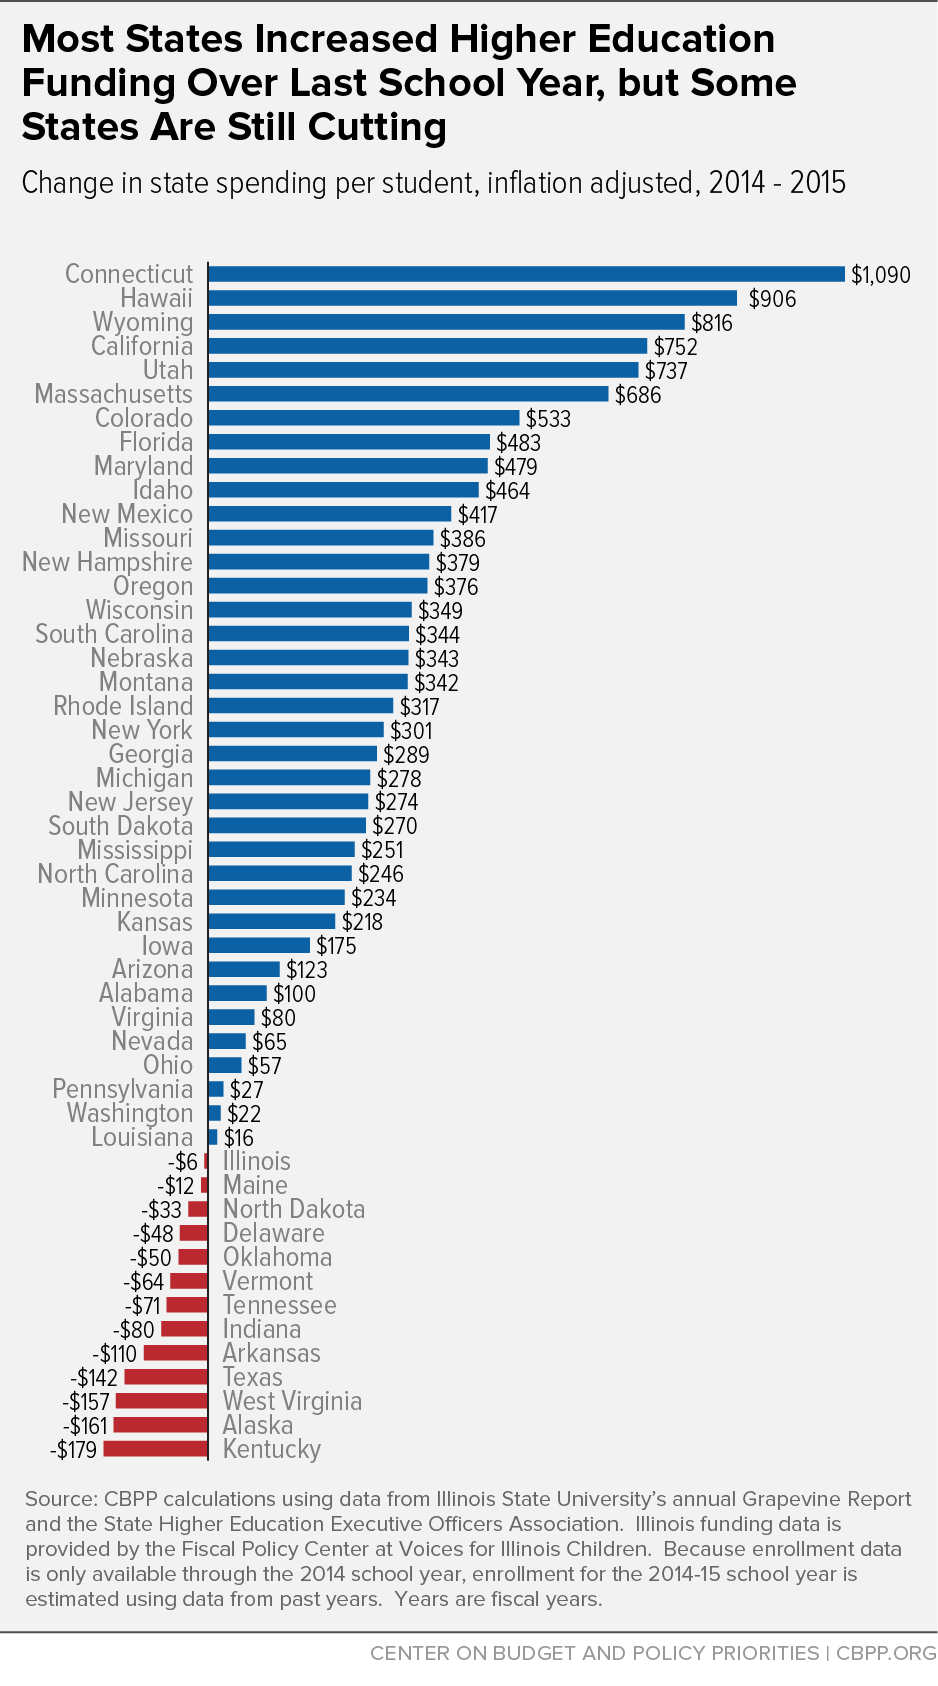
- The funding increases vary from $16 per student in Louisiana to $1,090 in Connecticut.
- 18 states increased per-student funding by more than 5 percent.
- Four states ― California, Colorado, New Hampshire, and Utah — increased funding by more than 10 percent.
Still, in 13 states, per-student funding fell over the last year — declining, on average, by more than $50 per student. Adjusted for inflation:
- Funding cuts vary from $6 per student in Illinois to $179 in Kentucky.
- Five states — Alaska, Arkansas, Kentucky, Texas, and West Virginia — cut funding by more than $100 per student over the past year.
- Three states — Kentucky, Oklahoma, and West Virginia — have cut per-student higher education funding for the last two consecutive years.
Why Did States Cut Higher Education Funding After the Recession Hit?
The cuts resulted from state and federal responses to the deep recession and a slow recovery.
- State tax revenues fell very sharply and are only now returning to pre-recession levels. The recession of 2007-09 hit state revenues hard, and the slow recovery continues to affect them. High unemployment and a slow recovery in housing values left people with less income and less purchasing power. As a result, states took in less income and sales tax revenue, the main sources of revenue that they use to fund education and other services. By the fourth quarter of 2014, total state tax revenues were only 2 percent greater than they were at the onset of the recession after adjusting for inflation.[10]
-
Limited revenues must support more students. Public higher education institutions must educate more students, raising costs. In part due to the “baby boom echo” causing a surge in the 18- to 24-year-old population, enrollment in public higher education is up by nearly 900,000 full-time-equivalent students, or 8.6 percent, between the beginning of the recession and the 2013-14 academic year (the latest year for which there is actual data).[11]
The recession also played a large role in swelling enrollment numbers, particularly at community colleges, reflecting high school graduates choosing college over dim employment prospects and older workers entering classrooms in order to retool and gain new skills.[12]
Other areas of state budgets also are under pressure. For example, an estimated 485,000 more K-12 students are enrolled in the current school year than in 2008.[13] Long-term growth in state prison populations — with state facilities now housing nearly 1.36 million inmates — also continues to put pressure on state spending.[14]
- Many states chose sizeable budget cuts over a balanced mix of spending reductions and targeted revenue increases. States relied disproportionately on damaging cuts to close the large budget shortfalls they faced over the course of the recession. Between fiscal years 2008 and 2012, states closed 45 percent of their budget gaps through spending cuts but only 16 percent through taxes and fees (they closed the remainder of their shortfalls with federal aid, reserves, and various other measures). States could have lessened the need for deep cuts to higher education funding if they had been more willing to raise additional revenue.
State Cuts Have Driven Up Tuition
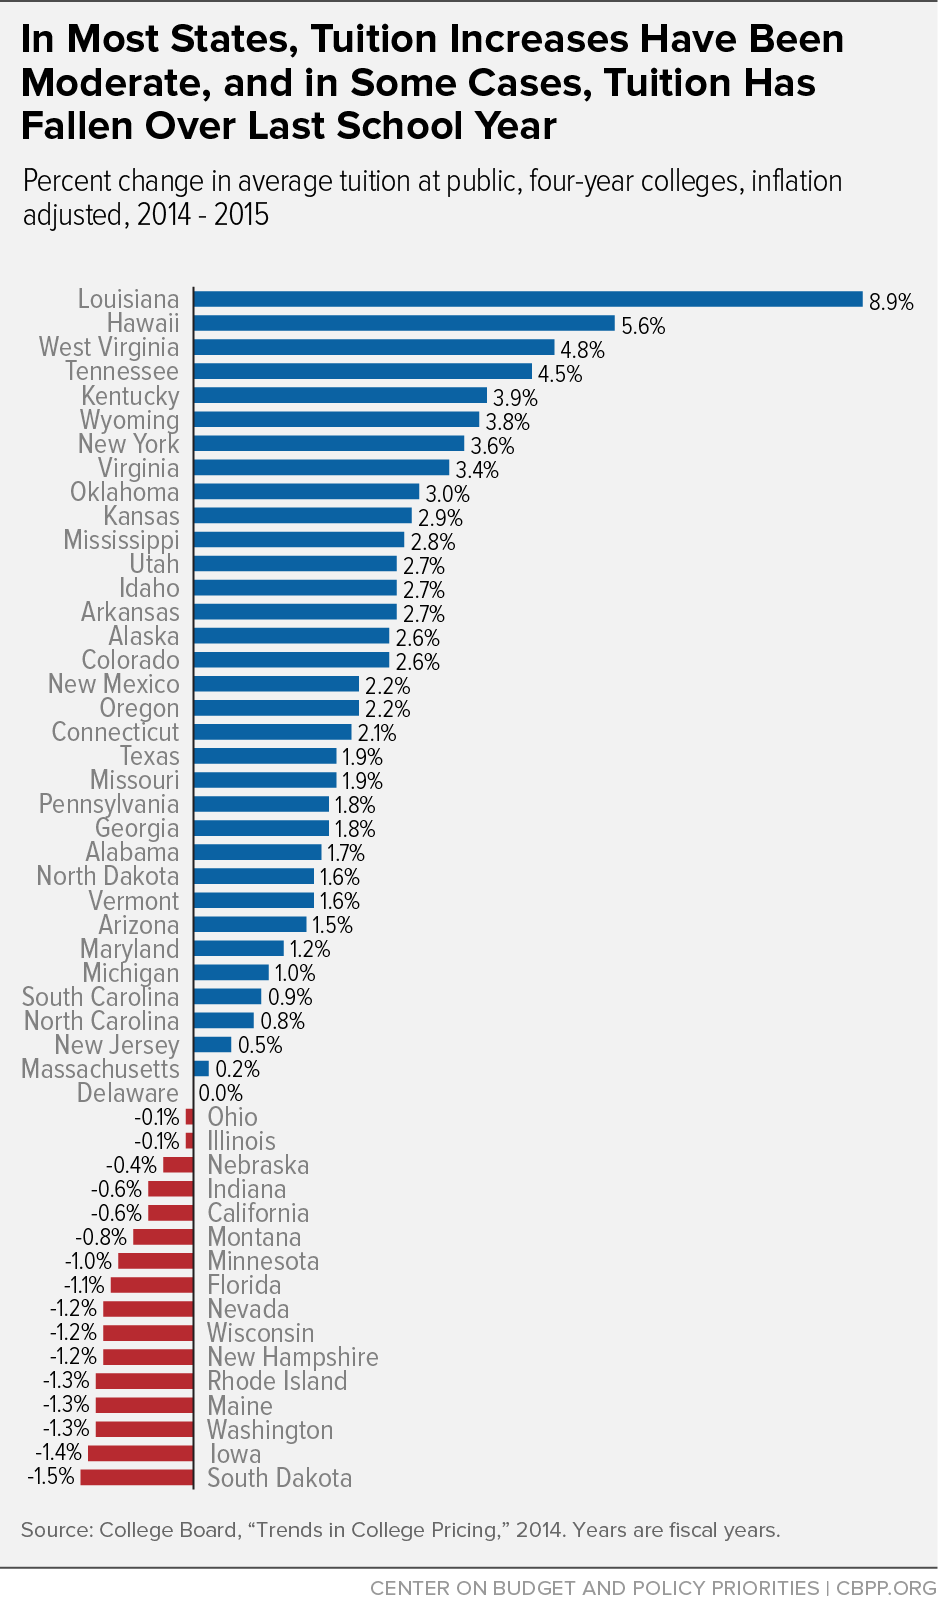
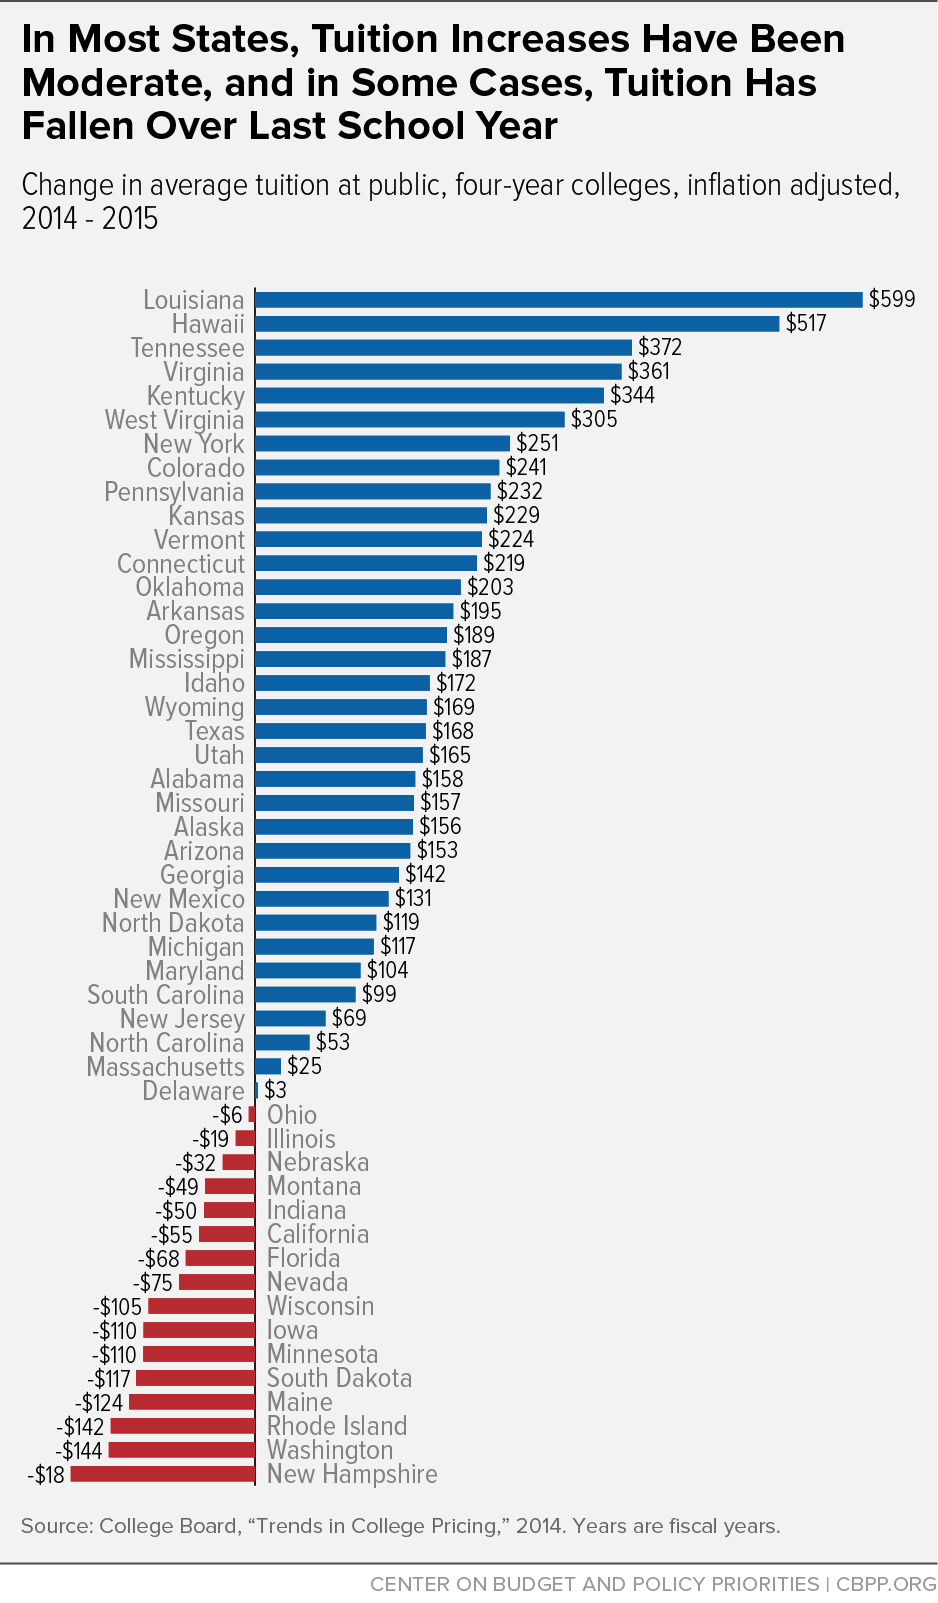
As states have begun to reinvest in public higher education, tuition hikes in 2014-15 have been much smaller than in preceding years.[15] Published tuition — the “sticker price” — at public four-year institutions increased in 34 states over the past year, but only modestly. Average tuition increased $107, or 1.2 percent, above inflation.[16] Between last year and this year, after adjusting for inflation:
- Louisiana increased average tuition across its four-year institutions more than any other state, hiking it by nearly 9 percent, or roughly $600.
- Four states — Louisiana, Hawaii, West Virginia, and Tennessee — raised average tuition by more than 4 percent.
- In 16 states, tuition fell modestly, with declines ranging from $6 in Ohio to $182 in New Hampshire.[17]
Tuition remains much higher than it was before the recession in most states. Since the 2007-08 school year, average annual published tuition has risen by $2,068 nationally, or 29 percent, above the rate of inflation.[18] Steep tuition increases have been widespread, and average tuition at public four-year institutions, adjusted for inflation, has increased by:
- more than 60 percent in six states;
- more than 40 percent in ten states; and
- more than 20 percent in 33 states. (See Figures 5 and 6.)
In Arizona, the state with the greatest tuition increases since the recession hit, tuition has risen 83.6 percent, or $4,734 per student, after adjusting for inflation. Average tuition at a four-year Arizona public university is now $10,398 a year.[19]
Public Colleges and Universities Also Have Cut Staff and Eliminated Programs
Recent tuition increases, while substantial in most states, have fallen far short of fully replacing the per-student funding that public colleges and universities have lost due to state funding cuts. Between 2008 and 2014 (the latest year for which data is available), tuition increases offset roughly 85 percent of cuts to state funding for higher education nationally.[20]
Because tuition increases have not fully compensated for the loss of state funding, and because most public schools do not have significant endowments or other sources of funding, public colleges and universities have simultaneously cut spending to make up for declining state funding.
Data on spending at public institutions of higher learning in recent years are incomplete, but considerable evidence suggests that many public colleges and universities constrained spending to make up for lost state funding, often in ways that reduced the quality and availability of their academic offerings. For example, since the start of the recession, in response to state budget cuts colleges and university systems across the states have eliminated administrative and faculty positions (in some instances replacing them with non-tenure-track staff), cut courses or increased class sizes, and in some cases, consolidated or eliminated whole programs, departments, or schools.[21]
Public colleges and universities have continued to make these types of cuts, even as states have begun to reinvest in higher education, as they have struggled to recover from the financial strain of years of budget cuts and enrollment declines. For example:
- West Virginia University has fired 13 employees and has not filled more than 100 positions.[22]
- In October 2014, the University of Southern Maine cut 50 faculty members and eliminated two academic programs to balance its budget.[23]
- The University of North Carolina at Greensboro has eliminated 390 class sections, or about 6 percent of its course offerings, to counteract a $4 million budget cut.[24]
- The 14 state-owned universities within the Pennsylvania State System of Higher Education eliminated 95 academic programs between 2011 and 2014.[25]
Nationwide, employment at public colleges and universities has grown modestly since the start of the recession, but proportionally less than the growth in the number of students. Between 2008 and 2013, the number of full-time-equivalent instructional staff at public colleges and universities grew by about 7 percent, while the number of students at these institutions grew by 10 percent. In other words, the number of students per faculty rose nationwide.[26]
Funding Cuts and Tuition Increases Have Shifted Costs From States to Students
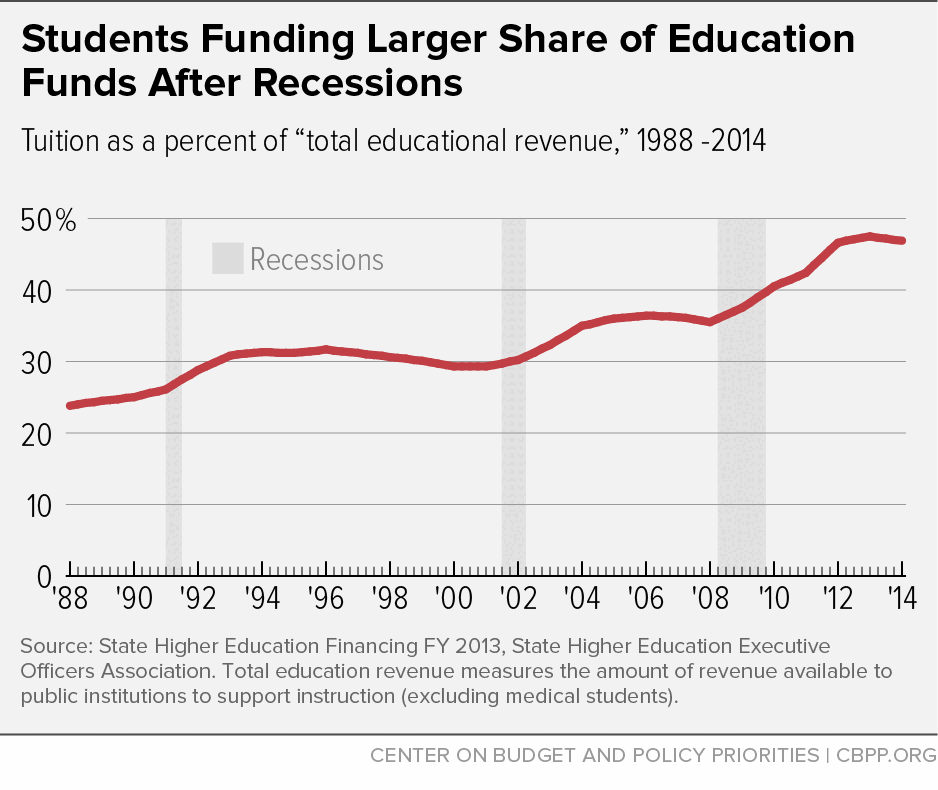
During and immediately following recessions, state and local funding for higher education has tended to plummet, while tuition has tended to spike. During periods of economic growth, funding has tended to recover somewhat while tuition has stabilized at a higher level as a share of total higher educational funding.[27] (See Figure 7.)
This trend has meant that over time, students have assumed much greater responsibility for paying for public higher education. In 1988, public colleges and universities received 3.2 times as much in revenue from state and local governments as they did from students. They now receive about 1.1 times as much from states and localities as from students.
Nearly every state has shifted costs to students over the last 25 years — with the most drastic shift occurring since the onset of the Great Recession. In 1988, average tuition amounts were larger than per-student state expenditures in only two states, New Hampshire and Vermont. By 2008, that number had grown to ten states. Today, tuition revenue is greater than state and local government funding for higher education in half of the states, with seven — Colorado, Delaware, Michigan, New Hampshire, Pennsylvania, Rhode Island, and Vermont— asking students and families to shoulder higher education costs by a ratio of at least 2-to-1.[28]
Families Have Been Hard-Pressed to Absorb Rising Tuition Costs
The cost shift from states to students has happened over a period when absorbing additional expenses has been difficult for many families because their incomes have been stagnant or declining. In the 1970s and early- to mid-1980s, tuition and incomes both grew modestly faster than inflation, but by the late 1980s, tuition began to rise much faster than incomes. (See Figure 8.)
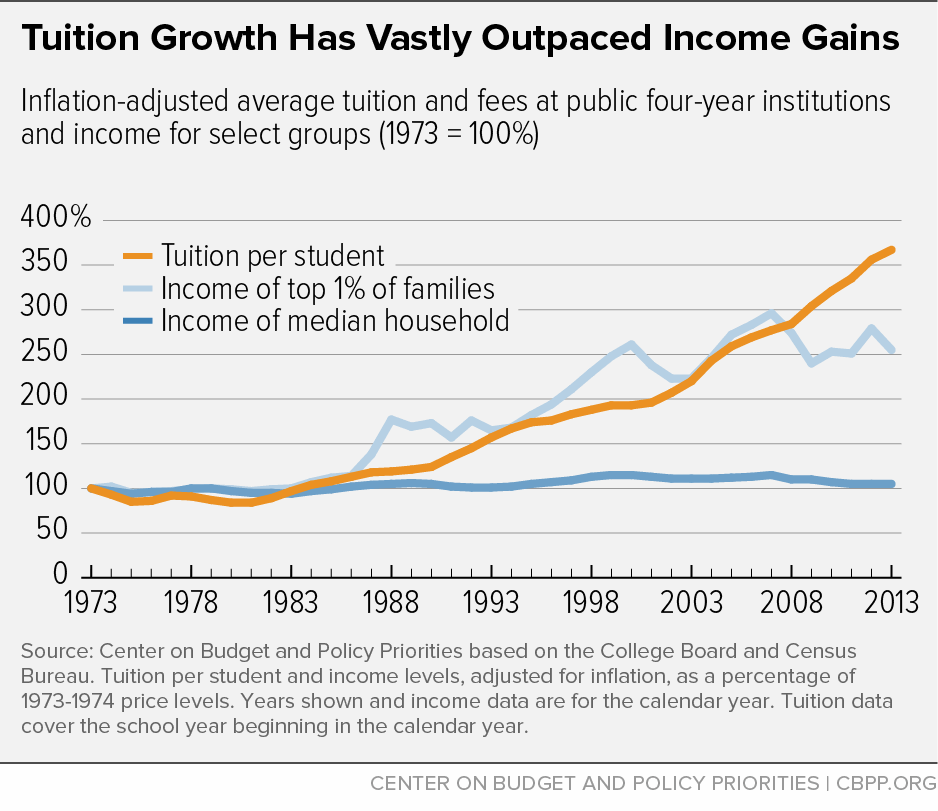
- Since 1973, average inflation-adjusted public college tuition has more than tripled — increasing by nearly 270 percent — but median household income has barely changed, up merely 5 percent.
- Over the past 40 years, the incomes of the top 1 percent of families have climbed 155 percent. That is, even for the highest earners, public college tuition has outpaced income growth.
- The sharp tuition increases states have imposed since the recession have exacerbated the longer-term trend. Tuition jumped nearly 28 percent between the 2007-08 and 2013-14 school years, while real median income fell roughly 8 percent over the same time period.
Cost Shift Harms Students and Families, Especially Those With Low Incomes
Rapidly rising tuition at a time of weak or declining income growth has damaging consequences for families, students, and the national economy.
- Tuition costs are deterring some students from enrolling in college. While the recession encouraged many students to enroll in higher education, the large tuition increases of the past few years may have prevented further enrollment gains. Rapidly rising tuition makes it less likely that students will attend college. Research has consistently found that college price increases result in declining enrollment.[29] While many universities and the federal government provide financial aid to help students bear the price, research suggests that a high sticker price can dissuade students from enrolling even if the net price, including aid, doesn’t rise.
-
Tuition increases are likely deterring low-income students, in particular, from enrolling. Research further suggests that college cost increases have the biggest impact on students from low-income families. For example, a 1995 study by Harvard University researcher Thomas Kane concluded that states that had the largest tuition increases during the 1980s and early 1990s “saw the greatest widening of the gaps in enrollment between high- and low-income youth.”[30] These damaging effects may be exacerbated by the relative lack of knowledge among low-income families about the admissions and financial aid process. Low-income students tend to overestimate the true cost of higher education more than students from wealthier households in part because they are less aware of financial aid for which they are eligible.[31]
These effects are particularly concerning because gaps in college enrollment between higher- and lower-income youth are already pronounced. In 2012 just over half of recent high school graduates from families in the bottom income quintile enrolled in some form of postsecondary education, as opposed to 82 percent of students from the highest income quintile.[32] Significant enrollment gaps based on income exist even among prospective students with similar academic records and test scores.[33] Rapidly rising costs at public colleges and universities may widen these gaps further.
-
Tuition increases may be pushing lower-income students toward less-selective institutions, reducing their future earnings. Perhaps just as important as a student’s decision to enroll in higher education is the choice of which college to attend. A 2013 study by the Brookings Institution revealed that a large proportion of high-achieving, low-income students fail to apply to any selective colleges or universities.[34] Even here, research indicates financial constraints and concerns about cost push lower-income students to narrow their list of potential schools and ultimately enroll in less-selective institutions.[35] In a different 2013 study, economists Eleanor Dillon and Jeffrey Smith found evidence that some high-achieving, low-income students are more likely to “undermatch” in their college choice in part due to financial constraints.[36]
Where a student decides to go to college has broad economic implications, especially for disadvantaged students and students of color. A 2011 study by Stanford University and Mathematica Policy Research found students who had parents with less education, as well as African American and Latino students, experienced higher postgraduate earnings by attending more elite colleges relative to similar students who attended less-selective universities.[37]
Federal Financial Aid Has Increased Since the Recession but State Aid Has Declined
While tuition has soared since the recession, federal financial aid also has increased. The Federal Pell Grant Program ― the nation’s primary student grant aid program ― more than doubled the amount of aid it distributed between the 2007-08 and 2013-14 school years, even after adjusting for inflation. This substantial boost enabled the program not only to reach a greater number of students ― 3.6 million more students received Pell support last year than in 2008 ― but also to provide the average recipient with more funding. The average grant rose by 24 percent — to $3,677 from $2,969 — after adjusting for inflation.[38]
The increase in federal financial aid has helped many students and families pay for recent tuition hikes. The College Board calculates that the annual value of grant aid and higher education tax benefits for students at four-year public colleges nationally has increased by an average of $1,710 in real terms since the 2007-08 school year, offsetting about 83 percent of the average $2,068 tuition increase. For community colleges, increases in student aid have more than made up the difference, leading to a decline in the net tuition cost for the average student.[39]
Since the sticker-price increases have varied so much from state to state while federal grant and tax-credit amounts are uniform across the country, students in states with large tuition increases — such as Arizona, Hawaii, and Washington — likely experienced substantial increases in their net tuition and fees, while the net cost for students in states with smaller tuition increases may have fallen.
The increase in federal financial aid has played a critical role in partially offsetting higher costs for students and families — and this funding is threatened. The U.S. House of Representatives recently proposed to eliminate a large portion of Pell Grant funding and freeze the maximum Pell Grant for ten years. While the final budget agreement between the House and Senate avoids spelling out specific cuts, its numbers call for substantial reductions to education funding.[40]
In contrast to federal dollars, financial aid provided by states, which was much smaller than federal aid even before the recession, has declined on average. In the 2007-2008 school year, state grant dollars equaled $740 per student. By 2013 — the latest year for which full data is available — that number had fallen to $710, a decline of roughly 4 percent.[41]
Low-Income Students Still Face High Levels of Debt
While rising federal financial aid has lessened the impact of tuition and fee increases on low-income students, the overall average cost of attending college has risen for these students, because room and board costs have increased, too. As a result, the net cost of attendance at four-year public institutions for low-income students increased 12 percent from 2008 to 2012, after adjusting for inflation. For low-income students attending public community colleges, the increase over the same time period was 4 percent.[42]
Because grants and tax credits rarely cover the full cost of college attendance, most students — and low-income students in particular — borrow money. In 2012, 79 percent of low-income students — from families in the bottom income quartile — graduating with a bachelor’s degree had student loans (compared with 55 percent of graduating students from wealthy families).[43]
Debt levels have risen since the start of the recession for college and university students collectively. By the fourth quarter of 2014, students held $1.16 trillion in student debt — eclipsing both car loans and credit card debt.[44] Further, the overall share of students graduating with debt has increased since the start of the recession. Between the 2007-08 and 2012-13 school years, the share of students graduating from a public four-year institution with debt increased from 55 to 59 percent. At the same time, between the 2007-08 and 2012-13 school years, the average amount of debt incurred by the average bachelor’s degree recipient with loans at a public four-year institution grew from $22,000 to $25,600 (in 2013 dollars), an inflation-adjusted increase of $3,600, or roughly 16 percent. By contrast, the average level of debt incurred had risen only about 3.7 percent in the eight years prior to the recession.[45] In short, at public four-year institutions, a greater share of students are taking on larger amounts of debt.
Funding Cuts Jeopardize Both Students’ and States’ Economic Futures
The reduced college access and graduation rates that research suggests are likely to result from budget cuts affect more than just students, because college attainment has grown increasingly important to long-term economic outcomes for states and the nation.
Getting a college degree is increasingly a pre-requisite for professional success and for entry into the middle class or beyond. A young college graduate earns $12,000 a year more annually than someone who did not attend college.[46]
The benefits of academic attainment extend beyond those who receive a degree; research suggests that the whole community benefits when more residents have college degrees. For instance, higher educational attainment has been connected with lower rates of crime, greater levels of civic participation, and better health outcomes.[47] Areas with highly educated residents tend to attract strong employers who pay their employees competitive wages. Those employees, in turn, buy goods and services from others in the community, broadly benefitting the area’s economy. Economist Enrico Moretti of the University of California at Berkeley finds that as a result, the wages of workers at all levels of education are higher in metropolitan areas with high concentrations of college-educated residents.[48] This finding implies that — even though not all good jobs require a college degree — having a highly educated workforce can boost an area’s economic success.
The economic importance of higher education will continue to grow. In a 2013 report, researchers from the Georgetown University Center on Education and the Workforce projected that by 2020, nearly two-thirds of all jobs will require at least some college education, up from 59 percent in 2007.[49]
The Georgetown Center further projects that, based on current trends — without significant new investment in capacity — the nation’s education system will not keep pace with the rising demand for educated workers. By 2020, the country’s system of higher education will produce 5 million fewer college graduates than the labor market will demand.[50]
The increase in student debt in recent years also has important implications for the broader economy. While debt is a crucial tool for financing higher education, excessive debt can impose considerable costs on both students and society as a whole. Research finds that higher student debt levels are associated with lower rates of homeownership among young adults; can create stresses that reduce the probability of graduation, particularly for students from lower-income families; and reduce the likelihood that graduates with majors in science, technology, engineering, and mathematics will go on to graduate school (which is often needed to obtain advanced positions in those fields).[51]
There is also growing concern that rising levels of debt may be preventing some young adults from starting businesses of their own. Many entrepreneurs rely heavily on personal debt to help launch their small businesses, and rising levels of student loan debt may make it more difficult to access loans or other lines of credit necessary for launching a startup. A 2014 study by the Federal Reserve Bank of Philadelphia found that this may be the case. Looking at the period from 2000 to 2010, researchers found that as student loan debt rose, net business formation of the smallest businesses — those employing four or fewer people — fell.[52]
This research suggests that states should strive to expand college access and increase college graduation rates to help build a strong middle class and develop the entrepreneurs and skilled workers needed to compete in today’s global economy. It suggests further that the severe higher education funding cuts that states have made since the start of the recession will make it more difficult to achieve those goals.
States’ Budget Choices Will Determine Whether They Can Successfully Rebuild Their Higher Education Systems
Over the past couple of years, as the economy has improved and state revenues have begun to approach — and in some cases surpass — pre-recession levels, most states have begun to reinvest in higher education. To sustain this trend, states will need to reject calls for costly and ineffective tax cuts, and many will need to raise additional revenue.
Every year, state lawmakers face the challenge of adequately funding a host of important state priorities. Elementary and secondary education, like higher education, has been cut in most states in recent years.[53] Health care services require states’ continued support, given an aging population and rising health costs. The nation’s system of roads and bridges is deteriorating and in need of new public investments, and states have limited ability to cut back on public safety or human services without risking real harm to communities. Those areas of spending account for more than 72 percent of state and local government funding; the rest of state budgets pay for environmental protection, the court system, and other important areas that also are hard to cut without significant negative consequences.[54]
This means that to make significant progress in renewing state investment in higher education, and to prevent investment from sliding even further, states need to reject calls for tax cuts and may need to consider options for new revenues. These revenues could come, for example, from repealing ineffective tax deductions, exemptions, and credits; rolling back past years’ tax cuts; or raising certain tax rates.[55]
The need for additional revenue is particularly urgent in states that in recent years enacted tax cuts that are proving to be unaffordable. For example, in the midst of the economic downturn Arizona lawmakers enacted sizeable corporate tax cuts that are just now beginning to phase in; they will cost roughly $210 million in fiscal year 2016.[56] At the same time, lawmakers are cutting public support for the state’s four-year colleges and universities by nearly $100 million, and community colleges by $16 million.[57] Arizona’s higher education funding already stands nearly 50 percent below pre-recession levels, and tuition at its public four-year colleges has increased by almost 84 percent since 2008.
Tax cuts are often sold as a recipe for economic growth. But to the extent that tax cuts prevent investments in higher education that would increase access to college, improve graduation rates, and reduce student debt, their net effect could be a drag on the economy. States that have cut higher education funding deeply and yet are considering or have enacted tax cuts this year include Arizona, Florida, Maine, Michigan, Montana, Nebraska, New Hampshire, North Carolina, Ohio, Texas, and Wisconsin.
Conclusion
States have cut higher education funding deeply since the start of the recession. These cuts were in part the result of a revenue collapse caused by the economic downturn, but they also resulted from misguided policy choices. State policymakers relied overwhelmingly on spending cuts to make up for lost revenues. They could have lessened the need for higher education funding cuts if they had used a more balanced mix of spending cuts and revenue increases to balance their budgets.
The impact of the funding cuts has been dramatic. Public colleges have both steeply increased tuition and pared back spending, often in ways that may compromise the quality of education and jeopardize student outcomes. Students are paying more through increased tuition and by taking on greater levels of debt. Now is the time to renew investment in higher education to promote college affordability and quality.
Strengthening state investment in higher education will require state policymakers to make the right tax and budget choices over the coming years. A slow economic recovery and the need to reinvest in other services that also have been cut deeply means that many states will need to raise revenue to rebuild their higher education systems. At the very least, states must avoid shortsighted tax cuts, which would make it much harder for them to invest in higher education, strengthen the skills of their workforce, and compete for — or even create — the jobs of the future.
Appendix:
| Appendix TABLE 1 | ||||
|---|---|---|---|---|
| Change in State Higher Education Appropriations, Enrollment, and Appropriations Per Student, 2007-08 School Year to 2014-15 School Year | ||||
| 2007 - 2008 | 2014 - 2015 | Change | Percent Change | |
| State Appropriations for Higher Education | $91,317,022,709 | 78,021,779,892 | -13,295,242,818 | -14.60% |
| Full-Time-Equivalent Enrollment at Public Colleges and Universities | 10,254,148 | 10,988,860 | 734,713 | 7.20% |
| State Appropriations Per Full-Time-Enrolled Student | $8,905 | 7,100 | -1,805 | -20.30% |
End Notes
[1] Anne Kruse assisted with gathering data for this report.
[2] CBPP calculation using the “Grapevine” higher education appropriations data from Illinois State University, enrollment data from the State Higher Education Executive Officers Association, and the Consumer Price Index, published by the Bureau of Labor Statistics. Since enrollment data is available only through the 2013-14 school year, enrollment for the 2014-15 school year is estimated using data from past years.
[3] State Higher Education Executive Officers Association, “State Higher Education Finance: FY2014,” April 2015, p. 19, http://www.sheeo.org/sites/default/files/project-files/SHEF%20FY%202014-20150410.pdf.
[4] Calculated from College Board, “Trends in College Pricing 2014: Average Tuition and Fee and Room and Board Charges, 1971-72 to 2014-15 (Enrollment-Weighted),” Table 2, http://trends.collegeboard.org/college-pricing.
[5] Calculated from “Trends in College Pricing 2014,” Table 2, and the Census Bureau’s Income, Poverty and Health Insurance Coverage in the United States: 2013, September 2014, Table A-2, http://www.census.gov/content/dam/Census/library/publications/2014/demo/p60-249.pdf.
[6] Anthony P. Carnevale, Nicole Smith, and Jeff Strohl, “Recovery: Job Growth and Education Requirements through 2020,” Georgetown University Center on Education and the Workforce, June 2013, https://georgetown.app.box.com/s/tll0zkxt0puz45hu21g6.
[7] CBPP calculation using Census Bureau and Bureau of Labor Statistics data, http://www.census.gov/govs/qtax/.
[8] State Higher Education Executive Officers Association, April 2015.
[9] CBPP calculation using the “Grapevine” higher education appropriations data from Illinois State University, enrollment and combined state and local funding data from the State Higher Education Executive Officers Association, and the Consumer Price Index, published by the Bureau of Labor Statistics. Since enrollment data is only available through the 2012-13 school year, enrollment for the 2013-14 school year is estimated using data from past years.
[10] CBPP analysis of Census quarterly state and local tax revenue, http://www.census.gov/govs/qtax/.
[11] State Higher Education Executive Officers Association, April 2015. Note: while full-time-equivalent enrollment at public two- and four-year institutions is up since fiscal year 2008, between fiscal years 2012 and 2013 it fell by approximately 150,000 enrollees — a 1.3 percent decline.
[12] See, for example, “National Postsecondary Enrollment Trends: Before, During and After the Great Recession,” National Student Clearinghouse Research Center, July 2011, page 6, http://pas.indiana.edu/pdf/National%20Postsecondary%20Enrollment%20Trends.pdf. A survey conducted by the American Association of Community Colleges indicated that increases in Fall 2009 enrollment at community colleges were, in part, due to workforce training opportunities; see Christopher M. Mullin, “Community College Enrollment Surge: An Analysis of Estimated Fall 2009 Headcount Enrollments at Community Colleges,” AACC, December 2009, http://files.eric.ed.gov/fulltext/ED511056.pdf.
[13] National Center for Education Statistics, Enrollment in public elementary and secondary schools, by level and grade: Selected years, fall 1980 through fall 2023, Table 203.10, http://nces.ed.gov/programs/digest/d13/tables/dt13_203.10.asp?current=yes.
[14] CBPP analysis of data from U.S. Department of Justice, Bureau of Justice Statistics.
[15] Costs reported above include both published tuition and fees. Average tuition and fee prices are weighted by full-time enrollment.
[16] This paper uses CPI-U-RS inflation adjustments to measure real changes in costs. Over the past year CPI-U-RS increased by 1.47 percent. We use the CPI-U-RS for the calendar year that begins the fiscal/academic year.
[17] CBPP calculation using College Board “Trends in College Pricing 2013,” http://trends.collegeboard.org/college-pricing. See appendix for fiscal year 2013-14 change in average tuition at public four-year colleges.
[18] CBPP analysis using College Board “Trends in College Pricing 2014,” http://trends.collegeboard.org/college-pricing/figures-tables/tuition-fees-room-board-time. Note: in non-inflation-adjusted terms, average tuition is up $2,948 over this time period.
[19] Ibid.
[20] CBPP calculations data from State Higher Education Executive Officers.
[21] See last year’s report for a more detailed account of university cuts: Michael Mitchell, Vincent Palacios, and Michael Leachman, “States are Still Funding Higher Education Below Pre-Recession Levels,” Center on Budget and Policy Priorities, May 1, 2014, https://www.cbpp.org/cms/?fa=view&id=4135.
[22] Mackenzie Mays, “W.Va. colleges make cuts to deal with less taxpayer funding,” The Charleston Gazette, August 31, 2014, http://www.wvgazette.com/article/20140831/GZ01/140839940.
[23] Noel K. Gallagher, “USM begins laying off faculty members,” Portland Press Herald, October 28, 2014, http://www.pressherald.com/2014/10/28/faculty-layoffs-at-usm-begin/.
[24] John Newsom, “Chancellor’s focus on UNCG’s future,” News & Record, April 4, 2014, http://www.news-record.com/news/article_b3d8a6d2-bbef-11e3-a250-0017a43b2370.html
[25] Stephen Herzenberg, Mark Price, and Michael Wood, “A Must-Have for Pennsylvania Part Two: Investment in Higher Education for Growth and Opportunity,” Keystone Research Center & Pennsylvania Budget and Policy Center, October 2014, https://pennbpc.org/sites/pennbpc.org/files/KRC_PBPC%20Higher%20Ed_0.pdf.
[26] CBPP analysis of employment data from the National Center for Education Statistics and enrollment data from the State Higher Education Executive Officers Association.
[27] State Higher Education Executive Officers Association, “State Higher Education Finance: FY2013,” 2014, p. 22, Figure 4, http://www.sheeo.org/sites/default/files/publications/SHEF_FY13_04252014.pdf.
[28] State Higher Education Executive Officers Association, April 2015; government funding includes dollars from both state and local funding sources.
[29] See, for example, Steven W. Hemelt and Dave E. Marcotte, “The Impact of Tuition Increases on Enrollment at Public Colleges and Universities,” Educational Evaluation and Policy Analysis, September 2011; Donald E. Heller, “Student Price Response in Higher Education: An Update to Leslie and Brinkman,” The Journal of Higher Education, Volume 68, Number 6 (November-December 1997), pp. 624-659.
[30] Thomas J. Kane, “Rising Public College Tuition and College Entry: How Well Do Public Subsidies Promote Access to College?” National Bureau of Economic Research, 1995, http://www.nber.org/papers/w5164.pdf?new_window=1.
[31] Eric P. Bettinger et al., “The Role of Simplification and Information in College Decisions: Results from the H&R Block FAFSA Experiment,” National Bureau of Economic Research, 2009, http://www.nber.org/papers/w15361.pdf.
[32] College Board, “Education Pays: 2013,” http://trends.collegeboard.org/sites/default/files/education-pays-2013-full-report-022714.pdf.
[33] In a 2008 piece, Georgetown University scholar Anthony Carnavale pointed out that “among the most highly qualified students (the top testing 25 percent), the kids from the top socioeconomic group go to four-year colleges at almost twice the rate of equally qualified kids from the bottom socioeconomic quartile.” Anthony P. Carnavale, “A Real Analysis of Real Education,” Liberal Education, Fall 2008, p. 57.
[34] Christopher Avery and Caroline M. Hoxby, “The Missing ‘One Offs’: The Hidden Supply of High-Achieving, Low-Income Students,” National Bureau for Economic Research, Working Paper 18586, 2012, http://www.brookings.edu/~/media/projects/bpea/spring-2013/2013a_hoxby.pdf.
[35]Patrick T. Terenzini, Alberto F. Cabrera, and Elena M. Bernal, “Swimming Against the Tide,” College Board, 2001, http://www.collegeboard.com/research/pdf/rdreport200_3918.pdf.
[36] Eleanor W. Dillon and Jeffrey A. Smith, “The Determinants of Mismatch Between Students and Colleges,” National Bureau of Economic Research, August 2013, http://www.nberg.org/papers/w19286. Additionally, other studies have found that undermatching is more likely to occur for students of color. In 2009 Bowen, Chingos, and McPherson found that undermatching was more prevalent for black students — especially black women — relative to comparable white students.
[37] Stacey Dale and Alan Krueger, “Estimating the Return to College Selectivity Over the Career Using Administrative Earning Data.” Mathematica Policy Research and Princeton University, February 2011, http://www.mathematica-mpr.com/publications/PDFs/education/returntocollege.pdf.
[38] College Board, “Trends in Student Aid 2014,” October 2014, Figure 22, http://trends.collegeboard.org/sites/default/files/2014-trends-student-aid-final-web.pdf.
[39] CBPP calculation using “Trends in College Pricing 2014,” October 2014, Table 7, http://trends.collegeboard.org/sites/default/files/2014-trends-college-pricing-final-web.pdf.
[40] For more information see Brandon DeBot and David Reich, “House Budget Committee Plan Cuts Pell Grants Deeply, Reducing Access to Higher Education,” Center on Budget and Policy Priorities, March 24, 2015, https://www.cbpp.org/cms/index.cfm?fa=view&id=5294.
[41] College Board, “Trends in Student Aid 2014,” October 2014, Figure 22, http://trends.collegeboard.org/sites/default/files/2014-trends-student-aid-final-web.pdf.
[42] College Board, “Cumulative Debt of 2011-12 Bachelor’s Degree Recipients by Dependency Status and Family Income,” October 2014, http://trends.collegeboard.org/college-pricing/figures-tables/net-prices-income-over-time-public-sector.
[43] College Board, “Trends in Student Aid, 2014: Median Debt Levels of 2007-08 Bachelor’s Degree Recipients by Income Level,” October 2014, Figure 2010_9, http://trends.collegeboard.org/sites/default/files/2014-trends-student-aid-final-web.pdf. Low-income dependent students are defined as students from families earning less than $30,000 annually, while high-income students come from families earning more than $106,000.
[44] Federal Reserve Bank of New York, “Quarterly Report on Household Debt and Credit,” February 2015, http://www.newyorkfed.org/householdcredit/2014-q4/data/pdf/HHDC_2014Q4.pdf.
[45] College Board “Trends in Student Aid,” Figure 13A, http://trends.collegeboard.org/student-aid/figures-tables/average-cumulative-debt-bachelors-recipients-public-four-year-time.
[46] Michael Greenstone and Adam Looney, “Regardless of the Cost, College Still Matters,” The Hamilton Project, October 5, 2012, http://www.brookings.edu/blogs/jobs/posts/2012/10/05-jobs-greenstone-looney.
[47] See for example Hill et al., “The Value of Higher Education: Individual and Societal Benefits,” October 2005, http://www.asu.edu/president/p3/Reports/EdValue.pdf and College Board, “Education Pays 2013,” October 2013, http://trends.collegeboard.org/sites/default/files/education-pays-2013-full-report-022714.pdf for summaries of social benefits of higher levels of educational attainment.
[48] Enrico Moretti, “Estimating the Social Return to Higher Education: Evidence from Longitudinal and Repeated Cross-Sectional Data,” Journal of Econometrics, Vol. 121, 2004, pp. 175-212.
[49] See Anthony P. Carnevale, Nicole Smith, and Jeff Strohl, “Recovery: Job Growth and Education Requirements through 2020,” Georgetown University Center on Education and the Workforce, June 2013, https://georgetown.app.box.com/s/tll0zkxt0puz45hu21g6.
[50] Ibid.
[51] For impacts of debt on homeownership, see Jennifer M. Shand, “The Impact of Early-Life Debt on the Homeownership Rates of Young Households: An Empirical Investigation,” November 2007, http://www.fdic.gov/bank/analytical/cfr/2008/jan/CFR_SS_2008Shand.pdf. For the relationship between debt and graduation, see for example, Rachel E. Dwyer, Laura McCloud, and Randy Hodson, “Debt and Graduation from American Universities,” Social Forces, June 15, 2012, http://sf.oxfordjournals.org/content/90/4/1133. For information on graduate enrollment, see for example Lindsey E. Malcolm and Alicia C. Dowd, “The Impact of Undergraduate Debt on the Graduate School Enrollment of STEM Baccalaureates,” The Review of Higher Education, Volume 35, Number 2, Winter 2012, pp. 265-305.
[52] Brent W. Ambrose, Larry Cordell, and Shuwei Ma, “The Impact of Student Loan Debt on Small Business Formation,” March 29, 2014, http://dx.doi.org/10.2139/ssrn.2417676.
[53] Michael Leachman and Chris Mai, “Most States Funding Schools Less Than Before the Recession,” Center on Budget and Policy Priorities, October 16, 2014, https://www.cbpp.org/cms/index.cfm?fa=view&id=4213.
[54] CBPP calculations, data from the National Association of State Budget Officers.
[55] Nicholas Johnson and Michael Leachman, “Four Big Threats to State Finances Could Undermine Future U.S. Prosperity,” Center on Budget and Policy Priorities, February 14, 2013, https://www.cbpp.org/research/four-big-threats-to-state-finances-could-undermine-future-us-prosperity.
[56] Arizona Joint Legislative Budget Committee, “2014 Tax Handbook,” September 2014, http://www.azleg.gov/jlbc/14taxbook/14taxbk.pdf.
[57] Children’s Action Alliance, “Highlights and Lowlights of the New State Budget,” March 11, 2015, http://azchildren.org/wp-content/uploads/2015/03/Final_AZ_Budget-3-11-15.pdf.
More from the Authors
Areas of Expertise