Most States Still Funding Schools Less Than Before the Recession
States are providing less per-pupil funding for kindergarten through 12th grade than they did seven years ago — often far less. The reduced levels reflect primarily the lingering effects of the 2007-09 recession. At a time when states and the nation need workers with the skills to master new technologies and adapt to the complexities of a global economy, this decline in state educational investment is cause for concern.
Our review of state budget documents finds that:
- At least 30 states are providing less funding per student for the 2014-15 school year than they did before the recession hit. Fourteen of these states have cut per-student funding by more than 10 percent. (These figures, like all the comparisons in this paper, are in inflation-adjusted dollars and focus on the primary form of state aid to local schools.)
- Most states are providing more funding per student in the new school year than they did a year ago, but funding has generally not increased enough to make up for cuts in past years. For example, Alabama is increasing school funding by $16 per pupil this year. But that is far less than is needed to offset the state’s $1,144 per-pupil cut over the previous six years.
Restoring school funding should be an urgent priority. Steep state-level K-12 spending cuts have serious consequences.
- State-level K-12 cuts have large consequences for local school districts. Some 46 percent of total education spending in the United States comes from state funds (the share varies by state).[2] As of the 2011-12 school year, 35 states had cut total state and local funding for schools per pupil since 2008, according to the latest Census Bureau data adjusted for inflation. (See Appendix Table 2.) Cuts at the state level mean that local school districts have to scale back the educational services they provide, raise more local tax revenue to cover the gap, or both.Image
- Local school districts are hard pressed to replace large reductions in state aid on their own.
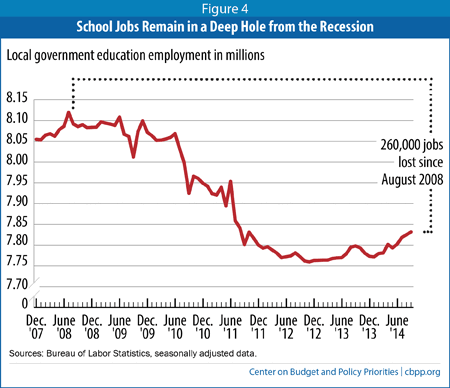
Property values fell sharply after the recession hit, making it difficult for local school districts to raise significant additional revenue through the property tax without raising rates, a politically challenging task even in good times. Property values have improved since then but remain below pre-recession levels nationally, and property tax revenue in most states has not yet fully captured the property value increases that have occurred.[3] - The cuts have slowed the economy’s recovery from the recession. Federal employment data show that school districts began cutting teachers and other employees in mid-2008, when the first round of budget cuts began taking effect.Image
By 2012, local school districts had cut about 330,000 jobs. Since then they’ve added back a portion of the jobs, but still are down 260,000 jobs compared with 2008.[4] These job losses have reduced the purchasing power of workers’ families, in turn reducing overall economic consumption, and thus slowed the pace of recovery. - The cuts undermine education reform and hinder school districts’ ability to deliver high-quality education, with long-term negative effects on the nation’s economic competitiveness. Many states and school districts have undertaken important school reform initiatives to prepare children better for the future, but deep funding cuts hamper their ability to implement many of these reforms. At a time when producing workers with high-level technical and analytical skills is increasingly important to a country’s prosperity, large cuts in funding for basic education threaten to undermine the nation’s economic future.
States Have Cut K-12 Schools’ Primary Funding Source
K-12 schools in every state rely heavily on state aid. On average, some 46 percent of total education expenditures in the United States come from state funds; the share varies by state.
States typically distribute most of this funding through formulas that allocate money to school districts. Each state uses its own formula. Many states, for instance, target at least some funds to districts that have higher levels of student need (e.g., more students from low-income families) and less ability to raise funds from local property taxes and other local revenues, although this targeting typically is insufficient to fully equalize educational expenditures across wealthy and poor school districts.[5]
This substantial reliance on state aid means that cuts to state formula funding generally force local school districts to scale back the educational services they provide, to raise more revenue to cover the gap, or both.
In addition to the funding they distribute through general aid formulas, states may or may not use separate allocations to fund items such as pupil transportation, contributions to school employee pension plans, and teacher training. Those allocations typically are smaller than general aid funding. (See Appendix Table 2 for trends in total state funding for schools, based on Census Bureau data available through the 2011-12 school year.)
For 47 states, the necessary data are available to compare this year’s allocations for the first category of funding, general formula funding, with funding before the recession hit.[6] The 47 states included in this analysis are home to 96 percent of the nation’s schoolchildren.
State K-12 Funding in the Current 2014-15 School Year Compared With 2007-08
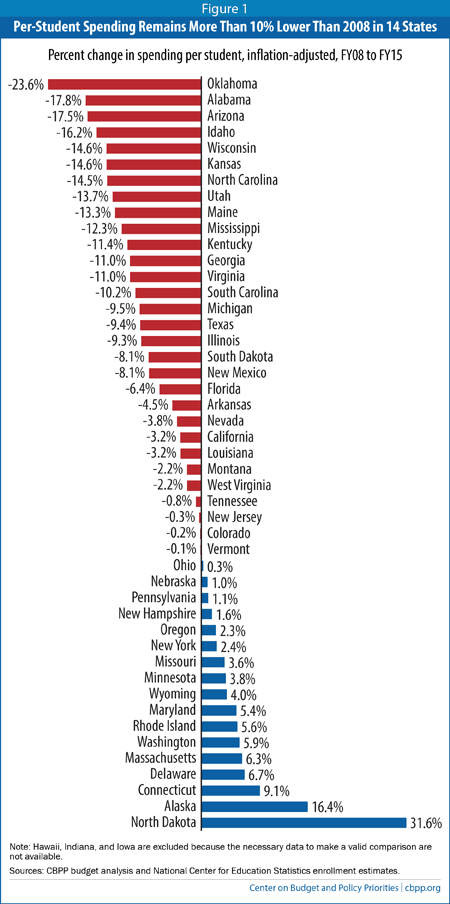
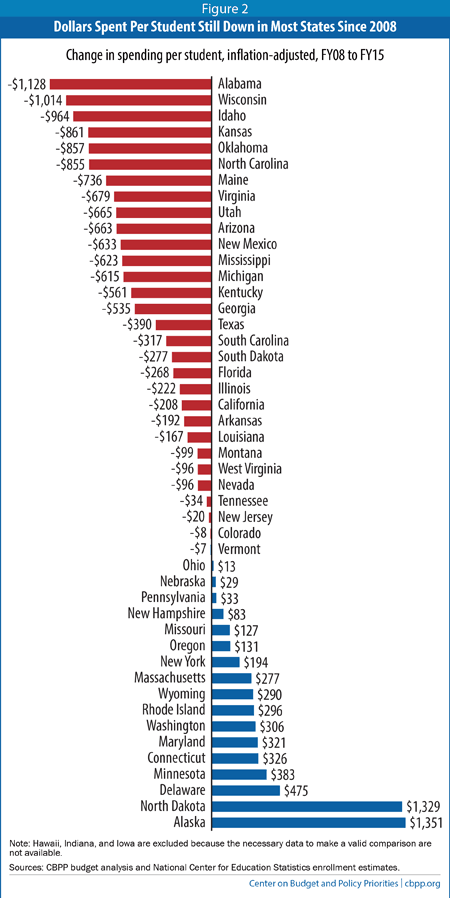
States made widespread and very deep cuts to education formula funding since the start of the recession, and those cuts linger in most states. (See Figures 1 and 2.) This survey finds that, after adjusting for inflation:
- More than 60 percent of states — 30 of the 47 states analyzed — are providing less per-student general aid for K-12 education in the current school year than they did in 2007-08.
- In 30 percent of states, or 14 of the 47 states analyzed, per-student funding is 10 percent or more below pre-recession levels.
- The four states with the deepest cuts — Oklahoma, Alabama, Arizona, and Idaho — each have reduced per-student funding by more than 15 percent from pre-recession levels.
School Funding in 2014-15 Compared With 2013-14
Most states increased their per-pupil school funding in the last year (see Appendix Table 1), but in most cases those increases were not enough to offset the funding cuts those states made in earlier years.
- In at least 27 states, per-student funding is higher in the current fiscal year (2015) than it was in the last fiscal year (2014), after adjusting for inflation.
- In 12 of those 27 states, per-student funding was above pre-recession levels even before this year’s increase. But among the other 15 states, only four increased funding for the current school year by enough to fully make up for cuts since the recession. For example, Alabama’s $16 per-pupil increase this year was far from enough to offset the state’s $1,144 per-pupil cut over the previous six years. New Mexico increased per-pupil funding by $124 in fiscal year 2015, an increase that pales in comparison to the $757 cut the state made between fiscal years 2008 and 2014.
- At least 20 states cut per-student funding this year. In most of these states, the cuts added to those the states had made in previous years, leaving them even further below pre-recession levels.[7]
Why Have States Cut Funding So Deeply?
States cut funding for K-12 education — and a range of other areas of spending, including higher education, health care, and human services — as a result of the 2007-09 recession, which caused state revenue to fall sharply. Emergency fiscal aid from the federal government initially helped prevent even deeper cuts, but it ran out before the economy recovered, and states chose to address their budget shortfalls disproportionately through spending reductions rather than a more balanced mix of service cuts and revenue increases. Cuts have been particularly deep when inflation and other cost pressures are considered.
- State revenues have barely returned to pre-recession levels. The recession of 2007-09 and the slow recovery continue to affect state budgets and schools. Unemployment has improved only slowly and housing values in much of the country remain below their pre-recession peak, leaving many people with both less income and less purchasing power. So state income and sales tax revenues ? the main sources of revenue states use to fund education and other services ? have not grown strongly enough to keep up with state needs. State tax revenues grew 3.5 percent in the 12-month period ending in March 2014. But they remain less than 1 percent above 2008 levels after adjusting for inflation.
- Costs are rising. The costs of state-funded services have increased since the recession, due to inflation, demographic changes, and rising needs. For example, in the current school year, the U.S. Department of Education estimates that there are about 725,000 more K-12 students and 3.2 million more public college and university students than there were in 2007-08.[8]Image
- States have largely avoided raising new revenues. States disproportionately relied on spending cuts to close the very large budget shortfalls they faced after the recession hit, rather than a more balanced mix of spending cuts and revenue increases. Between fiscal years 2008 and 2012, states closed 45 percent of their budget gaps through spending cuts and only 16 percent of their budget gaps through taxes and fees (they closed the remainder of their shortfalls with federal aid, reserves, and various other measures).[9] Not only did many states avoid raising new revenue after the recession hit, but recently some have enacted large tax cuts, further reducing state revenues.
- Federal aid to states has fallen. States used emergency fiscal relief from the federal government (including both education aid and other forms of state fiscal relief) to cover a significant share of their shortfalls through the 2011 fiscal year. After the 2011 fiscal year, the federal government largely allowed this aid to expire, even though states continued to face very large shortfalls in 2012 and beyond. The expiration of most federal aid at the end of the 2011 fiscal year is a key reason why state education funding dropped so sharply in the 2012 fiscal year and remains at low levels in many states.
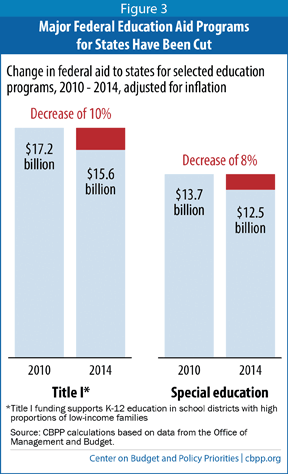
Adding to states’ struggles, federal policymakers have cut ongoing federal funding for states and localities, thereby worsening state fiscal conditions. For example, since 2010, federal spending for Title I — the major federal assistance program for high-poverty schools — is down 10 percent after adjusting for inflation, and federal spending on disabled education is down 8 percent.[10] These cuts include the automatic, across-the-board cuts known as sequestration and the additional cuts also resulting from the Budget Control Act of 2011. (See Figure 3.)
K-12 Education Cuts Have Serious Consequences
States’ large cuts in education spending have had serious consequences for the economy. Local school districts typically struggle to make up for major state funding cuts on their own. As a result, deep state funding cuts have led to job losses, deepening the recession and slowing the economy’s recovery. Such cuts also have counteracted and sometimes undermined important state education reform initiatives at a time when producing workers with high-level technical and analytical skills is increasingly important to the country’s prosperity.
Local School Districts Are Hard Pressed to Replace Large Reductions in State Funding
Property values fell sharply after the recession hit, making it difficult for local school districts to raise significant additional revenue through the property tax to make up for cuts in state funding.
Property values have improved since then but remain below pre-recession levels nationally. Further, property tax revenue in most states has not yet fully captured the property value increases that have occurred. (There’s generally a significant time lag between when home prices rise and when property tax assessments register the increase.)[11] Local school districts can pursue property tax rate increases, but those increases usually are politically difficult and sometimes legally restricted. For all these reasons, property tax revenue growth nationwide has been modest; revenues rose about 1.4 percent above inflation annually from the beginning of 2012 through the beginning of this year.[12]
Beyond increasing local revenues, school districts’ options for preserving investments in education services are very limited. Some localities could divert funds from other services to shore up school district budgets, but this would sustain education spending at the expense of other critical services like police and fire protection.
Undermining Education Reform
State education cuts have counteracted and sometimes undermined reform initiatives that many states are undertaking with the federal government’s encouragement, such as supporting professional development to improve teacher quality, improving interventions for young children to heighten school readiness, and turning around the lowest-achieving schools.
Deep cuts in state spending on education can limit or stymie education reform efforts by limiting the funds generally available to improve schools and by terminating or undercutting specific reform initiatives. Reforms endangered by funding cuts include:
- Recruiting better teachers. Research suggests that teacher quality is the most important school-based determinant of student success.[13] So recruiting, developing, and retaining high-quality teachers are essential to improving student achievement. These tasks are more difficult when school districts are cutting their budgets. Teacher salaries make up a large share of public education expenditures, so funding cuts inevitably restrict districts’ ability to expand teaching staffs and supplement wages.
- Trimming class size. Evidence suggests that smaller class sizes can boost achievement, especially in the early grades and for low-income students.[14] Yet, small class sizes are difficult to sustain when schools are cutting spending and enrollments are increasing. Kansas schools, for example, have 19,000 more students than they did in 2009, but 665 fewer teachers.[15]
- Expanding learning time. Many education policy experts believe that more student learning time can improve achievement.[16] Budget cuts make it more difficult to extend instructional opportunities, because extending learning time generally adds costs. Some states have even reduced student learning time, because of budget cuts. Arizona, for example, eliminated state funding for full-day kindergarten, to which some school districts have responded by offering only a half-day program or by requiring parents to pay a fee for a full-day one, likely reducing the number of children who are able to attend.[17]
- Providing high-quality early education. A number of studies conclude that pre-kindergarten or pre-school programs can improve cognitive skills, especially for disadvantaged children,[18] but most states cut funding for those programs after the recession hit. Of the 40 states that provide funding to preschools, 28 had reduced per-child funding as of the 2012-13 school year — often by large amounts.[19] (States typically support their preschool programs outside of their general K-12 “formula” funding, so these cuts come on top of those documented in this report.)
Damage to the Economy, Now and in the Future
State education budget cuts have slowed the pace of economic recovery by reducing overall economic activity since the recession officially ended in mid-2009. The spending cuts have caused school districts to lay off teachers and other employees, reduce pay for the education workers who remain, and cancel contracts with suppliers and other businesses. These steps remove consumer demand from the economy, which in turn discourages businesses from making new investments and hiring.
In the long term, the savings from today’s cuts may cost states much more in diminished economic growth. To prosper, businesses require a well-educated workforce. The deep education spending cuts states have enacted will weaken that future workforce by diminishing the quality of elementary and high schools. At a time when the nation is trying to produce workers with the skills to master new technologies and adapt to the complexities of a global economy, large cuts in funding for basic education undermine a crucial building block for future prosperity.
Appendix: Methodology
The education funding totals presented in this paper reflect the funding distributed through states’ major education funding formulas. The numbers do not include any local property tax revenue or any other source of local funding. For total state and local funding changes through the 2011-12 school year, see Appendix Table 2.
Additional adjustments were made to reflect the following state-specific policies or data limitations:
- California’s numbers reflect General Fund Proposition 98 spending for K-12 education. Since child care funding was removed from Proposition 98 spending in fiscal year 2012, it has been taken out of funding amounts for prior years to make them comparable.
- Maryland’s numbers include funding for the state’s foundation program as well as funding for compensatory education, aid for local employee fringe benefits, formula programs for specific populations, and limited English proficiency programs.
- Minnesota withholds a portion of state aid payments to school districts until the subsequent fiscal year. In some recent years, state legislators made changes to the education payment schedule as a way to balance the budget. The Minnesota figures for fiscal year 2014 have been adjusted to remove the impact of funding shifts to make the data comparable between fiscal years 2014 and 2015.
- New York’s numbers reflect school districts’ fiscal years (which end June 30), rather than the state’s fiscal year (which ends March 31).
- Ohio’s numbers include school district property tax replacement funds.
- South Carolina’s numbers include employer contributions to the Education Finance Act.
- In Vermont, school property taxes are state taxes and are deposited into a state Education Fund, which covers the cost of pre-K-to-12 public education. This state’s numbers represent the amount contributed to the Education Fund each year from a state General Fund appropriation and General Fund revenues dedicated to the Education Fund.
Finally, Hawaii, Indiana, and Iowa are excluded because the necessary data to make a valid comparison are not available.
|
Appendix Table 1
Most States Increased State General School Funding Per Student This Year |
||
|
Percent Change in Per Student Funding, Fiscal Year 2015 Compared With Fiscal Year 2014
|
Dollar Change in Per Student Funding,
Fiscal Year 2015 Compared With Fiscal Year 2014 |
|
| Alabama |
0.3%
|
$16
|
| Alaska |
6.3%
|
$564
|
| Arizona |
-0.8%
|
-$24
|
| Arkansas |
0.3%
|
$12
|
| California |
1.2%
|
$71
|
| Colorado |
6.2%
|
$260
|
| Connecticut |
1.1%
|
$43
|
| Delaware |
3.7%
|
$271
|
| Florida |
-1.6%
|
-$62
|
| Georgia |
2.3%
|
$97
|
| Idaho |
1.5%
|
$75
|
| Illinois |
-0.7%
|
-$16
|
| Kansas |
1.3%
|
$67
|
| Kentucky |
0.8%
|
$37
|
| Louisiana |
-1.2%
|
-$64
|
| Maine |
-2.1%
|
-$101
|
| Maryland |
-1.0%
|
-$66
|
| Massachusetts |
0.3%
|
$13
|
| Michigan |
-0.7%
|
-$38
|
| Minnesota |
2.8%
|
$290
|
| Mississippi |
1.5%
|
$66
|
| Missouri |
8.2%
|
$277
|
| Montana |
-1.4%
|
-$64
|
| Nebraska |
-0.1%
|
-$3
|
| Nevada |
-7.7%*
|
-$202*
|
| New Hampshire |
-1.5%
|
-$79
|
| New Jersey |
-1.4%
|
-$83
|
| New Mexico |
1.8%
|
$124
|
| New York |
3.0%
|
$242
|
| North Carolina |
-4.7%
|
-$250
|
| North Dakota |
2.4%
|
$131
|
| Ohio |
4.0%
|
$176
|
| Oklahoma |
-0.8%
|
-$21
|
| Oregon |
4.1%
|
$231
|
| Pennsylvania |
-2.2%
|
-$72
|
| Rhode Island |
1.8%
|
$99
|
| South Carolina |
6.2%
|
$163
|
| South Dakota |
0.6%
|
$19
|
| Tennessee |
-0.5%
|
-$19
|
| Texas |
0.5%
|
$19
|
| Utah |
-0.8%
|
-$34
|
| Vermont |
0.7%
|
$35
|
| Virginia |
0.4%
|
$20
|
| Washington |
2.7%
|
$144
|
| West Virginia |
-0.8%
|
-$36
|
| Wisconsin |
0.0%
|
-$3
|
| Wyoming |
-2.2%
|
-$172
|
| *Nevada’s cuts this year were offset by increases in local school funding. All figures are inflation-adjusted to fiscal year 2015. Hawaii, Indiana, and Iowa are excluded because the necessary data to make a valid comparison are not available. Sources: CBPP budget analysis and National Center for Education Statistics enrollment estimates. |
||
|
Appendix Table 2
In 35 States, Total State and Local Funding for K-12 Schools Per Student Declined From 2008 to 2012 |
|||
|
Change in total STATE-ONLY spending per student, FY08 – FY12
|
Change in total STATE & LOCAL spending per student, FY08 – FY12
|
||
| Alabama |
-21.2%
|
-16.0%
|
|
| Alaska |
-1.3%
|
0.1%
|
|
| Arizona |
-37.8%
|
-19.0%
|
|
| Arkansas |
2.1%
|
1.8%
|
|
| California |
-21.7%
|
-17.3%
|
|
| Colorado |
-4.2%
|
-7.4%
|
|
| Connecticut |
4.2%
|
4.8%
|
|
| Delaware |
-6.0%
|
-5.5%
|
|
| Florida |
-31.9%
|
-29.1%
|
|
| Georgia |
-18.9%
|
-16.4%
|
|
| Hawaii |
-8.1%
|
-9.0%
|
|
| Idaho |
-18.7%
|
-18.5%
|
|
| Illinois |
14.7%
|
11.0%
|
|
| Indiana |
32.8%
|
2.9%
|
|
| Iowa |
-1.0%
|
2.5%
|
|
| Kansas |
-9.5%
|
-7.4%
|
|
| Kentucky |
-7.2%
|
-5.0%
|
|
| Louisiana |
-1.5%
|
0.2%
|
|
| Maine |
-12.6%
|
-3.6%
|
|
| Maryland |
0.2%
|
-4.1%
|
|
| Massachusetts |
-4.1%
|
0.5%
|
|
| Michigan |
-3.7%
|
-3.7%
|
|
| Minnesota |
-4.0%
|
-1.3%
|
|
| Mississippi |
-14.0%
|
-7.9%
|
|
| Missouri |
1.3%
|
-1.7%
|
|
| Montana |
-7.3%
|
-4.5%
|
|
| Nebraska |
-3.9%
|
0.2%
|
|
| Nevada |
-10.4%
|
-16.3%
|
|
| New Hampshire |
-2.6%
|
3.0%
|
|
| New Jersey |
-4.5%
|
-0.5%
|
|
| New Mexico |
-12.8%
|
-10.3%
|
|
| New York |
-6.9%
|
6.0%
|
|
| North Carolina |
-13.4%
|
-19.7%
|
|
| North Dakota |
55.5%
|
13.0%
|
|
| Ohio |
-5.0%
|
-3.5%
|
|
| Oklahoma |
-12.8%
|
-11.6%
|
|
| Oregon |
-12.1%
|
-7.7%
|
|
| Pennsylvania |
3.4%
|
1.5%
|
|
| Rhode Island |
-9.3%
|
-3.0%
|
|
| South Carolina |
-15.4%
|
-7.7%
|
|
| South Dakota |
-11.4%
|
-4.7%
|
|
| Tennessee |
-2.9%
|
-4.3%
|
|
| Texas |
-12.6%
|
-7.6%
|
|
| Utah |
-14.7%
|
-7.2%
|
|
| Vermont |
0.9%
|
0.7%
|
|
| Virginia |
-14.9%
|
-11.0%
|
|
| Washington |
-7.4%
|
-2.9%
|
|
| West Virginia |
8.6%
|
23.9%
|
|
| Wisconsin |
-14.3%
|
-5.0%
|
|
| Wyoming |
-10.5%
|
-10.2%
|
|
| Note: All figures are inflation-adjusted to fiscal year 2012. Source: CBPP analysis of Census Bureau’s Survey of School System Finances |
|||
End Notes
[1] Virginia Andersen and Alison Miller gathered much of the data analyzed in this report.
[2] U.S. Census Bureau, Public Elementary-Secondary Education Finance Data, 2012 data, http://www.census.gov/govs/school/
[3] Recent research suggests it generally takes about three years for property tax revenues to reflect increased property values. See Byron F. Lutz, “The Connection Between House Price Appreciation and Property Tax Revenues,” Federal Reserve Board of Governors, September 12, 2008, http://www.federalreserve.gov/pubs/feds/2008/200848/200848pap.pdf.
[4] As of September 2014. Bureau of Labor Statistics, Current Employment Statistics, http://www.bls.gov/ces/.
[5] See Bruce Baker, David Sciarra, and Danielle Farrie, “Is School Funding Fair? A National Report Card, Third Edition,” Education Law Center, January 2014, http://www.schoolfundingfairness.org/; Richard Coley and Bruce Baker, “Poverty and Education: Finding the Way Forward,” ETS Center for Research on Human Capital and Education, July 2013, pp. 36-37, http://www.ets.org/s/research/pdf/poverty_and_education_report.pdf.
[6] For the remaining two states, Indiana and Hawaii, education funding data are published in ways that make it difficult to make accurate historical comparisons. The District of Columbia is excluded because it is a city that operates a single school district with no distinction between state and local funding. See appendix for more details about our methodology.
[7] In one of these states—Nevada—this year’s drop in state funding took place automatically, in response to an increase in local funding for schools. (The increase stems from higher property tax revenues due to rising housing prices and higher revenue from a local sales tax that helps fund schools.) While local funding for K-12 may have risen in some other states this year as state funding has fallen, it has not risen enough in most states to offset the very deep cuts many states have enacted since the recession hit.
[8] National Center for Education Statistics, Projections of Education Statistics to 2022, February 2014, Table 6; and Digest of Education Statistics: 2012, Table 224.
[9] CBPP calculations.
[10] CBPP analysis of data from the Office of Management and Budget.
[12] CBPP analysis of data from the U.S. Census Bureau’s Quarterly Summary of State and Local Taxes, extracted on September 22, 2014.
[13] See for example, “Empowering Effective Teachers: Readiness for Reform,” Bill and Melinda Gates Foundation Research Brief, February 2010, http://www.gatesfoundation.org/united-states/Documents/empowering-effective-teachers-readiness-for-reform.pdf.
[14] See Diane Whitmore Schanzenbach, “Does Class Size Matter?” National Education Policy Center, February 2014, http://nepc.colorado.edu/publication/does-class-size-matter. See also Matthew M. Chingos and Grover J. “Russ” Whitehurst, “What Research Says and What it Means for State Policy,” Brookings Institution, May 11, 2011, http://www.brookings.edu/research/papers/2011/05/11-class-size-whitehurst-chingos.
[15] Kansas Center for Economic Growth, “Quality at Risk: Impact of Education Cuts,” September 2014, http://realprosperityks.com/kac/wp-content/uploads/2014/09/KCEG-school-funding-report3.pdf.
[16] See for example, Center for American Progress, “Expanded Learning Time By the Numbers,” April 22, 2010, http://cdn.americanprogress.org/wp-content/uploads/issues/2010/04/pdf/elt_by_the_numbers.pdf.
[17] See for example, Paul Rhoden, “Local School Districts Return to Fee-Based, All-Day Kindergarten,” The Daily Courier, April 3, 2010, http://dcourier.com/main.asp?SectionID=1&SubsectionID=1086&ArticleID=79534.
[18] Julia Isaacs, “Research Brief #1: State Pre-Kindergarten,” Brookings Institution, September 2008, http://www.brookings.edu/~/media/research/files/papers/2008/9/early%20programs%20isaacs/09_early_programs_brief1.pdf.
[19] Authors’ count of funding cuts described in W. Steven Barnett et al., The State of Preschool 2013, National Institute for Early Education Research, p. 6, http://nieer.org/sites/nieer/files/yearbook2013.pdf.
[20] As of September 2014. Bureau of Labor Statistics, Current Employment Statistics, http://www.bls.gov/ces/.
More from the Authors