When and How States Should Strengthen Their Rainy Day Funds
| Table 1 Size of State General Fund Balances |
|||
| Size | FY2006 | FY2010 | FY2013 |
| 20%+ | 8 | 6 | 8 |
| 15% - 20% | 9 | 2 | 5 |
| 10% - 15% | 15 | 1 | 5 |
| 5% - 10% | 9 | 13 | 16 |
| 0% - 5% | 9 | 28 | 16 |
| Source: NASBO Fiscal Survey of the States | |||
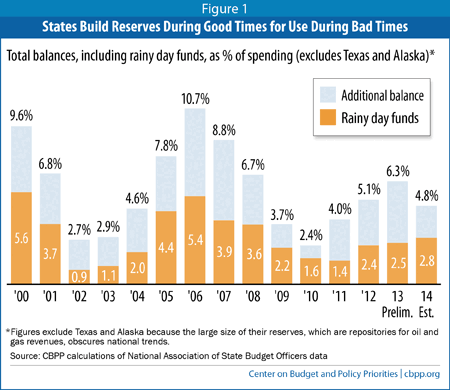
The last decade’s roller-coaster economy has highlighted the importance of rainy day funds. States used their funds to avert over $20 billion in cuts to services and/or tax increases in each of the last two recessions. But states would have weathered the storms better with bigger rainy day funds. States entered the most recent recession with their largest reserves[1] on record: close to 11 percent of state spending.[2] Yet these reserves filled only a modest share of states’ record-setting budget gaps in the deepest recession in 70 years.
Since draining reserves to a low of 2.4 percent of spending in state fiscal year 2010, states have begun to refill them partly — restoring on average one-third to one-half of what was lost. Reserves reached 6.3 percent of spending by the end of fiscal year 2013, and while they were expected to decline in 2014 (according to projections in state budgets adopted last year), as Figure 1 shows, recent reports of revenue collections exceeding projections suggest that this decline may not occur.
By the end of fiscal year 2013, 18 states had general fund reserves of more than 10 percent of the budget, up from nine states in 2010 but compared to 32 states in 2006. (See Tables 1 and 2.)
Several Factors Affect Decisions on Replenishing Funds
The decisions about when and how quickly to refill a rainy day fund will be different for each state. They depend on the fund’s current size, recent revenue trends, the state’s economic recovery, and other factors. Here are some questions that states should consider:
- Have tax collections recovered from the recession? One sign that a state has sufficient funds to begin refilling its rainy day fund is that both its annual tax collections and its annual growth in tax collections have returned to pre-recession levels, after accounting for inflation. Fewer than half of the states have recovered to this extent. In 32 states and the District of Columbia, tax collections grew faster in fiscal year 2013 than in the average year between 2001 and 2007, according to inflation-adjusted Census data. In only 23 states plus Washington, D.C., however, did tax collections for 2013 surpass their pre-recession (2007) level, adjusted for inflation. And this measure overstates the recovery, as it doesn’t take into account the growth in the number of students, elderly, and others that took place since 2007.
- Has the state’s economy recovered? A return to pre-recession unemployment rates and personal income indicates that the state’s economy is on the mend. Then the state can more likely meet the needs of its residents and also set funds aside for future downturns. Most state economies have not yet fully recovered from the downturn. Per capita personal income in 2013 remains below pre-recession levels in 20 states, according to Bureau of Economic Analysis data. The 2013 unemployment rate was below 2007 levels in only seven states.
- How big is the rainy day fund? Resuming fund deposits is a higher priority in states with little or no funds remaining. These states may want to spread the replenishment over more years so should consider beginning sooner. At the end of fiscal year 2013, 16 states had general fund reserves of less than 5 percent of the budget; only 13 states’ reserves exceeded 15 percent. (See Figure 2.)
- What else might states do with available funds? A rainy day fund’s ultimate goal is to help maintain state support for education, health care, transportation, and other services that promote economic growth and meet residents’ needs. If depositing money in the fund would jeopardize a state’s ability to support these programs adequately — especially after years of funding cuts in an economic downturn — program funding should take priority. Many states face this problem. For example, per-pupil funding for higher education remains below pre-recession levels in all but two states, when adjusted for inflation, and K-12 funding per pupil remained below pre-recession levels in at least 34 states as of the 2014 school year.[3] States may want to make a particular priority of investing in strategies to help families and communities that were hardest-hit by the recession and that have not yet recovered, such as work supports.
A number of states have considered using new revenue growth to cut taxes rather than replenish their rainy day fund. Proponents often claim that the tax cuts will improve economic growth, but there is little evidence to support this. In contrast, an adequate rainy day fund can help avert future cuts in programs that promote economic growth.[4] - Is the state experiencing a revenue “windfall”? Some states’ revenue collections are temporarily high as a result of a court settlement or other short-term reason. For example, Connecticut received $175 million this year from a temporary tax amnesty program, and Louisiana is receiving payments from BP as a result of the 2010 oil spill. Also, the past year’s rapid stock market growth resulted in unexpectedly high capital gains tax collections in some states, but those collections will weaken if the economy slows and the stock market slips. States should use caution when deciding how to spend these temporary windfalls. Shoring up a rainy day fund is a prudent use of one-time funds, while enacting ongoing program expansions or permanent tax cuts could contribute to future budget imbalances.
States Shouldn’t Wait to Improve Design of Rainy Day Funds
No matter when a state decides to replenish its reserves, now is a reasonable time for states to improve the design of their rainy day funds to remove barriers to adequate funding, since such improvements cost nothing. A 2011 CBPP report outlined the basic provisions of state rainy day funds and identified areas for improvement.[5] (See Table 3.) The downturn illustrated why improvements to the way states fund these reserves are important.
- Having a rainy day fund is critical. States with rainy day funds averted over $20 billion in cuts to services and/or tax increases in the recession of the early 2000s and again in this most recent recession. But four states — Colorado, Illinois, Kansas, and Montana — don’t have any designated rainy day funds. The budgets of all of these states except Montana were hit hard by the economic downturn, and the lack of a rainy day fund left them more vulnerable to the recession’s effects. States that lack a rainy day fund should consider enacting one. Arkansas was the most recent state to establish a fund.
- States should loosen overly restrictive caps on the size of rainy day funds. One reason rainy day funds weren’t even more effective in the most recent downturn is that 31 states and the District of Columbia cap them at inadequate levels, such as 10 percent of the budget or less.[6] This is not an adequate level for even a medium-sized recession. States with overly restrictive caps could either remove the cap or raise it to a more adequate level, such as 15 percent of the budget.
The appropriate size of a state’s rainy day fund depends in part on the potential volatility of the state’s revenues and economy. As the Pew Charitable Trusts has pointed out, states that depend heavily on more volatile revenue sources such as oil and gas taxes should consider higher caps in order to maintain a larger budget cushion.[7]
Since the recession, four states have raised their caps. Georgia, Oklahoma, and Virginia raised their caps from 10 percent to 15 percent; South Carolina raised its cap from 3 percent to 5 percent — still far too low, but a step in the right direction.Image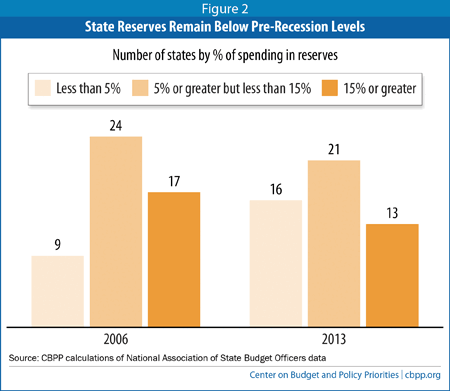
- States should ease rainy day fund rules that make it difficult to make deposits in good times. Most states place a low priority on replenishing their funds, depositing only whatever surpluses are left over at the end of the year. States could integrate rainy day fund transfers into the budget as part of an overall reserve policy that places a high priority on saving.
For example, in the wake of the last recession, Hawaii, Massachusetts, and Washington State made changes to improve prospects for replenishing the funds in the future. Hawaii, which had operated under a rule requiring the state to refund to taxpayers any general fund ending balance exceeding 5 percent of the budget, modified the rule to give lawmakers a choice between providing a tax refund and depositing the funds in the rainy day fund. Massachusetts established a requirement that any capital gains revenue collections over $1 billion annually go into the state’s reserves. Washington State voters approved a measure that requires that any “extraordinary” revenue growth (that is, growth that exceeds the five-year average by more than one-third) be deposited in the rainy day fund.
| Table 2 State Fund Balances FY2006 vs FY2013 (in millions) |
||||||||
| Rainy Day Fund Balance | Total General Fund Balance | |||||||
| FY2006 | FY2013 | FY2006 | FY2013 | |||||
| State | Amount | % of Spending | Amount | % of Spending | Amount | % of Spending | Amount | % of Spending |
| Alabama | 419 | 6.0% | 14 | 0.2% | 1,368 | 19.6% | 268 | 3.7% |
| Alaska | 2,267 | 69.8% | 17,067 | 219.3% | 2,267 | 69.8% | 16,933 | 217.6% |
| Arizona | 650 | 7.4% | 454 | 5.4% | 1,697 | 19.4% | 1,350 | 16.0% |
| Arkansas | 0 | 0.0% | 0 | 0.0% | 0 | 0.0% | 0 | 0.0% |
| California | 10,816 | 11.8% | 254 | 0.3% | 10,816 | 11.8% | 872 | 0.9% |
| Colorado | 0 | 0.0% | 373 | 4.7% | 909 | 14.1% | 1,483 | 18.8% |
| Connecticut | 1,113 | 7.6% | 271 | 1.4% | 1,560 | 10.7% | 670 | 3.5% |
| Delaware | 161 | 5.1% | 199 | 5.4% | 691 | 21.7% | 636 | 17.4% |
| Florida | 1,069 | 4.1% | 709 | 2.8% | 6,059 | 23.3% | 3,203 | 12.8% |
| Georgia | 793 | 4.5% | N/A | 2,017 | 11.3% | 680 | 3.7% | |
| Hawaii | 54 | 1.2% | 24 | 0.4% | 786 | 16.8% | 868 | 15.3% |
| Idaho | 109 | 4.9% | 50 | 1.9% | 411 | 18.5% | 110 | 4.1% |
| Illinois | 0 | 0.0% | 0 | 0.0% | 866 | 3.6% | 154 | 0.5% |
| Indiana | 328 | 2.7% | 370 | 2.6% | 739 | 6.2% | 1,798 | 12.6% |
| Iowa | 392 | 7.8% | 622 | 10.0% | 541 | 10.8% | 1,401 | 22.5% |
| Kansas | 0 | 0.0% | 0 | 0.0% | 734 | 14.3% | 588 | 9.5% |
| Kentucky | 119 | 1.4% | 122 | 1.3% | 800 | 9.5% | 244 | 2.6% |
| Louisiana | 681 | 8.8% | 443 | 5.4% | 1,508 | 19.5% | 443 | 5.4% |
| Maine | 80 | 2.8% | 60 | 1.9% | 94 | 3.3% | 67 | 2.2% |
| Maryland | 759 | 6.1% | 700 | 4.6% | 2,121 | 17.2% | 1,211 | 8.0% |
| Massachusetts | 2,155 | 8.4% | 1,557 | 4.6% | 3,208 | 12.5% | 1,874 | 5.5% |
| Michigan | 2 | 0.0% | 505 | 5.6% | 5 | 0.1% | 1,158 | 12.9% |
| Minnesota | 1,113 | 7.2% | 657 | 3.5% | 1,813 | 11.7% | 1,008 | 5.3% |
| Mississippi | 73 | 1.7% | 32 | 0.7% | 108 | 2.5% | 86 | 1.8% |
| Missouri | 247 | 3.5% | 277 | 3.5% | 942 | 13.2% | 723 | 9.0% |
| Montana | 0 | 0.0% | 0 | 0.0% | 422 | 26.9% | 537 | 26.9% |
| Nebraska | 274 | 9.4% | 384 | 10.7% | 840 | 28.8% | 1,199 | 33.4% |
| Nevada | 184 | 6.3% | 85 | 2.6% | 535 | 18.2% | 323 | 9.9% |
| New Hampshire | 69 | 5.2% | 9 | 0.7% | 95 | 7.1% | 86 | 6.8% |
| New Jersey | 560 | 2.0% | 0 | 0.0% | 1,779 | 6.3% | 465 | 1.5% |
| New Mexico | 798 | 14.7% | 571 | 9.8% | 798 | 14.7% | 571 | 9.8% |
| New York | 944 | 2.0% | 1,306 | 2.2% | 3,257 | 7.0% | 1,610 | 2.7% |
| North Carolina | 629 | 3.7% | 651 | 3.2% | 1,378 | 8.1% | 1,002 | 5.0% |
| North Dakota | 100 | 10.4% | 584 | 24.8% | 296 | 30.6% | 1,980 | 84.1% |
| Ohio | 1,011 | 4.1% | 482 | 1.7% | 1,643 | 6.6% | 2,760 | 9.8% |
| Oklahoma | 496 | 9.0% | 535 | 8.5% | 630 | 11.4% | 668 | 10.6% |
| Oregon | 622 | 10.2% | 69 | 1.0% | 627 | 10.3% | 542 | 8.0% |
| Pennsylvania | 512 | 2.1% | 0 | 0.0% | 1,026 | 4.2% | 541 | 2.0% |
| Rhode Island | 95 | 3.1% | 172 | 5.3% | 133 | 4.3% | 269 | 8.4% |
| South Carolina | 154 | 2.7% | 394 | 6.4% | 988 | 17.5% | 1,046 | 16.9% |
| South Dakota | 137 | 13.0% | 159 | 12.3% | 137 | 13.0% | 183 | 14.2% |
| Tennessee | 325 | 3.6% | 356 | 3.0% | 1,069 | 11.8% | 1,052 | 8.9% |
| Texas | 7 | 0.0% | 6,128 | 14.7% | 7,070 | 10.5% | 9,599 | 23.1% |
| Utah | 255 | 5.6% | 284 | 5.6% | 255 | 5.6% | 284 | 5.6% |
| Vermont | 52 | 4.7% | 63 | 4.8% | 52 | 4.7% | 63 | 4.8% |
| Virginia | 1,065 | 7.0% | 440 | 2.6% | 2,442 | 16.0% | 945 | 5.5% |
| Washington | 4 | 0.0% | 268 | 1.7% | 703 | 5.2% | 357 | 2.3% |
| West Virginia | 359 | 10.1% | 915 | 21.4% | 828 | 23.2% | 1,427 | 33.4% |
| Wisconsin | 0 | 0.0% | 0 | 0.0% | 49 | 0.4% | 759 | 5.3% |
| Wyoming | 446 | 35.9% | 884 | 53.1% | 456 | 36.7% | 884 | 53.1% |
| Total | 32,498 | 5.4% | 39,497 | 5.7% | 69,568 | 11.6% | 66,980 | 9.6% |
| minus TX/AK | 30,224 | 5.4% | 16,302 | 2.5% | 60,231 | 10.7% | 40,448 | 6.3% |
| Notes: Total General Fund Balance includes both the ending balance and balances in budget stabilization funds. Source: National Association of State Budget Officers "Fiscal Survey of the States, December 2007" and "Fiscal Survey of the States, December 2013." FY 2008 figures from the December 2009 NASBO report are used for Oregon in lieu of FY 2006, because this is when their rainy day fund came into being. |
||||||||
| TABLE 3 Summary of Rainy Day Fund Features to Be Reformed |
||||
| State | No RDF | Cap of less than 15% | Cap % | How is Rainy Day Fund Deposit Determined? |
| Alabama* | X | 10.0/20.0 | Required Budget Allocation/Year-End Surplus | |
| Alaska | no cap | See Deposit Rules | ||
| Arizona | X | 7 | Personal Income Growth Formula | |
| Arkansas | ||||
| California* | X | 5 | Required Budget Allocation | |
| Colorado | X | |||
| Connecticut | X | 10 | Year-End Surplus | |
| Delaware | X | 5 | Year-End Surplus | |
| District of Columbia* | X | 6 | Required Budget Allocation | |
| Florida | X | 10 | Required Budget Allocation | |
| Georgia | 15 | Year-End Surplus | ||
| Hawaii | X | 10 | Appropriation/Tobacco funds | |
| Idaho | X | 5 | See Deposit Rules | |
| Illinois | X | |||
| Indiana | X | 7 | Personal Income Growth Formula | |
| Iowa* | X | 10 | Year-End Surplus/Appropriation | |
| Kansas | X | |||
| Kentucky | X | 5 | Year-End Surplus | |
| Louisiana | X | 4 | Oil & Gas Revenue | |
| Maine | X | 12 | Year-End Surplus | |
| Maryland | X | 7.5 | Required Budget Allocation | |
| Massachusetts | 15 | Year-End Surplus/Required Budget Allocation/Capital Gains Taxes | ||
| Michigan | X | 10 | Personal Income Growth Formula | |
| Minnesota | goal (varies) | Allocation of Projected Surplus | ||
| Mississippi | X | 7.5 | Year-End Surplus | |
| Missouri | X | 7.5 | See Deposit Rules | |
| Montana | X | |||
| Nebraska | no cap | Year-end Surplus | ||
| Nevada | 20 | Year-end Surplus | ||
| New Hampshire | X | 10 | Year-end Surplus | |
| New Jersey | X | 5 | Year-end Surplus | |
| New Mexico | no cap | Year-end Surplus | ||
| New York* | X | 5 | See Deposit Rules | |
| North Carolina | goal (8.0) | Year-end Surplus | ||
| North Dakota | X | 9.5 | Year-end Surplus | |
| Ohio | X | 5 | Year-end Surplus | |
| Oklahoma | 15 | Year-end Surplus | ||
| Oregon* | X | 12.5 | Required Budget Allocation/Year-end Surplus/Lottery Revenue | |
| Pennsylvania | no cap | Year-end Surplus | ||
| Rhode Island | X | 5 | Required Budget Allocation | |
| South Carolina* | X | 5 | Year-end Surplus/Required Budget Allocation | |
| South Dakota | X | 10 | Year-end Surplus | |
| Tennessee | X | 5 | Required Budget Allocation | |
| Texas | X | 10 | Year-end Surplus/Appropriation/Oil & Gas Revenue | |
| Utah* | X | 6 | Year-end Surplus | |
| Vermont | X | 5 | Year-end Surplus/Appropriation | |
| Virginia | 15 | See Deposit Rules | ||
| Washington | X | 10 | Required Budget Allocation/Appropriation | |
| West Virginia | X | 10 | Year-end Surplus | |
| Wisconsin | X | 5 | Year-end Surplus | |
| Wyoming | no cap | Year-end Surplus | ||
|
Source: National Conference of State Legislatures survey updated by CBPP AK: Alaska has two rainy day funds. Neither the constitutional Budget Reserve Fund nor the statutory Budget Reserve Fund are capped. AL: Alabama has two rainy day funds. The Education Trust Fund is capped at 20% of education expenditures and the General Fund Trust Fund is capped at 10% of general fund expenditures. CA: California has two rainy day funds. The Budget Stabilization Account is capped at 5% and there is no statutory cap for the Special Fund for Economic Uncertainties. There will be a measure on the ballot in 2014 that would make significant RDF changes if passed. The RDF has a “soft” cap. Prop 58 required a certain level of general fund (GF) revenues to be transferred each year to the reserve — unless the transfer is suspended by the governor — until the balance of the reserve reaches the greater of $8 billion or 5% of GF revenues. At that point the transfers would not be required, although the Legislature could deposit additional GF revenues exceeding those levels if it wished to do so. CT: Any surplus funds must now be used to pay down Connecticut's 2009 Economic Recovery Notes through FY2017. D.C.: D.C. has two rainy day funds. The Emergency Cash Reserve Fund is capped at 2% and the Contingency Cash Reserve Fund is capped at 4%. IA: Iowa has two rainy day funds. The Cash Reserve Fund is capped at 7.5% and the Economic Emergency Fund is capped at 2.5%. 60% approval is needed if an appropriation will reduce the Cash Reserve Fund below 3.75% of adjusted revenue estimate. HI: Transfer of Tobacco Settlement funds to rainy day fund suspended for FY12 and FY13. LA: Federal money (largely from Hurricane Katrina relief) is pulled out before calculating the cap. Year-end surpluses and oil and gas revenue above a certain amount constitute rainy day fund deposits. MD: Transfers that would reduce the balance below 5.0% must be approved in legislation separate from the budget bill. MI: Personal income growth formula determines amount to be transferred to the rainy day fund; legislature has discretion in determining actual transfer amount. MN: The goal for the budget reserve is set annually as a percent of state revenues. ND: North Dakota has the only state-owned bank in the nation and uses its profits, along with the Rainy Day fund. NY: New York has two rainy day funds. The Tax Stabilization Reserve Fund is capped at 5% and the Rainy Day Reserve Fund is capped at 3%. OR: Oregon has two rainy day funds. The Rainy Day Fund created is capped at 5% and the Education Stability Fund is capped at 7.5%. SC: South Carolina has two rainy day funds. The General Reserve Fund has a floor of 3% and the Capital Reserve Fund has a floor of 2%. (Cap is currently phasing up to 5%.) UT: Utah has two rainy day funds. The General Fund Budget Reserve Account is capped at 6% of general fund expenditures and the Education Budget Reserve Account is capped at 7% of education fund expenditures. Even though the cap is 6%, that 6% limits any year-end transfers done by Finance. There is nothing in the law that would prevent the Legislature to appropriate money to the fund. The 6% does not cap the fund but only the year-end transfer. VA: Virginia's cap is applied to the average of sales and income tax revenues over the previous three fiscal years rather than spending. VT: Vermont has three funds known as stabilization funds (general, transportation, and education), and a “rainy day reserve” all capped at 5% of their respective appropriations. WA: Any “extraordinary” revenue growth will be transferred to the rainy day fund. WI: In each fiscal year, if actual general fund tax revenues exceed those projected revenues, 50% of the additional tax revenues are required to be transferred to the budget stabilization fund. Also, net proceeds from the sale of any surplus property are deposited in the budget stabilization fund. WY: Wyoming recently created an extra legislative stabilization account to offset volatile mineral reserve funds. This fund has no statutory role. |
||||
End Notes
[1] Reserves here refer to both the balance in rainy day funds and unrestricted general fund ending balances.
[2] In this paper, average figures and the graph exclude Alaska and Texas because these two states’ reserves are so much larger than other states’ — they made up close to half of total balances nationally in fiscal year 2010 — that including them would obscure the trends in typical states. The purpose of Alaska’s rainy day fund (called the Permanent Fund) is not typical of other states; a portion of oil company proceeds are deposited in the fund and paid out to residents to compensate for the use of the state’s oil reserves. The Texas fund is also a repository for oil- and gas-related revenues. High oil prices and expanded gas production resulted in large increases in the Texas fund at a time when most state reserves were shrinking.
[3] See Chris Mai and Michael Leachman, “Most States Funding Schools Less Than Before Recession,” Center on Budget and Policy Priorities, September 12, 2013, https://www.cbpp.org/cms/?fa=view&id=4011, and Phil Oliff, Vincent Palacios, Ingrid Johnson, and Michael Leachman, “Recent Deep State Higher Education Cuts May Harm Students and the Economy for Years to Come,” Center on Budget and Policy Priorities, March 19, 2013 https://www.cbpp.org/cms/?fa=view&id=3927.
[4] See Michael Leachman, Michael Mazerov, Vincent Palacios, and Chris Mai, “State Personal Income Tax Cuts: A Poor Strategy for Economic Growth,” Center on Budget and Policy Priorities, March 21, 2013, https://www.cbpp.org/cms/?fa=view&id=3936, and Michael Mazerov, “Academic Research Lacks Consensus on the Impact of State Tax Cuts on Economic Growth,” Center on Budget and Policy Priorities, June 17, 2013, https://www.cbpp.org/cms/?fa=view&id=3975.
[5] Elizabeth McNichol and Kwame Boadi, “Why and How States Should Strengthen Their Rainy Day Funds,” Center on Budget and Policy Priorities, February 3, 2011, https://www.cbpp.org/cms/?fa=view&id=3387.
[6] Alabama, Arizona, California, Connecticut, Delaware, Florida, Hawaii, Idaho, Indiana, Iowa, Kentucky, Louisiana, Maryland, Michigan, Mississippi, Missouri, New Hampshire, New Jersey, New York, North Dakota, Ohio, Rhode Island, South Carolina, South Dakota, Tennessee, Texas, Utah, Vermont, Washington, West Virginia, and Wisconsin.
[7] “Managing Uncertainty: How State Budgeting Can Smooth Revenue Volatility,” Pew Charitable Trusts, February 4, 2014, http://www.pewstates.org/uploadedFiles/PCS_Assets/2014/Volatility_Managing_Uncertainty.pdf.
More from the Authors