People Losing Medicaid Under House Republican Bill Would Face High Barriers to Coverage
Low-Income 60-Year-Olds in Most States Would Have to Spend More than Half of Their Income on Premiums
The American Health Care Act (AHCA), passed by the House on May 4, would effectively end the Affordable Care Act’s (ACA) Medicaid expansion, which has expanded coverage to 11 million low-income adults with incomes below 138 percent of the federal poverty line. Low-income adults would face out-of-pocket premiums too high for them to realistically afford coverage.Some Republican members of Congress have claimed that people losing Medicaid expansion coverage could purchase insurance in the individual market, with assistance from the House bill’s refundable tax credit.[1] But in reality, low-income adults — especially older people — would face out-of-pocket premiums (after accounting for their tax credits) too high for them to realistically afford coverage, and deductibles and other cost-sharing too high for them to realistically obtain needed care.
This paper examines the options people losing Medicaid under the House bill would face in the individual market. It focuses primarily on projected premiums in states that don’t take up the bill’s option to waive ACA protections for people with pre-existing conditions and ACA requirements for what health insurance plans must cover. As discussed below, the consequences for low-income adults with serious health needs in states that do waive these protections would be even more dire.
Among the hardships people would face, even in states that maintained the ACA’s consumer protections:
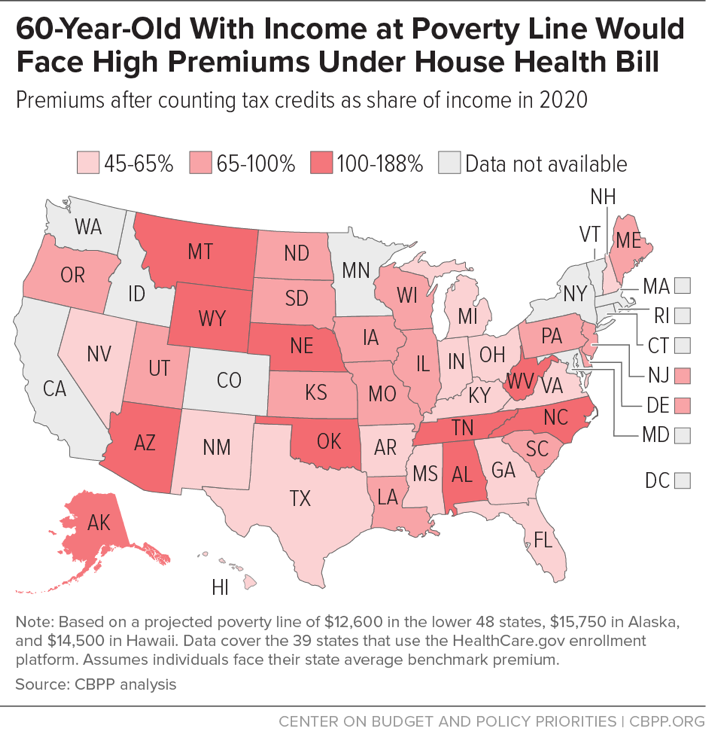
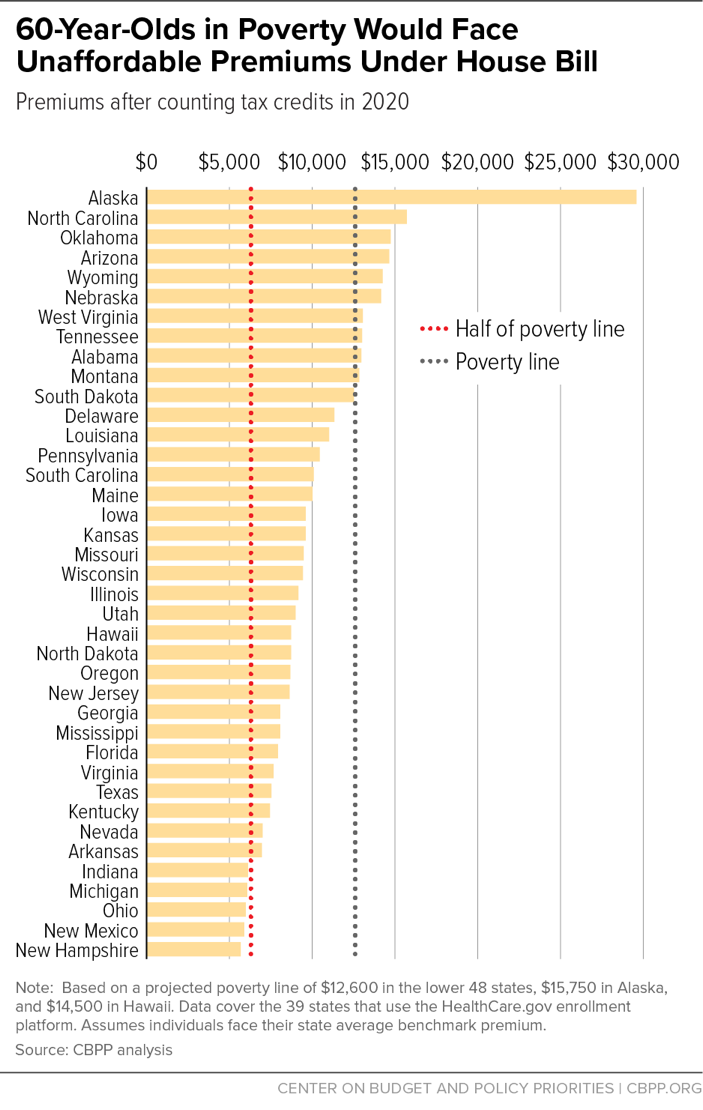
- For people age 60 or older with income at or below the poverty line, individual-market premiums would consume at least 45 percent of their income. The share would be even higher in higher-cost states and for people at lower incomes. In ten states, 60-year-olds with income at the poverty line would face premiums equal to or exceeding their income. And in all but five of the 39 states that use the HealthCare.gov platform, 60-year-olds with incomes at half of the poverty line would face premiums exceeding their incomes.
- For middle-aged people (age 45) with income at the poverty line, premiums would consume more than one-fifth of income in most states. For middle-aged people living at or below half of the poverty line, premiums would consume more than half of their income in 14 states.
- Even for younger people, who would fare the best under the House bill, premiums would still be unaffordable for many. In most states, premiums for a 30-year-old would exceed $100 a month, while in six states, they would exceed $200. It is not realistic to expect young people at this income — $1,050 per month for a single adult — to be able to afford these premiums.[2] As context, although most current marketplace enrollees with incomes between 100 and 250 percent of the poverty line pay less than $125 per month for premiums, the majority say their premiums are very difficult or somewhat difficult to afford.[3]
In practice, poor- and near-poor people would not be able to afford health insurance premiums at these levels, so the overwhelming majority of those losing Medicaid coverage under the House bill would become uninsured.
Moreover, even if they could somehow afford the high premiums for individual-market coverage, people losing Medicaid coverage would face high deductibles and other cost-sharing charges that would often make needed care unaffordable. The House bill would repeal –– with no replacement — the ACA’s cost-sharing reductions, which substantially reduce low-income people’s deductibles, copayments, and coinsurance, particularly for people with incomes just above the federal poverty line. It also makes other changes that the Congressional Budget Office (CBO) projects would result in higher deductibles.[4] Thus, even if poor- and near-poor people could afford premiums, they would face deductibles averaging more than $4,000, with no cost-sharing assistance.[5] For people with incomes at or below the poverty line, that would often present an insurmountable barrier to accessing care.
In states that eliminated or rolled back the ACA’s bar against insurers charging higher premiums based on health status or the requirement that insurers cover “essential health benefits,” net premiums for healthy people would be somewhat lower than outlined above. But many people who have gained coverage under the Medicaid expansion have chronic conditions or other serious health needs. For them, the situation could be even worse when they lose Medicaid’s guarantee of comprehensive coverage.
- CBO concluded that, under the House bill, states with half of the nation’s population would end requirements for plans to cover key services, such as mental health and substance abuse benefits.[6] Nearly 30 percent of the low-income adults eligible for coverage through the Medicaid expansion have a mental illness or substance use disorder.[7]
- CBO also found that states with one-sixth of the nation’s population would eliminate or sharply limit the ACA’s protection against basing premiums on health status and pre-existing conditions; in those states, CBO concluded, people with pre-existing conditions would face “extremely high” premiums, and many would not be able to purchase coverage at all. Individual markets in these states would be “similar to the nongroup market before the enactment of the ACA.” As discussed below, lower-income people have higher rates of heart disease, diabetes, stroke, and other chronic conditions that resulted in high premium surcharges and coverage denials before the ACA.
Thus, the premium estimates in this paper likely significantly understate the hardship that many low-income people with Medicaid expansion coverage would face in obtaining coverage under the House plan.
Analyzing the Impact of the House Plan
This paper estimates the House bill’s impact on total health care costs for people at and below the federal poverty line. The methodology is consistent with our prior analysis drawing on data from the Centers for Medicare & Medicaid Services (CMS), projections from CBO and the CMS Actuary, and CBO’s analysis of the House bill’s impact on premiums and plan generosity.[8] All examples for a given state assume consumers face the average benchmark premium in that state. For data availability reasons, we focus on impacts in the 39 states that use the HealthCare.gov enrollment platform. Of those 39 states, 21 expanded Medicaid coverage to adults with income under 138 percent of the poverty line.
By effectively ending the Medicaid expansion and converting Medicaid to a per capita cap or block grant, the House bill would cut federal Medicaid spending by $834 billion over ten years and lower Medicaid enrollment by 9 million by 2020 and by more than 14 million by 2026, relative to current law, CBO estimates.[9] The most immediate coverage loss would occur among Medicaid expansion enrollees — most of whom now pay no premium for Medicaid coverage that covers a comprehensive range of services and has no deductibles and modest cost-sharing.[10]
People with income at or above the poverty line who live in non-expansion states can now get coverage in the ACA marketplaces for premiums that are roughly 2 percent of their income. For those people, the House bill would replace the ACA’s flexible premium tax credit — which is based on an actual plan available to someone of the consumer’s age in the consumer’s geographic rating area — with a flat tax credit that varies only by age: $2,000 for people under 30, $2,500 for people age 30 to 39, $3,000 for people age 40 to 49, $3,500 for people age 50 to 59, and $4,000 for people age 60 and older. Tax credits would be the same regardless of the local cost of premiums and would generally be the same regardless of income (although they would phase out at higher income levels). Except for the minority of enrollees that have an offer of employer-sponsored coverage, former Medicaid enrollees would be eligible for the House tax credit. (Poor and near-poor individuals disproportionately work for employers that do not offer health coverage.)[11]
People with Poverty-Level Income Would Find It Hard to Afford Coverage
Overall, the House bill would put coverage out of reach for most people with income at or near the poverty line. It would virtually eliminate Medicaid coverage for the 11 million Medicaid expansion enrollees. And it would replace the premium tax credits used by 3.2 million people with income between 100 and 150 percent of the poverty line — who represent 35 percent of marketplace enrollment — with far less generous flat tax credits.[12]
For people age 60 or older with income at the poverty line, net premiums would consume at least 45 percent of their income in states that do not take up the community rating and essential health benefit waivers. This compares to 2 percent of their income under current law in states that did not expand Medicaid and usually no premium in expansion states. For example, in New Hampshire — the HealthCare.gov state with the lowest premiums and an expansion state — a 60-year-old with income at the poverty line would pay roughly $5,700 in premiums under the House bill, compared to no premium in Medicaid under current law. In higher-cost North Carolina (a non-expansion state), a 60-year-old with income at the poverty line would need to pay $15,714 in premiums — $3,100 more than her total income — for comparable health insurance, compared to only $264 under the ACA. (See Appendix Table 1.)
Older people in every state would see dramatic premium increases. In 34 of the 39 states that use HealthCare.gov, a 60-year-old with income at the poverty line would pay at least half of her income in premiums. In ten states, a 60-year-old with income at the poverty line would face premiums equal to or exceeding her total income, even after accounting for the maximum House tax credit of $4,000. (See Figure 1.)
For a middle-aged (45-year-old) person with income at the poverty line, premiums would consume more than one-fifth of her income in 22 of 39 states. In 12 of the 18 non-expansion states, her premiums would be at least ten times what she’d pay under current law for comprehensive coverage under the marketplace. People in Medicaid expansion states would be similarly harmed. For example, in West Virginia a 45-year-old now covered under the Medicaid expansion with no premium would pay premiums of nearly $4,300 — one-third of her income — under the House bill, after accounting for the House tax credit. (See Appendix Table 2.)
Even for younger people, who would fare the best under the House bill, premiums would be unaffordable for many. In all states using HealthCare.gov, a 30-year-old would pay more than under current law, and in six states, she would pay more than $2,400 ($200 per month) in premiums. To put this in perspective, 66 percent of marketplace enrollees with incomes under 250 percent of the poverty line now pay less than $125 per month for premiums, but the majority (52 percent) say their premiums are very or somewhat difficult to afford.[13] Younger people are especially price sensitive about health insurance. One survey found that 60 percent of young people (at all income levels) thought a monthly premium over $100 was unaffordable.[14] Under the House plan, 30-year-olds in 22 of 39 states would have premiums greater than $100 per month. (See Appendix Table 3.)
People in Poverty Would Have No Affordable Options
People living below the poverty line would be among those most harmed by the House bill. While the Medicaid expansion includes people with income up to 138 percent of the poverty line, most expansion enrollees are considerably poorer. For example, in Pennsylvania, 42 percent of Medicaid expansion enrollees reported their income as between zero and 50 percent of the poverty line.[15] For such enrollees, whose annual income is less than $6,300, virtually any premium is unaffordable. For example, a 45-year-old Pennsylvanian with income at 50 percent of the poverty line who pays no premium for Medicaid today would need to pay nearly $3,200 in premiums under the House plan, or more than half her income. In all but five of the 39 states that use the HealthCare.gov platform, 60-year-olds with incomes at half of the poverty line would face premiums exceeding their total income. (See Figure 2 and Appendix Table 4.)
In non-expansion states, people with income under the poverty line ostensibly benefit under the House plan because they would be eligible for the House bill’s tax credit. But in reality, coverage would remain out of reach for the vast majority of this group. Many people with income below the poverty line today fall into a “coverage gap”: their incomes are too high to qualify for Medicaid but too low to qualify for the ACA’s premium tax credit, which starts at the poverty line for most people. People in the coverage gap could get a tax credit under the House bill. But it would be woefully insufficient to purchase comprehensive coverage. For example, a 45-year-old in North Carolina who earns $6,300 (50 percent of the poverty line) would get a $3,000 tax credit under the House plan (instead of no credit today) but would face premiums of $8,400. Even after applying the tax credit, the premium would consume 86 percent of her income.
In practice, this means that coverage for people now in the coverage gap would remain out of reach under the House bill, while the bill would put coverage out of reach for those currently covered under the Medicaid expansion.
High Out-of-Pocket Costs Would Block Access to Needed Care
The loss of the ACA’s cost-sharing reduction means that even people who could somehow afford their premiums would face costs at the point of care — deductibles, copayments, and coinsurance — that would block access to needed services.
The House bill would increase consumers’ out-of-pocket costs in two ways:
- It would repeal (without replacing) the ACA’s cost-sharing subsidies, which reduce out-of-pocket costs for people with incomes below 250 percent of the poverty line. Under current law, people with income at or modestly above the poverty line are eligible for substantial cost-sharing assistance that raises the average plan’s actuarial value (the share of typical medical costs that the plan, rather than the consumer, pays for) from 70 percent to 94 percent.
- The House bill would effectively eliminate the ACA’s requirement that insurers offer consumers the choice of a lower-deductible plan. CBO projects that this change would lead many insurers to offer only high-deductible options. Specifically, CBO estimates that under the House bill, the average actuarial value of marketplace plans would fall to 65 percent from about 70 percent today.[16] That change would increase average out-of-pocket costs by several hundred dollars per marketplace consumer for comparable coverage.
Taken together, these changes would raise the average deductible to $4,100, the Kaiser Family Foundation estimates, meaning that people would need to pay $4,100 for health services before their insurance begins paying most claims.[17] That means that even if an individual with income at the poverty line were somehow able to afford her premium, she would then face a deductible equal to nearly one-third of her income.
Less Healthy Low-Income People Would Be Priced Out of the Insurance Market in Many States
These estimates do not account for the dramatically higher premiums and cost-sharing that people with preexisting conditions would face in states that adopt waivers of the ACA’s essential health benefit standards, which require plans to cover key services, and/or its community rating rules, which prohibit insurers from basing premiums on health status. Waiving community rating would result in surcharges that raise premiums by thousands of dollars for people with common conditions like asthma, diabetes, and depression.[18]
CBO predicts that states with half of the nation’s population would obtain a waiver to limit or eliminate community rating and the essential health benefits requirements.[19] In states with one-sixth of the U.S. population that entirely waive or sharply limit these core consumer protections, people with serious pre-existing conditions would face premiums so high as to put coverage out of reach for people at virtually any income level.[20] Moreover, as states eliminate or roll back essential health benefit requirements, people would see very large gaps in benefits and the return of annual and lifetime limits on particular services, sharply increasing their out-of-pocket costs. Some plans wouldn’t even cover major medical risks and “would not provide enough financial protection in the event of a serious and costly illness to be considered insurance,” CBO states.
In states with one-third of the nation’s population that make more “moderate” changes to consumer protections, premiums would fall for some, because plans would cover much less. The people most at risk would be those needing maternity care, mental health and substance use treatment, or expensive drugs. CBO explains that “out-of-pocket spending on maternity care and mental health and substance abuse services could increase by thousands of dollars in a given year for the nongroup enrollees who would use those services,” and “enrollees who use expensive drugs could see large increases in out-of-pocket spending.”
Waiving the core consumer protections would particularly harm low-income people, since they tend to report being in poorer health. Poor adults are five times likelier to report being in fair or poor health as higher-income people. Low-income people have higher rates of heart disease, diabetes, stroke, and other chronic conditions and are three times likelier than higher-income people to have activity limitations due to chronic illness than higher-income people.[21] The Ohio Department of Medicaid found that 27 percent of expansion enrollees had been diagnosed with at least one chronic medical condition and nearly one-third screened positive for depression or anxiety disorders. In addition, one-third had been diagnosed with substance abuse or dependence.[22] Thus, the premium estimates in this paper may significantly underestimate the hardship that many currently insured low-income people would face in obtaining coverage under the House plan.
| APPENDIX TABLE 1 | |||||||||
|---|---|---|---|---|---|---|---|---|---|
| Premiums and Share of Income for a Person Purchasing Health Coverage Under the Republican Plan (American Health Care Act, AHCA) For a 60-year-old with income at the poverty line, 2020a |
|||||||||
| States | Net AHCA Premium | AHCA Premium as Share of Income | Affordable Care Act Premium as Share of Incomeb | ||||||
| Alabama | $12,974 | 103% | 2% | ||||||
| Alaska | 29,593 | 188% | 0% | ||||||
| Arizona | 14,653 | 116% | 2%c | ||||||
| Arkansas | 6,962 | 55% | 2%c | ||||||
| Delaware | 11,338 | 90% | 0% | ||||||
| Florida | 7,935 | 63% | 2% | ||||||
| Georgia | 8,067 | 64% | 2% | ||||||
| Hawaii | 8,730 | 60% | 0% | ||||||
| Illinois | 9,172 | 73% | 0% | ||||||
| Indiana | 6,122 | 49% | 2%c | ||||||
| Iowa | 9,614 | 76% | 0%c | ||||||
| Kansas | 9,614 | 76% | 2% | ||||||
| Kentucky | 7,448 | 59% | 0% | ||||||
| Louisiana | 11,029 | 88% | 0% | ||||||
| Maine | 10,012 | 79% | 2% | ||||||
| Michigan | 6,078 | 48% | 0%c | ||||||
| Mississippi | 8,067 | 64% | 2% | ||||||
| Missouri | 9,482 | 75% | 2% | ||||||
| Montana | 12,841 | 102% | 2%c | ||||||
| Nebraska | 14,167 | 112% | 2% | ||||||
| Nevada | 7,006 | 56% | 0% | ||||||
| New Hampshire | 5,680 | 45% | 0%c | ||||||
| New Jersey | 8,642 | 69% | 0% | ||||||
| New Mexico | 5,901 | 47% | 0% | ||||||
| North Carolina | 15,714 | 125% | 2% | ||||||
| North Dakota | 8,730 | 69% | 0% | ||||||
| Ohio | 5,990 | 48% | 0% | ||||||
| Oklahoma | 14,742 | 117% | 2% | ||||||
| Oregon | 8,686 | 69% | 0% | ||||||
| Pennsylvania | 10,454 | 83% | 0% | ||||||
| South Carolina | 10,100 | 80% | 2% | ||||||
| South Dakota | 12,531 | 99% | 2% | ||||||
| Tennessee | 13,018 | 103% | 2% | ||||||
| Texas | 7,537 | 60% | 2% | ||||||
| Utah | 8,995 | 71% | 2% | ||||||
| Virginia | 7,669 | 61% | 2% | ||||||
| West Virginia | 13,062 | 104% | 0% | ||||||
| Wisconsin | 9,437 | 75% | 2% | ||||||
| Wyoming | 14,255 | 113% | 2% | ||||||
| APPENDIX TABLE 2 | |||||||||
|---|---|---|---|---|---|---|---|---|---|
| Premiums and Share of Income for a Person Purchasing Health Coverage Under the Republican Plan (American Health Care Act, AHCA) For a 45-year-old with income at the poverty line, 2020a |
|||||||||
| States | Net AHCA Premium | AHCA Premium as Share of Income | Affordable Care Act Premium as Share of Incomeb | ||||||
| Alabama | $4,237 | 34% | 2% | ||||||
| Alaska | 11,323 | 72% | 0% | ||||||
| Arizona | 4,953 | 39% | 2%c | ||||||
| Arkansas | 1,674 | 13% | 2%c | ||||||
| Delaware | 3,540 | 28% | 0% | ||||||
| Florida | 2,089 | 17% | 2% | ||||||
| Georgia | 2,145 | 17% | 2% | ||||||
| Hawaii | 2,428 | 17% | 0% | ||||||
| Illinois | 2,616 | 21% | 0% | ||||||
| Indiana | 1,316 | 10% | 2%c | ||||||
| Iowa | 2,805 | 22% | 0%c | ||||||
| Kansas | 2,805 | 22% | 2% | ||||||
| Kentucky | 1,881 | 15% | 0% | ||||||
| Louisiana | 3,408 | 27% | 0% | ||||||
| Maine | 2,974 | 24% | 2% | ||||||
| Michigan | 1,297 | 10% | 0%c | ||||||
| Mississippi | 2,145 | 17% | 2% | ||||||
| Missouri | 2,748 | 22% | 2% | ||||||
| Montana | 4,181 | 33% | 2%c | ||||||
| Nebraska | 4,746 | 38% | 2% | ||||||
| Nevada | 1,693 | 13% | 0% | ||||||
| New Hampshire | 1,127 | 9% | 0%c | ||||||
| New Jersey | 2,390 | 19% | 0% | ||||||
| New Mexico | 1,222 | 10% | 0% | ||||||
| North Carolina | 5,406 | 43% | 2% | ||||||
| North Dakota | 2,428 | 19% | 0% | ||||||
| Ohio | 1,259 | 10% | 0% | ||||||
| Oklahoma | 4,991 | 40% | 2% | ||||||
| Oregon | 2,409 | 19% | 0% | ||||||
| Pennsylvania | 3,163 | 25% | 0% | ||||||
| South Carolina | 3,012 | 24% | 2% | ||||||
| South Dakota | 4,049 | 32% | 2% | ||||||
| Tennessee | 4,256 | 34% | 2% | ||||||
| Texas | 1,919 | 15% | 2% | ||||||
| Utah | 2,541 | 20% | 2% | ||||||
| Virginia | 1,976 | 16% | 2% | ||||||
| West Virginia | 4,275 | 34% | 0% | ||||||
| Wisconsin | 2,729 | 22% | 2% | ||||||
| Wyoming | 4,784 | 38% | 2% | ||||||
| APPENDIX TABLE 3 | |||||||||
|---|---|---|---|---|---|---|---|---|---|
| Premiums and Share of Income for a Person Purchasing Health Coverage Under the Republican Plan (American Health Care Act, AHCA) For a 30-year-old with income at the poverty line, 2020a |
|||||||||
| States | Net AHCA Premium | AHCA Premium as Share of Income | Affordable Care Act Premium as Share of Incomeb | ||||||
| Alabama | $2,368 | 19% | 2% | ||||||
| Alaska | 7,135 | 45% | 0% | ||||||
| Arizona | 2,850 | 23% | 2%c | ||||||
| Arkansas | 644 | 5% | 2%c | ||||||
| Delaware | 1,899 | 15% | 0% | ||||||
| Florida | 923 | 7% | 2% | ||||||
| Georgia | 961 | 8% | 2% | ||||||
| Hawaii | 1,151 | 8% | 0% | ||||||
| Illinois | 1,278 | 10% | 0% | ||||||
| Indiana | 403 | 3% | 2%c | ||||||
| Iowa | 1,405 | 11% | 0%c | ||||||
| Kansas | 1,405 | 11% | 2% | ||||||
| Kentucky | 783 | 6% | 0% | ||||||
| Louisiana | 1,810 | 14% | 0% | ||||||
| Maine | 1,519 | 12% | 2% | ||||||
| Michigan | 390 | 3% | 0%c | ||||||
| Mississippi | 961 | 8% | 2% | ||||||
| Missouri | 1,367 | 11% | 2% | ||||||
| Montana | 2,330 | 19% | 2%c | ||||||
| Nebraska | 2,710 | 22% | 2% | ||||||
| Nevada | 657 | 5% | 0% | ||||||
| New Hampshire | 276 | 2% | 0%c | ||||||
| New Jersey | 1,126 | 9% | 0% | ||||||
| New Mexico | 340 | 3% | 0% | ||||||
| North Carolina | 3,154 | 25% | 2% | ||||||
| North Dakota | 1,151 | 9% | 0% | ||||||
| Ohio | 365 | 3% | 0% | ||||||
| Oklahoma | 2,875 | 23% | 2% | ||||||
| Oregon | 1,138 | 9% | 0% | ||||||
| Pennsylvania | 1,646 | 13% | 0% | ||||||
| South Carolina | 1,544 | 12% | 2% | ||||||
| South Dakota | 2,241 | 18% | 2% | ||||||
| Tennessee | 2,381 | 19% | 2% | ||||||
| Texas | 809 | 6% | 2% | ||||||
| Utah | 1,227 | 10% | 2% | ||||||
| Virginia | 847 | 7% | 2% | ||||||
| West Virginia | 2,394 | 19% | 0% | ||||||
| Wisconsin | 1,354 | 11% | 2% | ||||||
| Wyoming | 2,736 | 22% | 2% | ||||||
| APPENDIX TABLE 4 | |||||||||
|---|---|---|---|---|---|---|---|---|---|
| Percentage of Income a Person Would Spend on Health Coverage Under the Republican Plan (American Health Care Act, AHCA) For a person with income at 50 percent of the poverty line by age, 2020 |
|||||||||
| States | 60-year-old | 45-year-old | 30-year-old | ||||||
| Alabama | 206% | 67% | 38% | ||||||
| Alaska | 376% | 144% | 91% | ||||||
| Arizona | 233% | 79% | 45% | ||||||
| Arkansas | 111% | 27% | 10% | ||||||
| Delaware | 180% | 56% | 30% | ||||||
| Florida | 126% | 33% | 15% | ||||||
| Georgia | 128% | 34% | 15% | ||||||
| Hawaii | 120% | 34% | 16% | ||||||
| Illinois | 146% | 42% | 20% | ||||||
| Indiana | 97% | 21% | 6% | ||||||
| Iowa | 153% | 45% | 22% | ||||||
| Kansas | 153% | 45% | 22% | ||||||
| Kentucky | 118% | 30% | 12% | ||||||
| Louisiana | 175% | 54% | 29% | ||||||
| Maine | 159% | 47% | 24% | ||||||
| Michigan | 97% | 21% | 6% | ||||||
| Mississippi | 128% | 34% | 15% | ||||||
| Missouri | 151% | 44% | 22% | ||||||
| Montana | 204% | 66% | 37% | ||||||
| Nebraska | 225% | 75% | 43% | ||||||
| Nevada | 111% | 27% | 10% | ||||||
| New Hampshire | 90% | 18% | 4% | ||||||
| New Jersey | 137% | 38% | 18% | ||||||
| New Mexico | 94% | 19% | 5% | ||||||
| North Carolina | 250% | 86% | 50% | ||||||
| North Dakota | 139% | 39% | 18% | ||||||
| Ohio | 95% | 20% | 6% | ||||||
| Oklahoma | 234% | 79% | 46% | ||||||
| Oregon | 138% | 38% | 18% | ||||||
| Pennsylvania | 166% | 50% | 26% | ||||||
| South Carolina | 160% | 48% | 25% | ||||||
| South Dakota | 199% | 64% | 36% | ||||||
| Tennessee | 207% | 68% | 38% | ||||||
| Texas | 120% | 30% | 13% | ||||||
| Utah | 143% | 40% | 19% | ||||||
| Virginia | 122% | 31% | 13% | ||||||
| West Virginia | 207% | 68% | 38% | ||||||
| Wisconsin | 150% | 43% | 22% | ||||||
| Wyoming | 226% | 76% | 43% | ||||||
End Notes
[1] For example, Representative Amodei of Nevada said in a statement that “tax credits paid in advance … ensure those recently leaving Medicaid can have access to insurance on the private market.” Representative Mark Amodei, “Amid Political Semantics, Amodei Analyzes the American Health Care Act,” Press Statement, May 4, 2017, https://amodei.house.gov/news-releases/amid-political-semantics-amodei-analyzes-the-american-health-care-act/.
[2] In the lower 48 states, the federal poverty line is estimated to be approximately $12,600 for a household of one in 2019, the figure used to determine 2020 premium tax credit eligibility. The poverty line will be approximately $15,750 in Alaska and $14,500 in Hawaii.
[3] “More Adults with Marketplace or Medicaid Coverage Continue to be Satisfied with Their Health Insurance, But Many Remain Uninsured,” Commonwealth Fund, ACA Tracking Survey for February-April 2016, acatracking.commonwealthfund.org. In addition, a 2016 survey by HealthPocket found that 52.5 percent of people surveyed felt premiums of more than $100 per month were unaffordable. Sixty percent of people between ages 18 and 34 shared that view. See HealthPocket, “For More than Half of U.S., $100 or Less Remains the Maximum Most Americans Can Pay for Health Insurance Premiums,” November 7, 2016, https://www.healthpocket.com/healthcare-research/surveys/2017-survey-health-insurance-premium-affordability#.WC9QrEwrKHs.
[4] Congressional Budget Office, “Cost Estimate for the American Health Care Act,” March 13, 2017, https://www.cbo.gov/system/files/115th-congress-2017-2018/costestimate/americanhealthcareact.pdf.
[5] Drew Altman, “Why Deductibles Would Rise Under the GOP Health Care Plan,” Kaiser Family Foundation, March 22, 2017, http://kff.org/health-reform/perspective/why-deductibles-would-rise-under-the-gop-health-care-plan/.
[6] Except where otherwise noted, all references to CBO estimates and analysis refer to Congressional Budget Office, “H.R. 1628, American Health Care Act of 2017,” May 24, 2017, https://www.cbo.gov/system/files/115th-congress-2017-2018/costestimate/hr1628aspassed.pdf.
[7] Judith Dey et al., “Benefits of Medicaid Expansion for Behavioral Health,” Department of Health and Human Services Assistant Secretary for Planning and Evaluation, March 28, 2016, https://aspe.hhs.gov/system/files/pdf/190506/BHMedicaidExpansion.pdf.
[8] For a complete description of our methodology, see Aviva Aron-Dine and Tara Straw, “House GOP Health Bill Still Cuts Tax Credits, Raises Costs by Thousands of Dollars for Millions of People,” Center on Budget and Policy Priorities, March 22, 2017, https://www.cbpp.org/research/health/house-gop-health-bill-still-cuts-tax-credits-raises-costs-by-thousands-of-dollars. These estimates rely on CBO’s March estimates of the American Health Care Act. In its most recent estimate of the House-passed version of the bill, CBO noted, “For the half of the population in states that would not request waivers, the effects that CBO and JCT [the Joint Committee on Taxation] estimate for the House-passed version are similar to those in the prior estimates.” If anything, comparing the examples in Tables 4 and 5 of the March and May CBO analyses suggests that premium estimates based on the most recent CBO score might be slightly higher than those shown here.
[9] CBO, May 24, 2017.
[10] Matt Broaddus and Edwin Park, “House Republican Health Bill Would Effectively End ACA Medicaid Expansion,” Center on Budget and Policy Priorities, June 6, 2017, https://www.cbpp.org/research/health/house-republican-health-bill-would-effectively-end-aca-medicaid-expansion.
[11] In 2014, according to the Kaiser Family Foundation, 30 percent of people with income under 100 percent of the poverty line had an employer offer of coverage, but only 12 percent enrolled, presumably because many found coverage hard to afford or had a more affordable offer, such as Medicaid. Any offer of employer-based coverage — even an unaffordable one — would disqualify a low-income person from the House tax credit. Michelle Long et al., “Trends in Employer-Sponsored Insurance Offer and Coverage Rates, 1999-2014,” Kaiser Family Foundation, March 21, 2016, http://kff.org/private-insurance/issue-brief/trends-in-employer-sponsored-insurance-offer-and-coverage-rates-1999-2014/.
[12] Centers for Medicare & Medicaid Services, 2017 Marketplace Open Enrollment Period State-Level Public Use File, May 11, 2017, https://www.cms.gov/Research-Statistics-Data-and-Systems/Statistics-Trends-and-Reports/Marketplace-Products/Plan_Selection_ZIP.html.
[13] Commonwealth Fund.
[14] HealthPocket.
[15] Pennsylvania Department of Human Services, “Medicaid Expansion Report,” January 27, 2017, http://www.dhs.pa.gov/cs/groups/webcontent/documents/document/c_257436.pdf.
[16] CBO, March 13, 2017. While CBO’s May 24 cost estimate of the revised version of the bill does not explicitly comment on its impact on deductibles, this provision remains the same as in the earlier version of the bill and should have the same effect as CBO previously estimated (in states that do not take up waivers of community rating or essential health benefits).
[17] Altman.
[18] Sam Berger and Emily Gee, “Latest ACA Repeal Plan Would Explode Premiums for People with Pre-Existing Conditions,” Center for American Progress, April 20, 2017, https://www.americanprogress.org/issues/healthcare/news/2017/04/20/430858/latest-aca-repeal-plan-explode-premiums-people-pre-existing-conditions/.
[19] CBO, May 24, 2017.
[20] Jacob Leibenluft, Aviva Aron-Dine, and Edwin Park, “CBO Continues to Show Million Would Pay More for Less Under House Republican Health Bill,” Center on Budget and Policy Priorities, May 25, 2017, https://www.cbpp.org/research/health/cbo-continues-to-show-millions-would-pay-more-for-less-under-house-republican-health.
[21] Steven H. Woolf et al., “How are Income and Wealth Linked to Health and Longevity?” Urban Institute and VCU Center on Society and Health, April 2015, http://www.urban.org/sites/default/files/publication/49116/2000178-How-are-Income-and-Wealth-Linked-to-Health-and-Longevity.pdf.
[22] Ohio Department of Medicaid, “Ohio Medicaid Group VIII Assessment: A Report to the Ohio General Assembly,” January 15, 2017, http://medicaid.ohio.gov/portals/0/resources/reports/annual/group-viii-assessment.pdf.
More from the Authors