Affordable Care Act Has Produced Historic Gains in Health Coverage
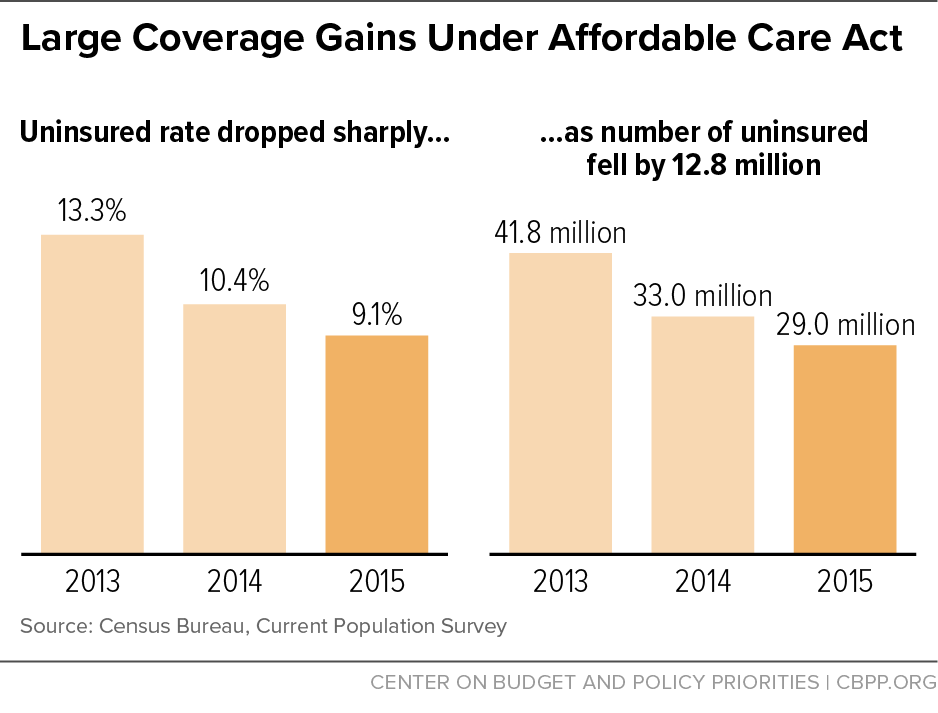
All groups in the nation have made historic gains in health insurance coverage since the Affordable Care Act’s major coverage expansions took effect. All groups in the nation have made historic gains in health insurance coverage since the Affordable Care Act’s (ACA) major coverage expansions took effect in 2014. The uninsured rate fell from 13.3 percent to 9.1 percent between 2013 and 2015, while the number of uninsured fell from 41.8 million to 29.0 million — a drop of 12.8 million. (See Figure 1.) Both private and public coverage expanded, and the uninsured rate fell among all demographic groups that the Census data cover, in many cases by more than one-third. Congressional Republican plans to repeal the ACA would eliminate nearly all of these coverage gains, causing millions of Americans to become uninsured. Republican leaders have stated that they will offer a plan to replace the ACA but have yet to agree on one and do not intend to offer one to accompany ACA repeal.
This report reviews the progress in reducing the number of uninsured Americans since the ACA’s major coverage provisions took effect. A recent Urban Institute report models the future impact of partially repealing the ACA, as under a bill similar to the reconciliation bill that President Obama vetoed in 2016.[1] The Urban Institute finds that in 2019, the number of uninsured would rise by nearly 30 million (and more than double), relative to current law. Together, these reports show the ACA’s critical value in reducing the ranks of the uninsured.
Number of Uninsured Fell by Nearly 13 Million by 2015
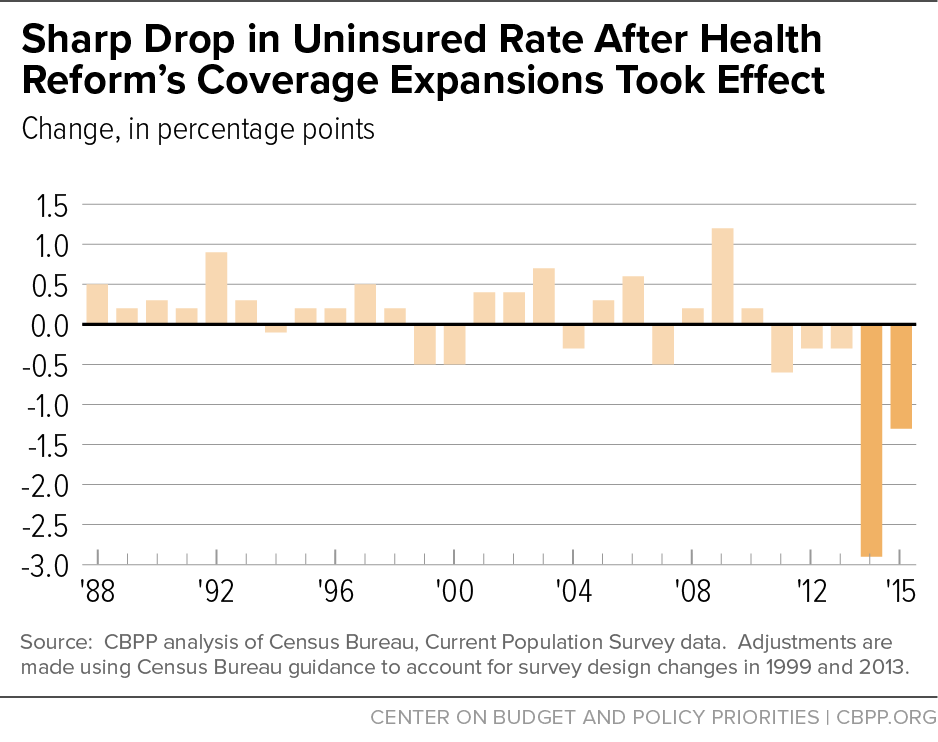
Starting on January 1, 2014, the ACA gave states the option to expand Medicaid to more low-income adults and established subsidies for low- and moderate-income families to buy private coverage through health insurance marketplaces. Subsequently, the uninsured rate fell by 2.9 percentage points in 2014 and by another 1.3 percentage points in 2015, according to Census Bureau data[2] — by far the two greatest single-year declines on record since these data were first collected in 1987.[3] (See Figure 2.) Nearly 13 million fewer people were uninsured in 2015 than 2013.
Moreover, these figures don’t account for additional coverage gains before 2014 related to other ACA provisions, namely its extension of employer coverage to dependents up to age 26 and some states’ early implementation of the Medicaid expansion.
Congressional Republican plans to repeal the ACA, like the bill that President Obama vetoed in January 2016, would eliminate subsidized marketplace coverage and state Medicaid expansions after two years.[4] People who have gained coverage under these provisions would once again become uninsured.
In addition, the vetoed repeal bill, while repealing the marketplace subsidies and eliminating the individual mandate immediately, would have retained health reform’s market reforms, such as those that bar insurers from denying coverage to people with pre-existing conditions or charging them higher premiums in the individual market. As the Congressional Budget Office has warned, that could destabilize the overall individual market by encouraging people to wait until they became sick to get coverage, making the pool of people with coverage sicker on average and thereby driving up premiums to levels that many people couldn’t afford.[5] And according to the Urban Institute estimates, the individual market would virtually collapse, with enrollment in the individual market inside and outside the marketplaces falling by 92 percent, relative to current law. That would make an additional 7.3 million people uninsured in 2019, on top of the 22.5 million people losing coverage due to repeal of the marketplace subsidies, Medicaid expansion, and individual mandate.[6]
Both Private and Public Coverage Have Expanded
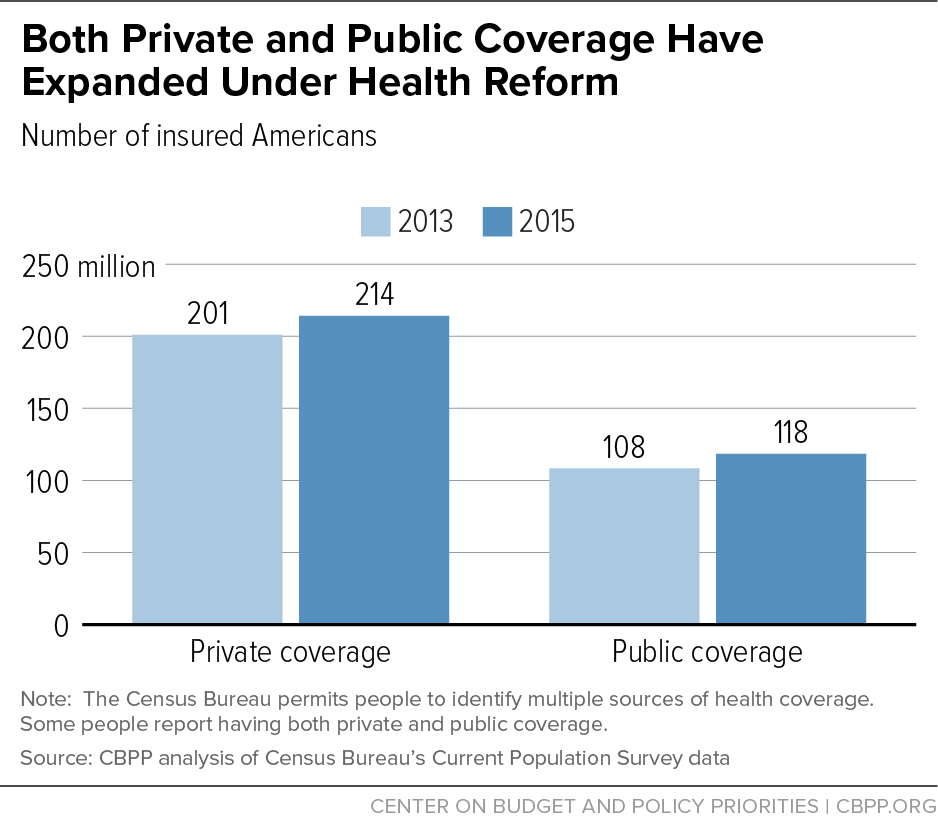
Repealing the ACA would reverse its balanced approach to reducing the number of uninsured Americans. Private coverage and public coverage rates grew together in both 2014 and 2015 because of the ACA’s coverage structure. This hadn’t happened since 2000.
- The share of Americans with private coverage rose from 64.1 percent in 2013 to 67.2 percent in 2015, reflecting increased enrollment in subsidized marketplace coverage and continued progress in covering young adults under their parents’ job-based plans. The number of Americans with private coverage rose by 13.2 million over this period.
- The share of Americans with public coverage rose from 34.6 percent in 2013 to 37.1 percent in 2015, largely reflecting Medicaid enrollment among adults newly eligible for coverage. (Medicare enrollment also rose as more baby boomers reached eligibility age.) The number of Americans with public coverage rose by 10.1 million over this period.[7] (See Figure 3.)
All Demographic Groups Have Experienced Coverage Gains
Repealing the ACA would reverse the recent coverage gains among all demographic groups that the Census health insurance data cover, including gender, income, working status, educational status, and race/ethnicity.[8] The declines in the uninsured rate from 2013 to 2015 range from 23.4 percent among those with family income above 300 percent of the poverty line to 45.5 percent among Asian Americans. (See Table 1.) Examples of the widespread coverage gains include:
- Race/ethnicity. Nearly 6 million fewer white non-Hispanics were uninsured in 2015 than in 2013, as were more than 4 million fewer Hispanics, 1.8 million fewer African Americans, and nearly 1 million fewer Asian Americans.
- Education. Nearly 7.5 million fewer individuals with less than a college degree were uninsured in 2015 than in 2013, as were 2.3 million fewer individuals with college degrees.
- Age. Some 1.7 million fewer children were uninsured in 2015 than in 2013, as were 2.3 million fewer young adults, 4.7 million fewer adults aged 26 to 44, and 4 million fewer adults aged 45 to 64.
- Income. Some 8.5 million fewer individuals with household incomes under $50,000 were uninsured in 2015 than in 2013, as were 4 million fewer individuals with incomes over $50,000.
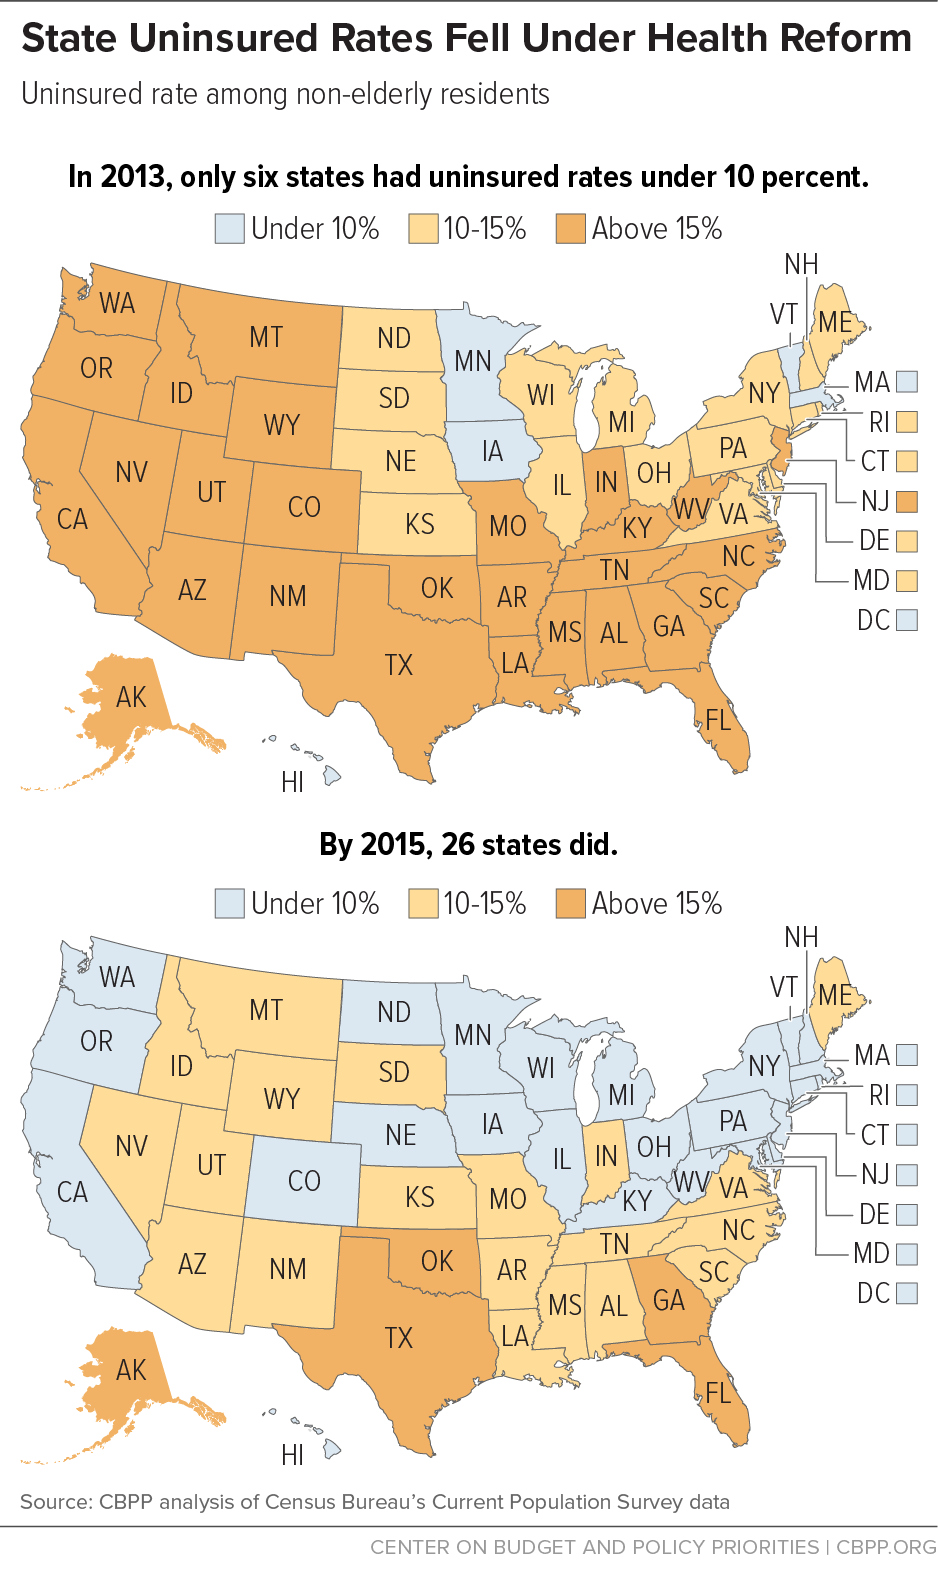
Coverage Has Expanded in All States
Repealing the ACA would reverse recent coverage gains in all states. The uninsured rate dropped by at least one-fifth in 48 states between 2013 and 2015, and by at least one-third in more than half of the states. By 2015, more than 90 percent of the non-elderly were covered in 26 states as compared to in only six states in 2013. (See Figure 4.)
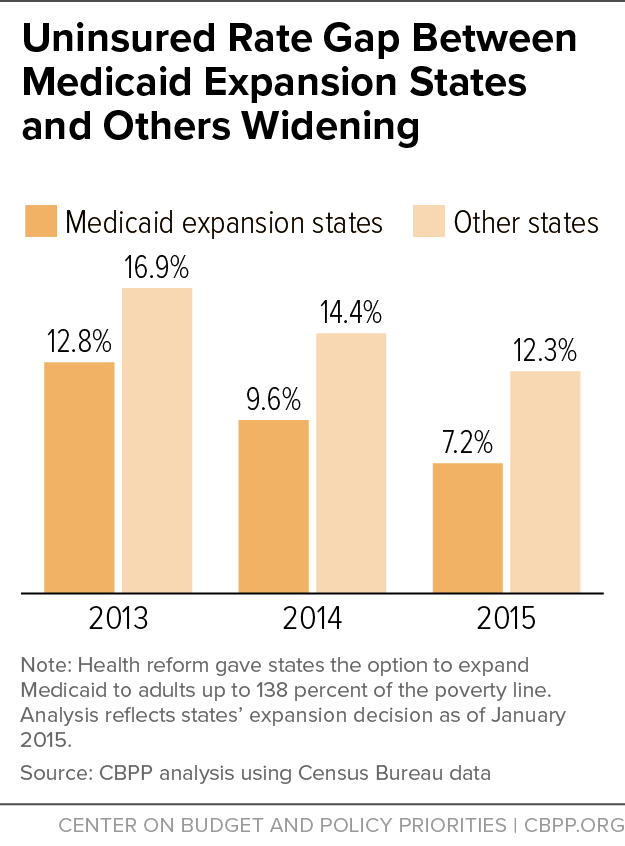
Coverage gains were strongest in states adopting the ACA’s Medicaid expansion. Some 7.2 percent of the people in the 28 states (including the District of Columbia) that had expanded Medicaid by January 1, 2015 were uninsured in 2015, compared to 12.3 percent of people in the 23 non-expansion states.[9] The uninsured rate fell in both groups of states between 2013 and 2015 but fell more in expansion states, widening the gap between the two groups of states from 4.1 to 5.1 percentage points. (See Figure 5.) The Centers for Disease Control (CDC), Urban Institute, and Gallup also have all found evidence of this growing divide.[10]
Latest Data Show ACA’s Coverage Gains Continuing in 2016
Although the Census Bureau data used throughout this report are the preferred source for health insurance coverage estimates, they have limitations.[11] The CDC’s National Health Interview Survey (NHIS), another well-respected instrument, has more recent data and permits longer trend analysis.
The most recent NHIS data show that the uninsured rate was 8.9 percent for the first half of 2016. This is the lowest since the CDC began collecting data in 1997 and more than two-fifths below the peak of 16.0 percent in 2010.[12] Some 20.2 million fewer people were uninsured in the first half of 2016 than when the ACA’s initial provisions took effect in 2010, the data show.
| APPENDIX TABLE 1 | ||||
|---|---|---|---|---|
| Uninsured Rate Has Fallen Sharply Among All Groups | ||||
| 2013 (%) | 2015 (%) | Percentage Change (%) | Number Change (in millions) | |
| TOTAL | 13.3 | 9.1 | -32 | -12.8 |
| RACE/ETHNICITY | ||||
| White, not Hispanic | 9.7 | 6.7 | -31 | -5.9 |
| Black | 15.9 | 11.1 | -30 | -1.8 |
| Hispanic | 24.4 | 16.2 | -34 | -4.0 |
| Asian | 13.8 | 7.5 | -46 | -1.0 |
| AGE | ||||
| Under 19 | 7.5 | 5.3 | -29 | -1.7 |
| 19 to 25 | 22.1 | 14.5 | -34 | -2.3 |
| 26 to 64 | 17.8 | 12.2 | -31 | -8.7 |
| 65 and older | 1.5 | 1.1 | -25 | -0.1 |
| WORK EXPERIENCE | ||||
| Full-time, year-round | 13.9 | 9.9 | -29 | -3.6 |
| Less than full-time, year-round | 24.0 | 15.8 | -34 | -4.2 |
| Did not work at least one week | 22.2 | 15.8 | -29 | -3.7 |
| POVERTY STATUS | ||||
| Below 100% of poverty line (FPL) | 23.5 | 17.4 | -26 | -3.4 |
| 100%-199% FPL | 20.4 | 13.6 | -33 | -4.1 |
| 200%-299% FPL | 15.8 | 9.8 | -38 | -3.0 |
| 300%+FPL | 6.8 | 5.2 | -23 | -2.0 |
| HOUSEHOLD INCOME | ||||
| Less than $50,000 | 19.9 | 13.5 | -32 | -8.5 |
| $50,000+ | 9.0 | 6.5 | -27 | -4.0 |
| REGION | ||||
| Northeast | 9.3 | 6.1 | -34 | -1.8 |
| Midwest | 10.4 | 6.9 | -33 | -2.3 |
| South | 16.3 | 12.0 | -26 | -4.6 |
| West | 14.4 | 8.5 | -41 | -4.2 |
| REGION | ||||
| Inside metro areas | 13.4 | 9.0 | -33 | -11.0 |
| Outside metro | 12.8 | 9.6 | -25 | -1.8 |
| EDUCATION | ||||
| No high school diploma | 38.2 | 27.6 | -28 | -2.1 |
| High school, no Bachelor’s degree | 19.6 | 13.3 | -32 | -6.2 |
| Bachelor’s degree, or higher | 9.2 | 6.2 | -32 | -1.5 |
End Notes
[1] Linda Blumberg, Matthew Buettgens, and John Holahan, “Implications of Partial Repeal of the ACA Through Reconciliation,” Urban Institute, December 6, 2016, http://www.urban.org/research/publication/implications-partial-repeal-aca-through-reconciliation.
[2] Unless otherwise noted, all national-level estimates are based on the Census Bureau’s Current Population Survey (CPS) and all state-level estimates are based on the Census Bureau’s American Community Survey (ACS).
[3] The uninsured rate for 2013 and beyond cannot be compared directly with the rate for previous years due to the Census Bureau’s adoption of new survey questions for 2013. However, the changes in the uninsured rate in 2014 and 2015 can be compared with other single-year change within earlier historical series (each of which contains consistent, comparable data). Census has four series of health insurance coverage estimates from the CPS, covering: (1) 2013-2015; (2) 1999-2012; (3) 1999-2009; and (4) 1987-2005. Each successive series reflects changes from the previous series — in the way the health insurance coverage questions are asked or the survey responses are coded — to improve the accuracy of the survey results. Comparisons of the single-year declines in 2014 and 2015 can be made to the single-year changes within each series of unadjusted data except for 1999 and 2013. For those two years, we adjust the single-year changes based on Census estimates of how the survey changes instituted in those years affected uninsured rates.
[4] Edwin Park, “Republican Bill Vetoed in January Would Have Reversed Nearly All of Health Reform’s Coverage Gains, Center on Budget and Policy Priorities, November 16, 2016, https://www.cbpp.org/blog/republican-bill-vetoed-in-january-would-have-reversed-almost-all-of-health-reforms-coverage.
[5] Congressional Budget Office, Letter to the Honorable Mike Enzi on the Budgetary Effects of H.R. 3762, December 11, 2015, https://www.cbo.gov/sites/default/files/114th-congress-2015-2016/costestimate/hr3762senatepassed.pdf.
[6] Blumberg, Buettgens, and Holahan.
[7] The Census Bureau permits individuals to identify multiple sources of health insurance coverage. Thus, some people report having both private and public coverage.
[8] The lone exception is seniors, as more than 98 percent of the elderly have health coverage, nearly all through Medicare. This figure has remained stable over time.
[9] Our count of Medicaid expansion states excludes Alaska, Indiana, Louisiana, and Montana, which have expanded Medicaid but hadn’t implemented their expansions by January 1, 2015.
[10] Robin Cohen, Michael Martinez, and Emily Zammitti, “Health Insurance Coverage: Early Release of Estimates from the National Health Interview Survey, 2015,” National Center for Health Statistics (Centers for Disease Control and Prevention), May 2016, https://www.cdc.gov/nchs/data/nhis/earlyrelease/insur201605.pdf; and Michael Karpman, Sharon Long, and Steven Zuckerman, “Taking Stock: Health Insurance Coverage Under the ACA as of March 2016,” Urban Institute, May 25, 2016, http://hrms.urban.org/briefs/health-insurance-coverage-ACA-March-2016.html.
[11] See footnote 3.
[12] Emily Zammitti, Robin Cohen, and Michael Martinez, “Health Insurance Coverage: Early Release of Estimates from the National Health Interview Survey, January-June 2016,” National Center for Health Statistics (Centers for Disease Control and Prevention), November 2016, https://www.cdc.gov/nchs/data/nhis/earlyrelease/insur201611.pdf.
More from the Authors

Areas of Expertise