Summary
The most important decision that will influence the economic recovery over the next few years is the trajectory of short-term interest rates. Debate over when to begin raising these short-term rates has picked up in recent months, mostly driven by the fact that the U.S. unemployment rate is approaching levels identified by a number of forecasters as the “natural rate of unemployment,” the lowest possible rate consistent with stable inflation. But history has shown that using ex ante estimates of the natural rate to guide policy can lead to costly errors. This paper suggests complementing quantity targets of the labor market (like the natural rate) with well-specified wage targets to minimize these policy errors.
The key intermediating link between interest rate increases and lower price inflation is the pace of wage increases spurred by labor market tightness. The reason that raising short-term interest rates works to rein in price inflation is that higher interest rates reduce the pace of economic activity, which reduces the pace of unemployment declines, which reduces workers’ ability to bargain for wage increases, which reduces upward pressure on price inflation stemming from labor costs.
The fact that wage inflation, and not any quantity measure of labor market slack, is the most direct intermediating link between interest rate increases and lower price inflation further suggests that policymakers should focus on this link explicitly. If the trend in productivity growth is fairly stable, then fairly precise wage targets can be estimated. Specifically, for a 2 percent price inflation target, 1.5 percent trend productivity growth is consistent with nominal wage growth of 3.5 percent. Since the recovery from the Great Recession began, however, nominal wage growth has stayed well under 2.5 percent and shows few signs of accelerating.
Policymakers may even want to allow real (i.e., inflation-adjusted) wage growth to exceed productivity growth for an extended, albeit temporary, period to allow normalization of the labor share of income, which has fallen precipitously since recovery from the Great Recession began in mid-2009. A period of real wage growth exceeding productivity growth is actually a normal phase of recovery.
Some might argue that while a nominal wage target is a fine place for the economy to end up, the Federal Reserve must tighten well before the target is reached to avoid overshooting wage growth and setting off a wage-price spiral. But the evidence of recent decades strongly suggests that temporarily exceeding wage or price inflation targets will not lead to a rapid de-anchoring of inflation expectations. Absent an acceleration of real wages at a pace faster than the U.S. economy has seen in decades, the Fed can wait until the wage target is met before it engages in monetary contraction.
There is, of course, no single indicator on which the Fed should mechanically base interest rate decisions. However, comparing actual nominal wage growth to a well-specified wage target can provide an important check on pressures to tighten in the name of avoiding future inflation. The elevation of nominal wage targets into the monetary policy debate would thus represent a healthy development.
Introduction
The short-term interest rates controlled by the Federal Reserve—the workhorses of macroeconomic stabilization in recent decades—have been held at essentially zero since the last quarter of 2008, but pressure is mounting on the Fed (even from some of its own regional bank presidents) to raise them.[1] Debate over when to begin raising these rates has picked up in recent months. While the goal of raising or lowering rates is to meet a long-run price inflation target,[2] the key intermediating link between interest rate increases and lower price inflation is wage increases spurred by the state of labor market tightness. The reason that raising short-term interest rates works to rein in price inflation is that higher interest rates reduce the pace of economic activity, which reduces the pace of unemployment declines, which reduces workers’ ability to bargain for wage increases, which reduces upward pressure on price inflation stemming from labor costs.
Despite the fact that it is wage inflation that is the most direct intermediating link between interest rate increases and lower price inflation, estimates of labor market strength during economic recoveries have traditionally focused on quantity measures, like the unemployment rate or the labor force participation rate. This brief argues that larger weights need to be given to price measures—nominal wages. Specifically, it argues:
- Quantity measures of labor market slack are hard to forecast and are not useful guides to policy. In particular, the unemployment rate may understate labor market slack if labor force participation rates are cyclically depressed, as they likely are currently.
- Estimates of the natural rate of unemployment (the rate below which inflation will accelerate) and the structural rate of change in labor force participation (the rate determined by demographic factors rather than economic one) have extremely large margins of error.
- By contrast, relatively precise wage targets can be estimated, so long as the trend of productivity growth remains consistent.
- Fears that exceeding wage or price inflation targets for a short period will de-anchor inflation expectations and lead to accelerating inflation are misplaced.
- Wage growth that exceeds the sum of productivity growth and the Fed’s price inflation target even for years is not necessarily a problem when labor’s share of income is significantly depressed; instead, it is a necessary condition for a return to normal economic growth.
- There is no single indicator on which the Fed should mechanically base its decisions. However, the indicator that best captures how close the economy is to labor market tightness consistent with a given inflation target is a nominal wage target that sums the trend in productivity growth and the price inflation target. By this measure, the Fed should forestall monetary tightening until substantial progress in meeting that wage target is met.
When to increase rates? The limited value of quantity measures of slack
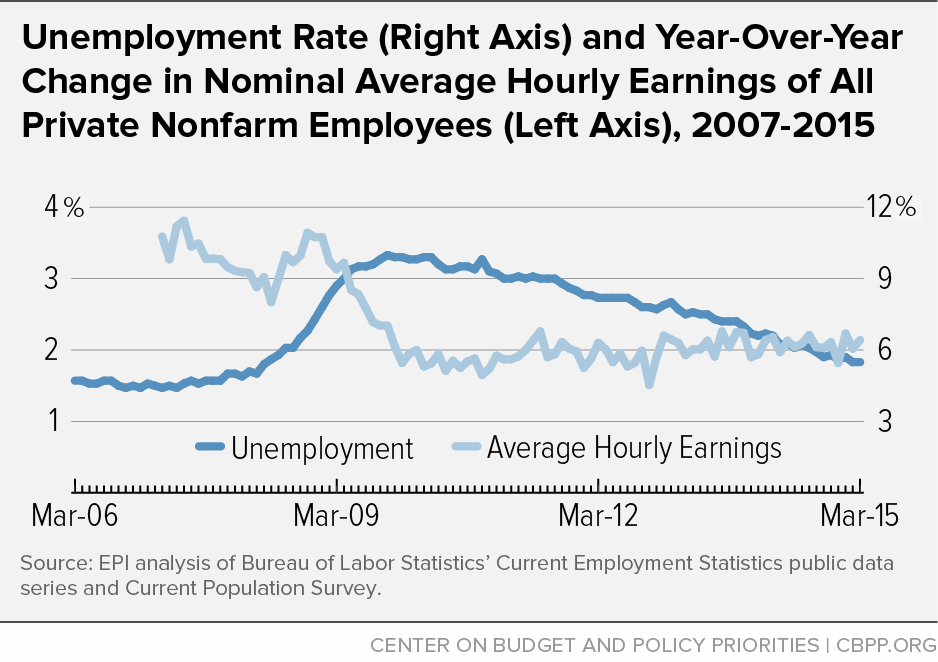
The Fed moved its primary short-term interest rate effectively to zero in December 2008, at a time when the unemployment rate was 7.3 percent and rising. Since 2011, the unemployment rate has been steadily falling, and it currently stands at about 5.5 percent. This level and the trajectory of recent years have led many economic observers to declare that the Fed should begin raising short-term rates in order to get ahead of inflation.[3]
Yet at present inflation rates remain very low. And even though the annual unemployment rate fell from 9.6 percent in 2010 to 6.2 percent in 2014, nominal wages in those years barely moved, hovering in a range between 1.7 percent and 2.1 percent growth. (See Figure 1.)
The imprecision of ex ante estimates of the natural rate of unemployment
A key piece of evidence showing that quantity measures of labor market slack need to be supplemented with wage measures is the breakdown of forecasts stemming from wage Phillips curves. A wage Phillips curve plots the percentage change in nominal wages against the level of unemployment. It is commonly accepted that at very high levels of unemployment the wage Phillips curve may be nearly flat, meaning that a movement from, say, 10 to 9 percent unemployment may not lead to any detectable change in wage growth at all. One possible explanation for the failure of wage growth to respond to falling unemployment even in the past year or so is that the economy remains on the flat portion of the wage Phillips curve. However, if the wage Phillips curve is indeed nearly flat even at 5.5 percent unemployment, then the rate of unemployment consistent with an inflation rate of 2 percent (the Fed’s target) is much lower than conventional estimates of the natural rate of unemployment would indicate.
A rough rule of thumb (which will form the basis of our recommended wage target) is that nominal wages should be rising at the rate of price inflation plus the trend in productivity growth plus a measure of cyclical adjustment (i.e., the slope of linear wage Phillips curve).[4] An often-cited rough estimate of the Phillips curve slope (once unemployment rates go low enough to move off of the flat portion of the curve) is 0.5 percent. The year-over-year change in the core personal consumption expenditure (PCE) deflator, a commonly watched measure of price inflation, was 1.5 in the first quarter, and productivity growth is roughly 1.5 percent, implying that nominal wage growth consistent with stable price inflation could have been 3 percent before any cyclical drag from excess unemployment. Yet hourly wages for all employees rose only 2.1 percent relative to the same quarter in the previous year, implying a cyclical drag on wages of nearly a full percentage point. A 0.5 percent Phillips curve slope would imply that the rate of unemployment consistent with no cyclical drag on wage growth would be just over 3 percent — far below any conventional estimate of the natural rate of unemployment.
But conventional estimates of the natural rate are notoriously imprecise. Staiger, Stock, and Watson[5] show that, depending on the inflation indicator used, the natural rate of unemployment could be anywhere from 2.9 to 8.3 percent. Their estimates are a little more precise using the PCE deflator, but still range from 4.1 to 6.7 percent in a given year.
Cyclical participation?
Even if the natural rate of unemployment is closer to conventionally estimated values, labor market slack could be greater than what today’s unemployment figures suggest. For example, one indicator of labor market strength besides unemployment is labor force participation. Even after the Great Recession officially ended in 2009, labor force participation rates fell, and for the first year or two many interpreted the decline as a symptom of cyclical economic weakness and expected a rebound.
But this view is complicated by the fact that demographic change — the baby-boom generation beginning to reach retirement age — has been putting steady, downward pressure on labor force participation since 2007. Further, there seem to be steady downward trends in participation rates even within age and gender cohorts. It is hard to separate these structural trends from cyclical changes in participation rates.
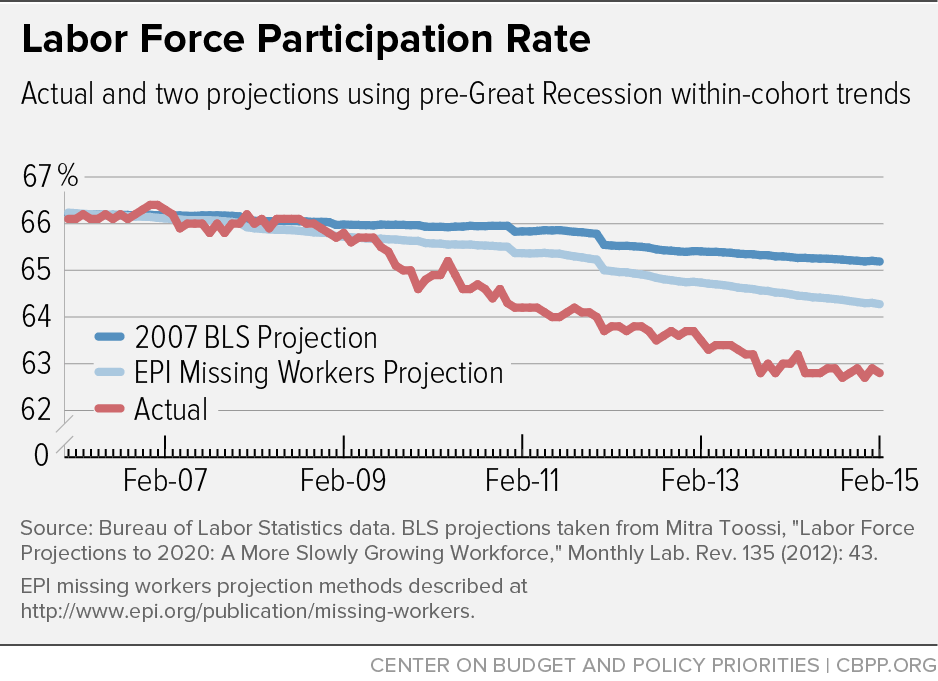
Figure 2 illustrates the problem. The top line shows what the labor force participation rate would have been had the age/gender cohort rates projected by the Bureau of Labor Statistics (BLS) immediately preceding the Great Recession come to pass. The middle line is an estimate of the labor force participation rate if there were no cyclical weakness in the economy.[6] The bottom line shows the actual rate. The gap between actual labor force participation and these alternative projections of what it would have been absent changes in pre-recession trends implies that participation is cyclically depressed.
Some researchers have challenged this interpretation. Aaronson et al. (2014) undertake a number of estimating techniques to infer the cyclical effect on participation rates.[7] But while their work has been interpreted as showing a very small effect of cyclical weakness in depressing participation, there is a large variation in their estimates depending, for example, on whether they use the full 1976-2014 period for estimating age/gender cohort participation trends or instead stop estimation of these trends in 2007 and push them forward to the present. When they do the latter (which can be interpreted as a good way to avoid infecting estimates of this trend with cyclical weakness caused by the Great Recession and its aftermath), they find that cyclical weakness is depressing the overall participation rate by about 2 percentage points. The effect is smaller — about a quarter as much — when they estimate trends all the way through 2014.
If the labor force participation rate is indeed cyclically depressed, then millions of workers are missing from the labor market even though the official unemployment rate is nearing some estimates of its natural level. All in all, quantity measures of labor market slack, like the unemployment rate, allow only imprecise estimates of labor market tightness or slack. Since reduced slack eventually must by definition translate into accelerating wage increases if it is to threaten to put upward pressure on the Fed’s price inflation target, it seems policymakers and economic observers should complement quantity measures with a much larger focus on the price (wage) side of the labor market.
Wage targeting: easier to measure and interpret and more directly related to price inflation
So long as one is relatively confident in the pace of productivity growth, it is possible to specify a nominal wage target that is consistent with an overall price inflation target.
To understand how labor market pressure pushes up nominal wages and then prices, assume a closed economy. In this case, if I pay $1 for any good or service, every bit of that dollar will go either to somebody’s labor compensation or somebody’s return to capital invested. If the price rises, the increase has to be driven by higher labor costs, higher returns to capital, or some combination of the two, and it will be weighted by the shares of each—labor and capital—in the economy.
The appendix runs through some simple algebra on the accounting of price changes in a one-good economy to provide some intuition. The result of this shows that price changes over a given period are a weighted average of changes in labor costs and returns to capital (or profits), with the weights a function of labor and capital shares in the economy. Importantly, the math also reveals that all else equal, faster productivity growth reduces price increases.
Putting numbers to price accounting to get a useful wage target
The lesson of this example is that, as long as nominal wages are growing at or beneath the rate of productivity growth, then labor costs are putting no upward pressure on prices at all. This concept is embodied in unit labor costs, i.e., the unit of compensation per unit of productivity. If real wages and productivity accelerate by equal amounts (in percentage terms), there is no increase in unit labor costs and no pressure on prices from wage growth, as more efficient production (faster productivity growth) has “absorbed” the wage increase such that it does not need to be passed through to prices.
For small magnitudes, the change in unit labor costs can be approximated as the percentage change in hourly pay minus the percentage change in productivity. And this change is what the Fed is hoping to keep running below its target rate of overall price inflation. So long as unit labor costs are rising at less than 2 percent, they are not putting upward pressure on the price inflation target.
Thinking of price changes as the simple (weighted) sum of changes to wages, productivity, and producer markups helps sort out arguments that are not pertinent to how the Fed should react in coming months. For example, some have argued that the Fed must raise rates even in the absence of accelerated wage growth because price inflation sometimes occurs in the absence of wage inflation. This is true, but largely irrelevant. If price inflation rises without any corresponding rise in wage inflation, the increase is unlikely due to excess aggregate demand that could or should be addressed by higher interest rates. For example, the lion’s share of price increases in the non-financial corporate sector since the recovery began has occurred because of an extraordinarily rapid growth in the markup over labor costs (we return to this in the next section). Given that these markups, and hence the non-labor share of corporate-sector income, consistently rise rapidly in the early phases of economic recovery, after falling rapidly during recession, and largely reflect labor market slack that allows employers to bargain for a larger share of output (higher profitability), it would be odd to argue that the Fed should meet price increases stemming from non-labor cost increases with interest rate increases that would further reduce labor cost pressures.[8]
Finally, you might ask how we can justify ignoring import price increases in the accounting above. The answer is that import price increases are mostly exogenous changes (usually supply-side shocks) that are largely outside of the Fed’s control. Another way to make this argument is to assert that core measures of inflation targeted by the Fed should exclude not only food and energy prices (which tend to be volatile due to developments on the supply side in these markets) but imports as well. It would be strange indeed for the Fed to react to import price increases by raising interest rates and slowing the domestic economy.
Identifying the trend in productivity
The monthly data on jobs and unemployment on which Fed watchers focus include a measure of hourly wage growth. This measure does not include non-wage pay (i.e., benefits), but the share of total compensation accounted for by non-wage pay moves relatively slowly, so hourly wage growth is a good proxy for growth in total compensation in the short run. But the rate of change in hourly wages that is consistent with a 2 percent price inflation target depends crucially on the growth rate of productivity.
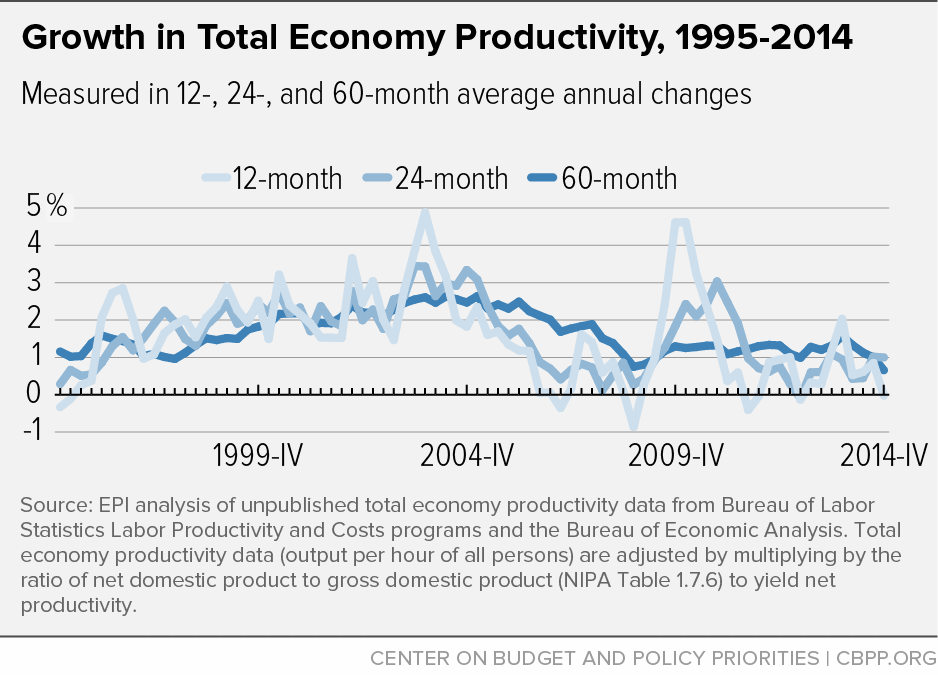
The trend in productivity growth is hard to precisely measure, particularly during times of slack in economy-wide resources. Figure 3 shows changes in net economy-wide productivity over 12, 24, and 60 months. Shorter-run measures are quite volatile, but given the extraordinary length of economic weakness following the Great Recession, even the 60-month trend in productivity growth is likely affected by cyclical factors.
Productivity growth over the previous business cycle (2001-2007) averaged 2.1 percent. For the last four complete business cycles (2000-2007, 1989-2000, 1979-1989, and 1973-1979) productivity growth averaged 1.5 percent, but this average was pulled down by the weak productivity growth in the 1970s and 1980s cycles (1.1 and 1.3 percent, respectively). The Social Security Administration (SSA), in its “intermediate scenario,” and the Congressional Budget Office (CBO) estimate productivity growth trends at 1.7 percent and 1.6 percent, respectively. The Goldman Sachs macroeconomic forecasting team is more optimistic, arguing that trend productivity growth is closer to 2.0 percent. Given these estimates, it is fair to say that 1.5- 2.0 percent is a defensible estimate for productivity growth in the wage-targeting equation.
With wage growth so slow, why hasn’t inflation been even lower over the recovery?
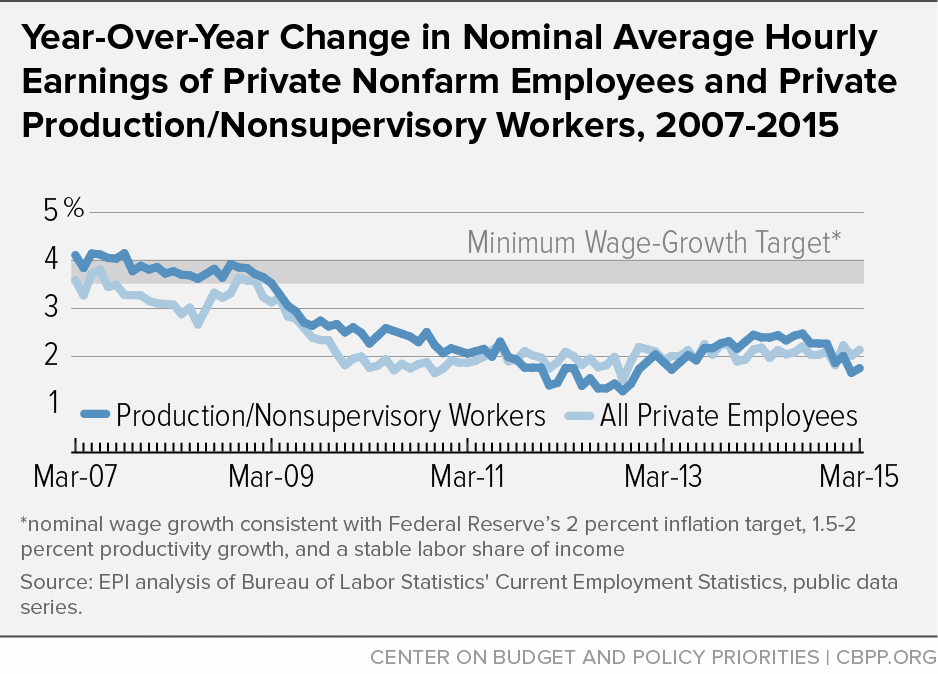
A 1.5-2.0 percent estimate of trend productivity growth implies that hourly compensation growth of 3.5-4 percent is consistent with the Fed’s long-run price inflation target of 2 percent. Figure 4 highlights just how far beneath this 3.5-4.0 percent target recent years’ hourly wage growth has been.
This very low wage growth raises the question of why price growth has not been even slower than it has been over this same period. After all, hourly wage growth of 2.0-2.5 percent combined with trend productivity growth of more than 1 percent implies that, all else equal, prices should be rising at less than 1 percent annually.
But all else is far from equal. Data on unit costs in the non-financial corporate sector show that the markup to capital—profit—has risen sharply. (See Figure 5.)
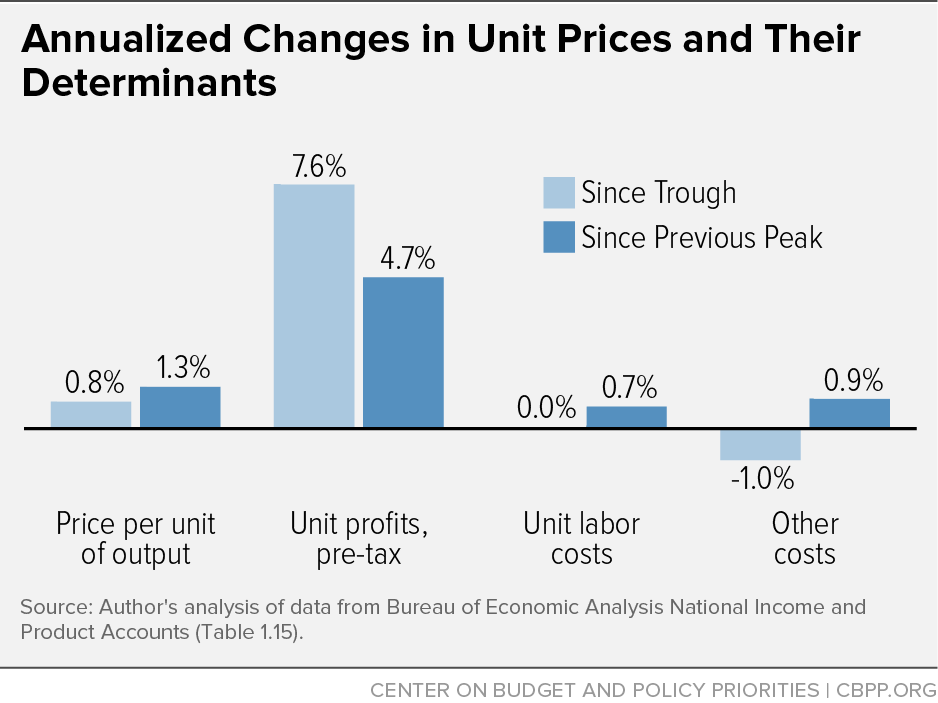
Over the recovery (since the second quarter of 2009), unit prices in the non-financial corporate sector have risen at a 0.8 percent annualized rate. All of this growth can be accounted for by rising profits. Unit labor costs have been flat, all other costs have fallen, but unit profits have risen at a 7.6 percent annualized rate.
Even measured relative to the previous business cycle peak, growth in profits has driven overall trends in unit prices. Since the last quarter of 2007, unit prices in the non-financial corporate sector have risen at an annual average rate of 1.3 percent. Within this, unit labor costs have risen at a 0.7 percent rate, other costs have risen at a 0.9 percent rate, and unit profits have risen at a 4.7 percent rate. This profit performance is extraordinary, particularly given the very sharp fall in profits during the Great Recession. Breaking down unit price growth shows that unit profits are responsible for 64 percent of the rise in prices since the last business cycle peak, even though in the last quarter of 2007 they accounted for less than 12 percent of total price increases in the non-financial corporate sector.
In short, the mystery of the missing price drop is easy to solve: rising profits kept prices up.
Labor share normalization and medium-term wage targets
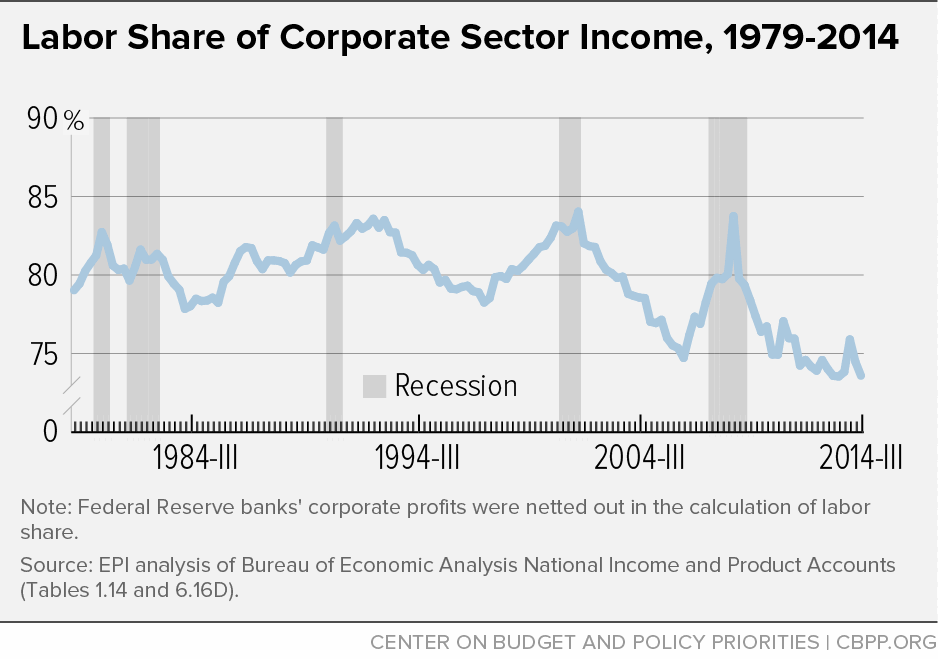
An increase in the markup over costs implies an increase in the share of income accounted for by profits rather than labor. Figure 6 shows the share of non-financial corporate-sector income claimed by labor in recent years (since all income in the corporate sector is classified either as labor or capital income, this is simply the mirror image of the capital share). The fall in labor’s share since the beginning of the Great Recession is striking, and shows precisely the radical slowdown in unit labor costs even as the profit markup expanded. Allowing the labor share of income to climb back to its pre-Great Recession levels should be a goal of monetary policymakers as they look at the economy and decide the direction of short-term rates.
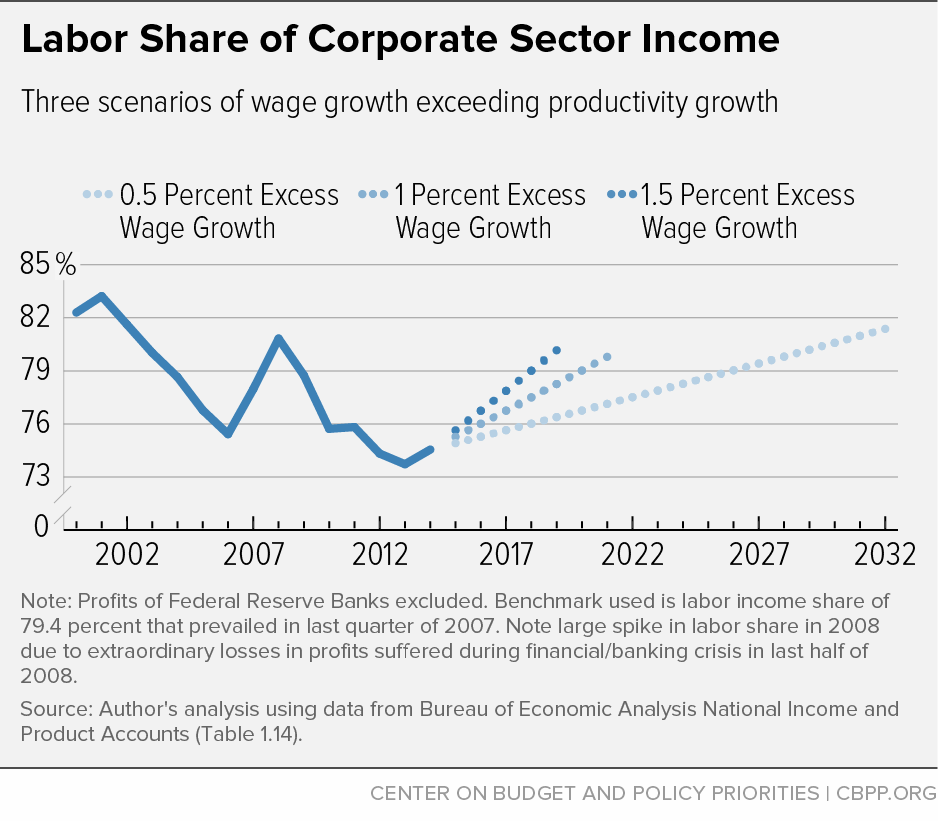
What would getting the labor share of income back to a pre-recession level mean for a wage target? One way to assess this is to look at the labor share of corporate sector income at the end of 2014, and see how long it would take to re-attain the pre-Great Recession share if inflation-adjusted wages exceeded productivity growth by various amounts. Figure 7 shows the path of the labor share of income in coming years under three scenarios: inflation-adjusted wage growth exceeding productivity by 0.5, 1.0, and 1.5 percentage points.
If real wages grew by 0.5 percentage points above productivity growth (which would imply nominal wage growth of 4 percent in the case of 2 percent price inflation and 1.5 percent trend productivity growth), then it would take 14 years (until 2029) to re-attain the pre-Great Recession labor share (79.4 percent in the last quarter of 2007). At 1.0 percentage points (consistent with nominal wage growth of 4.5 percent), it would take eight years (2022), and at 1.5 percentage points (5 percent nominal wage growth), it would still take five years (2019).
It’s important to note here that there is nothing radical about defining a full economic recovery as one in which the labor share of income returns to its pre-recession level. The historical data in Figure 6 show that the labor share has strong and consistent cyclical behaviors over the business cycle — rising during a recession (as volatile corporate profits fall first and fastest), falling rapidly in early phases of recovery, and rising again late in the recovery and expansion. It is a clear sign of how incomplete the current recovery is that the recovery of the labor share has barely begun, even 18 quarters after the official trough.[9]
The upshot of allowing a clawback of the drop in labor’s share that occurred during the Great Recession is that either the U.S. corporate sector must accept a declining markup or the Fed must tolerate for a time an inflation rate exceeding the 2 percent target (or some combination of both). But an argument can be made that the Fed’s 2 percent inflation target should be a target for long-run average inflation and not a ceiling that the Fed will ever tolerate. Given that a number of years have passed with inflation below 2 percent, a period of time should be allowed when inflation exceeds 2 percent before the Fed considers itself to be missing its target on the high side. Debate over whether the 2 percent target is a ceiling or an average persists today. Even considered as an average it is likely too conservative an inflation target, but taken as a ceiling it is deeply destructive to achieving a full recovery, let alone full employment.
Shooting ahead of the duck: Does tightening have to occur long before the target is reached?
So far, we have specified wage targets contingent on 1.5 to 2 percent productivity growth. Given this estimate, the minimum amount of wage growth that should spur thoughts of raising interest rates is 3.5 to 4 percent. But genuinely normalizing economic conditions — which includes restoring the labor share of income to pre-recession levels — requires an extended period with significantly faster nominal wage growth.
A criticism of this approach is that, while these wage growth targets are decent measures of where wage and price inflation should end up in equilibrium, they are bad targets for monetary policy during the adjustment phase because, by delaying monetary tightening until these targets are hit, we will end up overshooting. That is, if we wait to raise rates until nominal wage growth is 3.5 to 4 percent, momentum from the extended period of expansionary monetary policy will fling wage growth far above this range, necessitating a steep and sudden monetary contraction to keep inflation anchored. The metaphor for this line of thinking, from a speech given in 2014 by then-Dallas Federal Reserve Chair Richard Fisher, is “shooting ahead of the duck.”[10]
History shows that the duck flies really slowly
This is a genuine concern — there is a long literature on monetary policy lags and how policymakers should deal with them. In practical, empirical terms, however, there seems to be much less to worry about on this score than commonly realized.
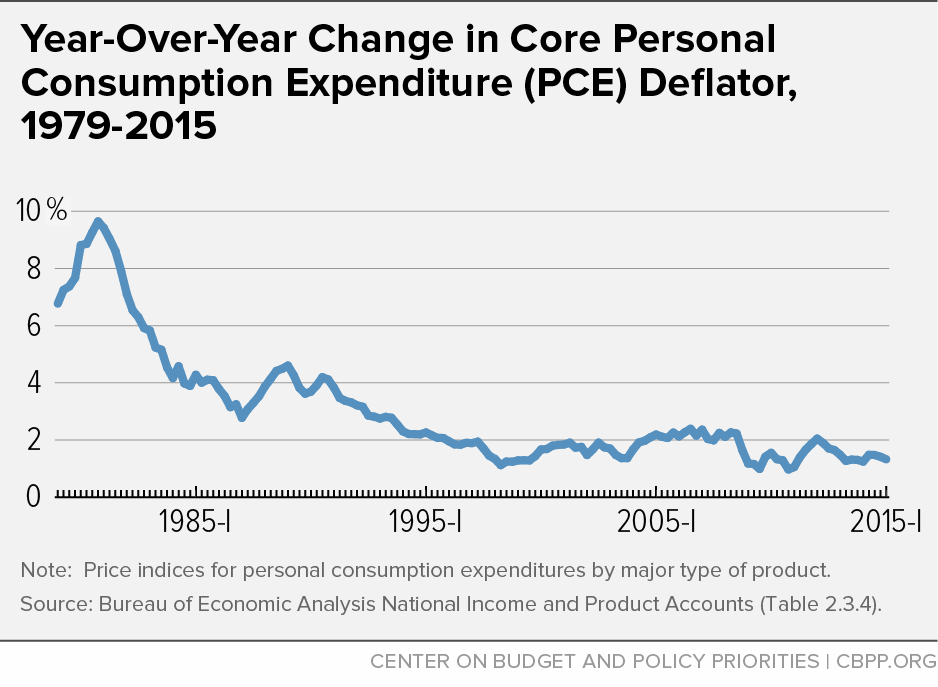
The gist of Fisher’s concerns is that inflation-adjusted wages might begin running ahead of economy-wide productivity, hence spurring ever-accelerating inflation. But wages for the vast majority of American workers have not exceeded productivity growth in a generation. And price inflation has been steadily declining for more than 30 years. Table 1 shows hourly compensation and net productivity growth since 1973. Figure 8 shows the long-run trajectory of core price inflation. The story about wage growth exceeding productivity growth and forcing inflation above the Fed’s target levels is very hard to read in this data.
| TABLE 1 | ||||||
|---|---|---|---|---|---|---|
| Average hourly wage and compensation growth, by percentile, 1979-2014 | ||||||
| 10th | 30th | 50th | 70th | 95th | Net productivity |
|
| Wages | ||||||
| 1979-1995 | -0.87% | -0.33% | -0.15% | 0.03% | 0.78% | 1.17% |
| 1995-2001 | 2.30% | 2.02% | 1.60% | 1.40% | 2.02% | 2.02% |
| 2002-2007 | -0.35% | -0.57% | -0.08% | 0.02% | 0.62% | 1.80% |
| 2007-2017 | -0.45% | -0.58% | -0.29% | -0.14% | 0.31% | 1.06% |
| 1979-2014 | -0.12% | 0.01% | 0.16% | 0.27% | 0.95% | 1.43% |
| Compensation | ||||||
| 1979-1995 | -0.65% | -0.04% | 0.18% | 0.43% | 1.15% | 1.17% |
| 1995-2001 | 2.23% | 1.90% | 1.53% | 1.32% | 1.86% | 2.02% |
| 2002-2007 | -0.27% | -0.27% | 0.22% | 0.45% | 1.15% | 1.80% |
| 2007-2017 | -0.54% | -0.56% | -0.12% | 0.08% | 0.61% | 1.06% |
| 1979-2014 | -0.03% | 0.17% | 0.37% | 0.42% | 1.26% | 1.43% |
| 1979-1995 | -0.65% | -0.04% | 0.18% | 0.43% | 1.15% | 1.17% |
State Phillips curves also show little danger of wage explosion in coming years
Fisher cites a working paper by Anil Kumar and Pia Orrenius that uses state-level data on unemployment rates and nominal wage growth to assess wage Phillips curves. Fisher argues that this paper provides the empirical support for his concern that wage pressures will force inflation far above the Fed’s target should unemployment continue its steady descent in coming years.[11] However, the paper actually does no such thing. Figure 5 from the paper highlights the key finding that its authors emphasize: the impact of falling unemployment on wage growth is significantly larger for unemployment rates below 6.1 percent (their sample average) than above 6.1 percent. This seems plausible. But the magnitude of the effect of lower-than-6.1 percent unemployment on real wages is stunningly low. Looking closely at their figure reveals that the average rate of inflation-adjusted wage growth at 6.1 percent unemployment is indistinguishable from zero. Further, each percentage point reduction in unemployment below 6.1 percent leads to real wage growth of 0.5 percent. This means that overall real wage growth at 3 percent unemployment would be about 1.6 percent, period. Real wage growth of 1.6 percent in the near term could in theory be mildly inflationary (that is, it would push inflation a bit above the Fed’s 2 percent price inflation target) or lead to reduced profit markups. But it would take considerable time before real wage growth that exceeded productivity growth (i.e., real wage growth in excess of 1.5 percent) restored the labor share of income to pre-recession levels.
Over the current recovery, the fastest pace of unemployment decline has been just over 1 percentage point per year. This pace implies that policymakers have a year before the 0.5 percent pickup in real wage growth implied by the Kumar and Orrenius findings emerges. And going forward, this pace assumes that there is no moderating effect of rising labor force participation rates on unemployment declines, even though declines in labor force participation have decelerated a bit over the past year—falling by 0.3 percent in 2014 following declines of between 0.4 and 0.7 percentage points in the previous five years.
The Kumar and Orrenius findings suggesting little reason to worry about a surge in real wage growth following plausible unemployment declines in coming years can also be read as a useful complement to the work of Akerlof et al.,[12] who have noted that at very low rates of inflation nominal wage growth stops corresponding one-for-one with expected price growth. So long as inflation is low, economic agents begin thinking in only nominal terms and generally do not make decisions based on expected future inflation. Because of this failure to incorporate inflation expectations in decision making (a failure that Akerlof and co-authors term “near-rational” because, while not optimal, it does not lead to large loses), any tradeoff between inflation and unemployment is a concern only in the very long run, and targeting inflation in the short run implies unnecessary sacrifice in terms of employment. An obvious corollary of these results is that at initially low rates of inflation the benefits of pursuing lower unemployment are magnified. It is hard to pinpoint at what exact inflation rate this near-rational targeting of nominal values only stops and agents beginning forming and acting on expectations of future inflation, but Akerlof et al. suggest that it explained some of the ability to achieve historically low rates of unemployment in the late 1990s. Given that inflation (as measured by the core PCE deflator) during the 1995-2000 period averaged 1.7 percent, compared to 1.4 percent since the middle of 2009, it seems likely to be at least as applicable today.
Distributional issues
One plausible explanation for the relatively small wage impact of falling unemployment rates is that the greatest wage gains driven by the lower unemployment have occurred in the bottom and middle of the wage distribution. I have found in previous work that wages for the top 5 and 10 percent of men are insensitive to changes in unemployment rates, while wages for the 10th percentile are the most sensitive. At the same time, the distribution of earnings in the U.S. economy is quite skewed, with the top 10 percent of wage earners accounting for a higher overall share of labor income in the U.S. than the bottom 60 percent.
These distributional issues imply two things. First, reducing unemployment is important for compressing labor earnings and reducing wage inequality. By definition, if lower unemployment rates spur faster growth at the bottom and middle than at the top, then low rates of unemployment are good for equality.[13] Second, average wage growth is likely to respond to lower unemployment rates to a lesser degree than might be inferred from studies that have examined the impact of unemployment on either median wages or the average wages of production and nonsupervisory labor (a group comprising 80 percent of the private-sector workforce but that is much lower paid than the other 20 percent).
Conclusion
Specifying guidelines for monetary policymakers based on quantity measures of labor market slack is hard to do. Conventional ex ante estimates of the natural rate of unemployment suffer from imprecision, and experts have a hard time agreeing on the degree to which labor force participation rates may or may not be cyclically depressed. This argues for paying more attention to price measures of labor market slack. If one has a reasonable measure of the trend in productivity growth (which is admittedly imprecisely estimated itself), then it is straightforward to map the sustainable rate of nominal wage growth consistent with the Fed’s inflation target.
When starting from very low rates of overall inflation, the insistence that monetary policymakers need to be forward-looking and tighten well before the wage target consistent with the Fed’s price target is reached is not at all well-grounded empirically. Further, even if there was an extended period when nominal wage growth significantly exceeded the wage target consistent with the Fed’s price target, the result would simply be an increase in the labor share of income. Given that labor’s share remains extremely depressed relative to pre-recession levels, some overshooting would not be a policy failure; instead, it would be a proper step toward restoring the economy to more normal conditions.
The nominal wage target is not a rigid rule that should crowd out all other data in Fed decision-making, and some flexibility in implementation is called for even if one is confident of the final target. For example, history teaches that we can get quite close to the target without raising interest rates and without overshooting and setting off a wage-price spiral. But if in the coming year or two indicators of macroeconomic tightness arise and wage growth accelerates, then tightening before the exact target is reached might be appropriate. But examining the trajectory of actual wage growth to that spelled out by the nominal wage target might promote the inference of policy moves from more relevant data sources. In other words, don’t always look for a single macroeconomic target, but if one is called for, you might try wage targeting.
Josh Bivens is director of research and policy at the Economic Policy Institute.
Appendix:
Accounting for price changes: The role of labor costs, profits, and productivity
The claim that all price changes must show up as a change to incomes of capital owners or workers in a closed economy does not rest on any particular theory of price formation; instead, it is a matter of pure accounting. To see why, start with an expression for gross domestic income, where all income flows accrue to either labor or capital.

Here, P is the overall price level, X is output, w is the nominal wage rate, L is the employed labor force, K is the capital stock (because it is a one-sector model it is valued with the same price index as output, P) and r is the profit rate returned on invested capital.
Dividing through by output (X) yields:

Where b is the unit labor input (L/X), which is the inverse of productivity, and  is simply defined as (rK/X). Consolidating P on one side yields:

Finally, this can be expressed as:

If  is set equal to .
From here, one can express price changes (with a hat over each variable denoting it’s rate of change) as the weighted average of changes in labor costs and capital payments:

Where  is the share of labor payments in prices (or wb/P) and (1-) is the share of capital payments in prices, or
  .
.
Besides reminding us that price increases must show up as increased nominal payments to some factor of production, this accounting also reminds that, all else equal, rising labor productivity reduces price increases. In (2), b is the unit labor input, which is simply the inverse of productivity. So, as productivity rises, b falls, which reduces prices.
End Notes
[1] The recession and sluggish recovery that occurred even in the face of zero short-term interest rates convinced the Fed to undertake a number of unconventional policy measures — with forward guidance and large-scale asset purchases (LSAP) being the most notable. Forward guidance largely ended with the last meeting of the Federal Open Market Committee, when the Fed removed the word “patient” from its assessment of when it might move to raise short-term rates. The net new purchase of assets in the LSAP programs ended in November of last year (though the Fed has not yet moved to actively sell off the more than $3 trillion in Treasuries and mortgage-backed securities it accumulated during three rounds of LSAP, sometimes referred to as “quantitative easing”). This leaves the last bit of monetary stimulus undertaken during the Great Recession to be unwound — the extraordinarily low short-term policy rates.
[2] While the Fed pursues a dual mandate of maximizing employment and minimizing inflation, it raises interest rates in furtherance of the latter.
[3] It would not matter enormously for employment or inflation if the Fed raised rates by 25 basis points and then stopped there. What really matters is the pace of rate increases over the next two to three years. In this paper, we shorthand whether or not to make this path of interest rate increases steep or shallow as whether or not to raise rates sooner or later.
[4] A wage Phillips curve relates the rate of change of nominal wages to the unemployment rate.
[5] D. Staiger, J.H. Stock, and M.W. Watson, “The NAIRU, Unemployment, and Monetary Policy,” Journal of Economic Perspectives 11, no. 1 (1997): 33-49.
[6] This projection is made by taking age/gender cohort participation trends from 1989 to 1996 and 1996 to 2004, weighting them by one-fifth and four-fifths, respectively (i.e., giving recent trends significantly more weight) and then projecting them forward to 2016. See “Missing Workers,” Economic Policy Institute, updated May 8, 2015, http://www.epi.org/publication/missing-workers/.
[7] S. Aaronson, T. Cajner, B. Fallick, F. Galbis-Reig, and W. Wascher, “Labor Force Participation: Recent Developments and Future Prospects,” Brookings Papers on Economic Activity 49, no. 2 (2014): 197-275.
[8] For evidence on the rise in markups in the early phases of recovery, see Figure G in J. Bivens and H. Shierholz, “Lagging Demand, Not Unemployability, Is Why Long-Term Unemployment Remains So High,” Economic Policy Institute, 2014.
[9] The spike in the labor share in the first quarter of 2014 should be heavily discounted. It was largely a function of the end of the bonus depreciation tax credit that was first enacted in the 2008 economic stimulus package. The end of this credit substantially increased estimated capital consumption adjustments, which increased reported depreciation rates for the quarter, reducing corporate profits adjusted for depreciation.
[10] Richard Fisher, “Monetary Policy and the Maginot Line,” Speech at the University of Southern California, July 16, 2014, available at http://www.dallasfed.org/news/speeches/fisher/2014/fs140716.cfm.
[11] A. Kumar and P. Orrenius, “A Closer Look at the Phillips Curve Using State-Level Data,” Working Paper No. 1409, Dallas Federal Reserve Bank, 2014, available at www.dallasfed.org/assets/documents/research/papers/2014/wp1409.pdf.
[12] G.A. Akerlof, W.T. Dickens, G.L. Perry, R.J. Gordon, and N.G. Mankiw, “The Macroeconomics of Low Inflation,” Brookings Papers on Economic Activity (1996): 1-76; G.A. Akerlof, W.T. Dickens, G.L. Perry, T.F. Bewley, and A.S. Blinder, “Near-Rational Wage and Price Setting and the Long-Run Phillips Curve,” Brookings Papers on Economic Activity (2000): 1-60.
[13] Valerie Wilson has also shown that low rates of unemployment likely compress hourly wage-growth rates between white workers and black workers; see “The Impact of Full Employment on African American Employment and Wages,” Center on Budget and Policy Priorities, Full Employment Project (2015), http://www.epi.org/publication/the-impact-of-full-employment-on-african-american-employment-and-wages/.