How States Use Federal and State Funds Under the TANF Block Grant
A key feature of the 1996 overhaul of the nation’s cash assistance system was turning funding over to the states and giving them broad flexibility on using the funds through the creation of the Temporary Assistance for Needy Families (TANF) block grant. Prior to the TANF block grant, families in need received cash assistance through the Aid to Families with Dependent Children (AFDC) program, under which federal funds matched half or more of every dollar of cash assistance that a state provided to a needy family. A key argument for block granting was that states needed much greater flexibility over the use of the federal funds than AFDC’s funding structure provided. Under a block grant, proponents argued, states could shift the funds freed up when families left welfare for work to child care or other work supports, where need would increase. States also could invest more in work programs to reflect the increased emphasis on welfare as temporary and work-focused.
That is not what happened. In TANF’s early years, when the economy was strong and cash assistance caseloads were shrinking, states used the flexibility of the block grant to take some of the funds that had gone as benefits to families and redirect them to child care and welfare-to-work programs to further welfare reform efforts. But over time, states redirected a substantial portion of their state and federal TANF funds to other purposes, to fill state budget holes, and in some cases to substitute for existing state spending. Even when need increased during the Great Recession, states were often unable to bring the funds back to core welfare reform services and instead made cuts in basic assistance, child care, and work programs. A closer examination of states' use of funds under TANF provides a cautionary tale.
Thus, the cash assistance safety net for the nation’s poorest families with children has weakened significantly under the TANF block grant, with potentially devastating long-term consequences for children growing up in families with little or no cash income to meet basic needs. And, despite the rhetoric, few of the diverted resources have gone to work preparation or employment for the families. In their recent book, $2 a Day, authors Kathryn Edin and Luke Shaefer present a disheartening account of the human impact of states’ failure to provide a safety net for families that lose a job or are unable to find work. Instead of the success that some claim welfare reform to be, a close examination of states’ use of funds under TANF provides a cautionary tale about the dangers of block-granting core safety-net programs and providing extensive flexibility to states on using the funds.
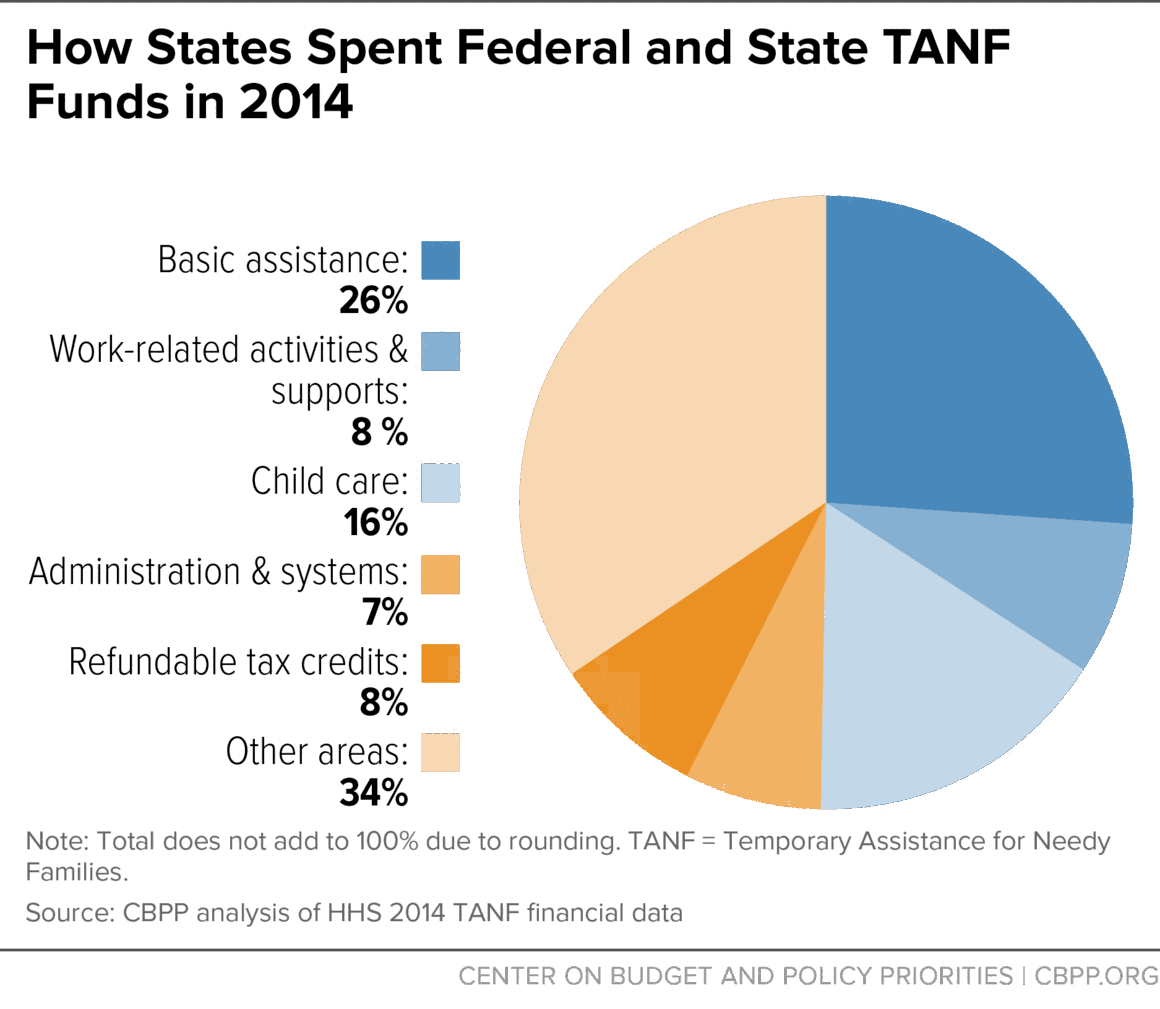
Currently, states spend only slightly more than one-quarter of their combined federal TANF funds and the state funds they must spend to meet TANF’s “maintenance of effort” (MOE) requirement on basic assistance to meet the essential needs of families with children, and just another quarter on child care for low-income families and on activities to connect TANF families to work. They spend the rest of the funding on other types of services, including programs not aimed at improving employment opportunities for poor families (see Figure 1). TANF does not require states to report on whom they serve with the federal or state funds they shift from cash assistance to other uses, let alone what outcomes they achieved. Thus, there is no evidence that giving states this broad flexibility has improved outcomes for poor families with children.
This report examines 2014 spending data to understand spending patterns nationally and to examine the wide variations across states in how TANF/MOE funds are used; fact sheets and the underlying spreadsheet that CBPP issued separately provide state-by-state information.[1] (See Box 1 for more detail about this analysis.) The report’s key findings include:
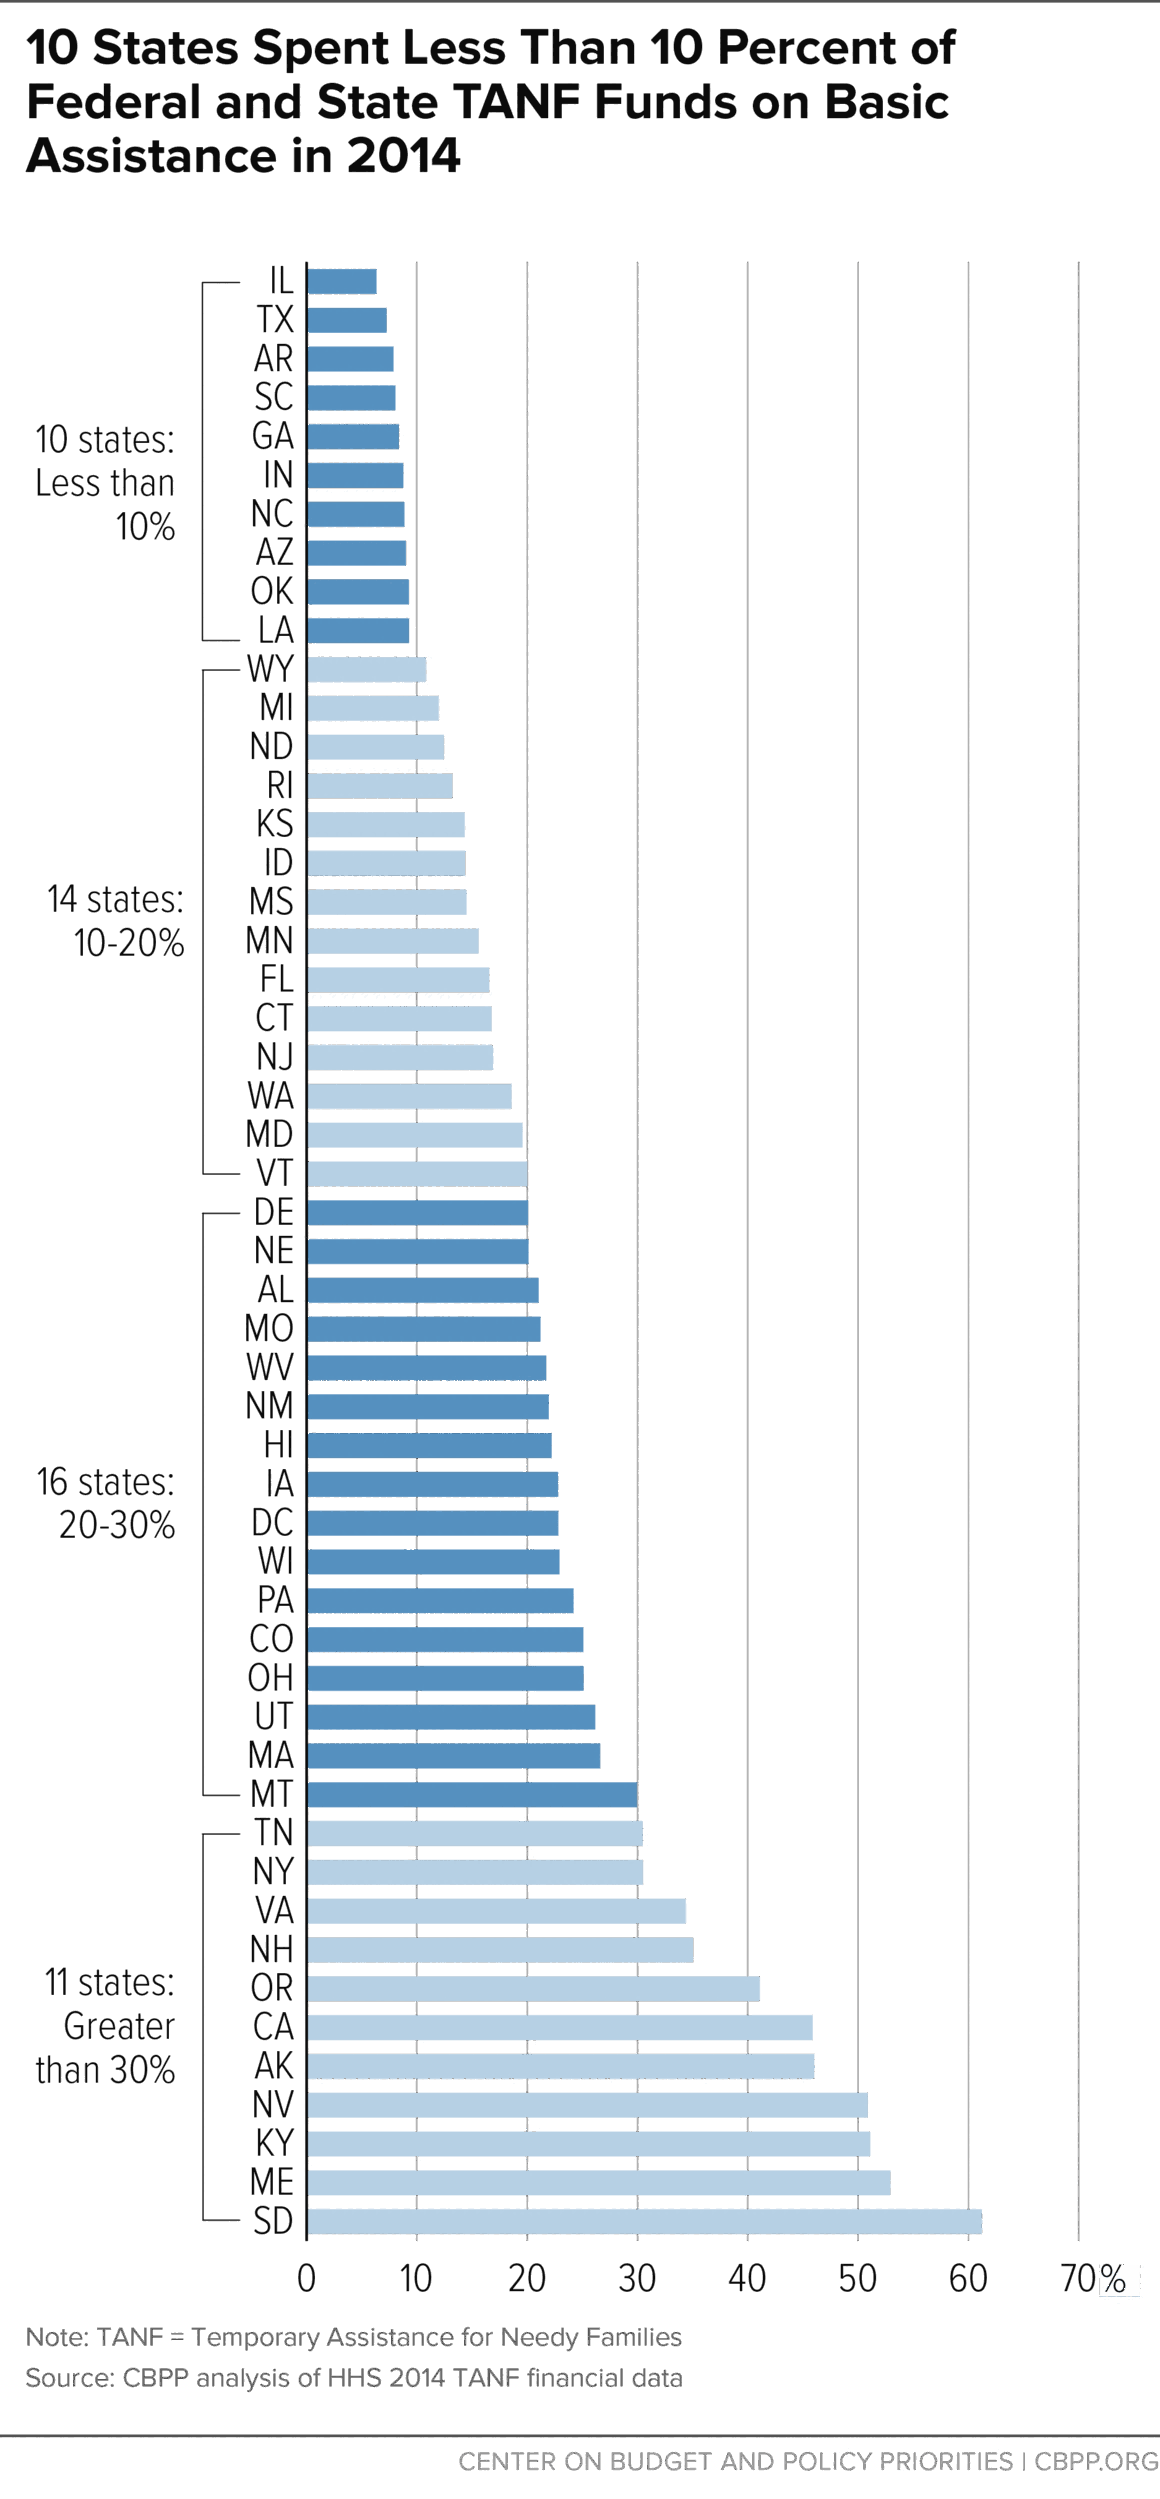
- The share of state and federal TANF spending used for basic assistance (cash welfare grants) has fallen significantly. At TANF’s onset, 70 percent of combined federal TANF and state MOE funds went for basic assistance for poor families. By 2014, that figure had plummeted to 26 percent. There is significant variation across states; ten states spent less than 10 percent of their TANF/MOE funds on basic assistance in 2014.
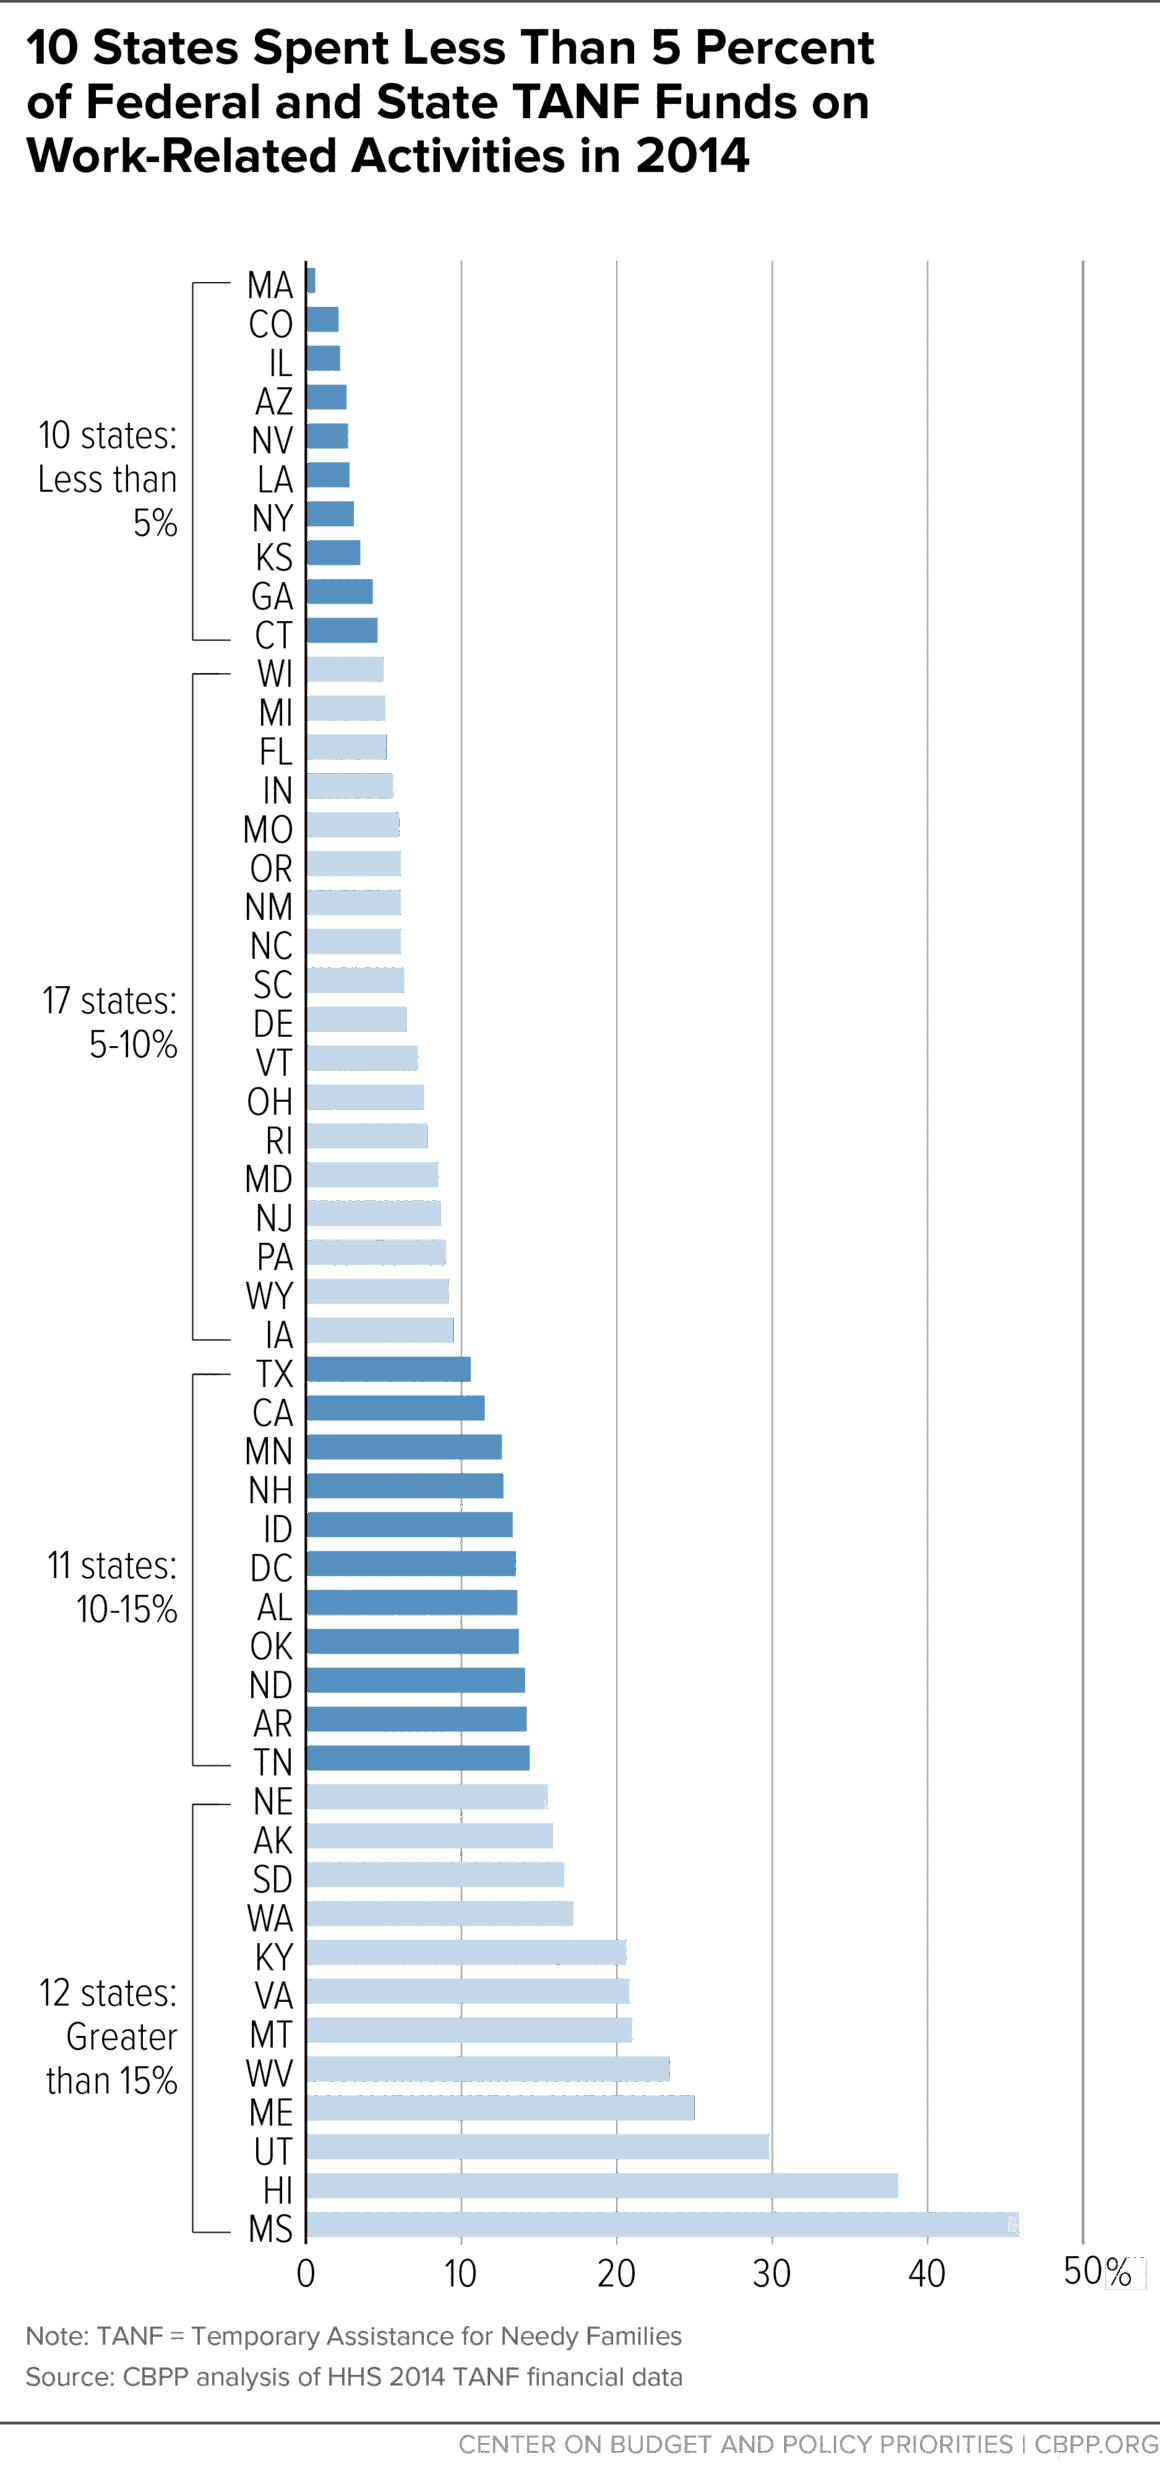
- States spend only about a quarter of their state and federal TANF dollars on child care and work activities combined. A key justification for block-granting TANF was to give states flexibility to move funding from cash assistance to work-related activities and/or supports (such as child care subsidies). States raised spending in these areas in TANF’s early years but didn’t sustain those modest increases. States used only 8 percent of their TANF and MOE funds for work activities in 2014; ten states spent less than 5 percent. States spent 16 percent of total TANF and MOE funds on child care; 15 states spent less than 5 percent.
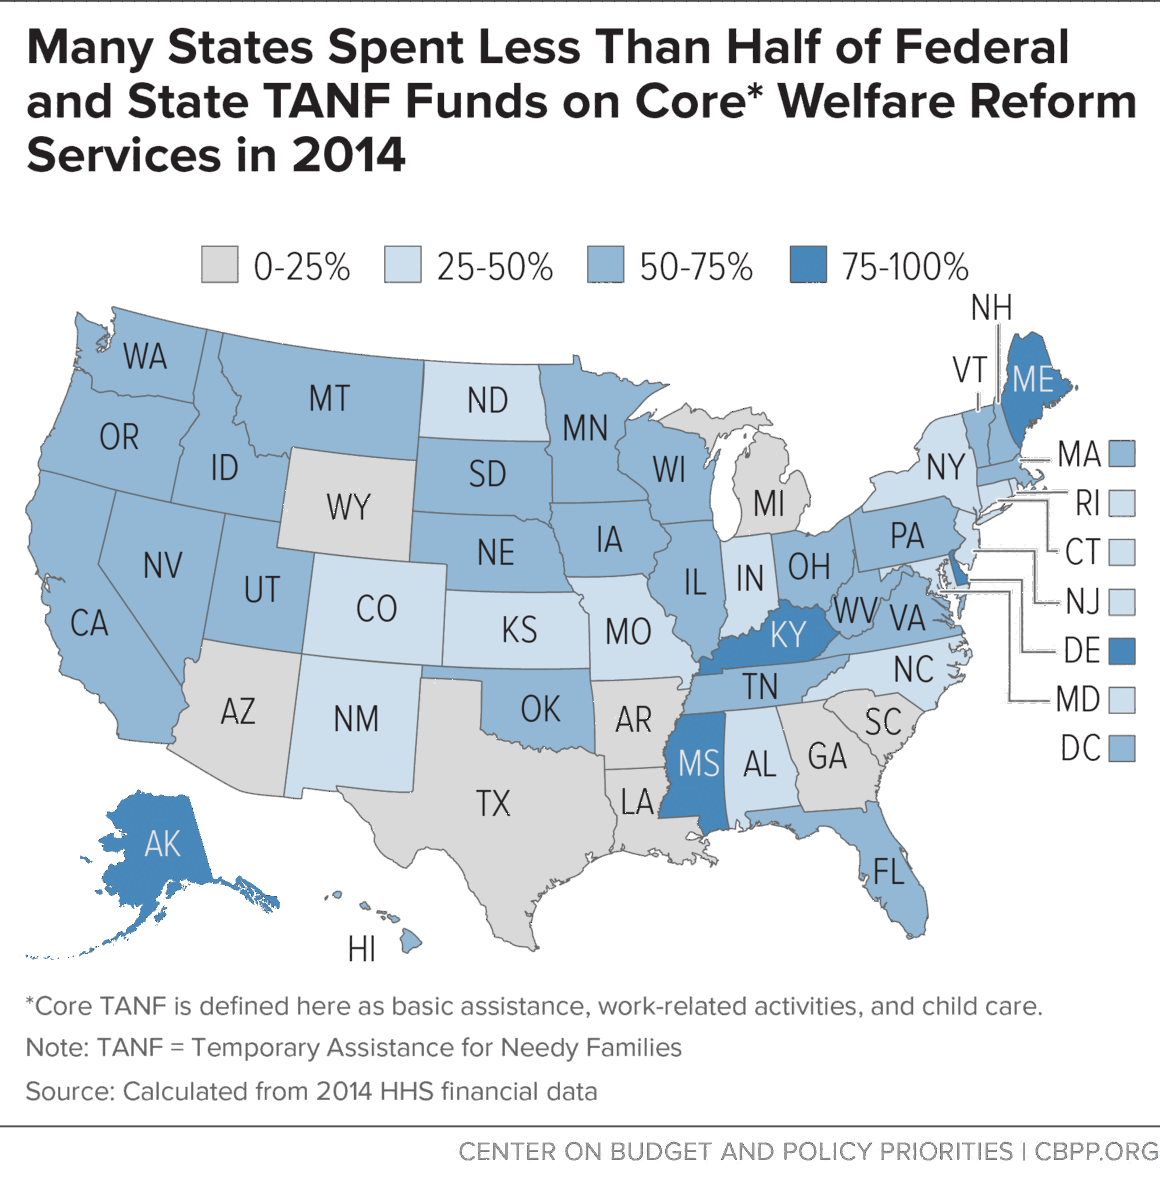
- Core welfare reform activities thus represent just half of state and federal TANF spending. Child care, work activities, and basic assistance combined totaled 50 percent of TANF and MOE spending nationally in 2014. The share varied widely across states: eight states spent less than 25 percent of these funds on the three categories, while five states spent more than 75 percent.
- States use a large and growing share of state and federal TANF funds that formerly helped poor families meet their basic needs for other state services. In some cases, states have used TANF and MOE funds to expand programs, such as state Earned Income Tax Credits (EITCs) or pre-K, or to cover the growing costs of existing services, such as child welfare. In other cases, they have used TANF/MOE funds to replace existing state funds, thereby freeing those state funds for purposes unrelated to providing a safety net or work opportunities for low-income families.
The extent to which states have used TANF or MOE funds for areas beyond the core welfare reform areas raises serious concerns. TANF’s combination of broadly defined purposes and limited accountability for much of its spending has enabled states to divert funds from supporting the poorest families and use them instead to help fill state budget holes. In addition, the annual federal TANF block grant has no adjustment for inflation and thus has eroded badly over time, losing one-third of its value since 1997. These two factors — the funds’ diminished value and broadened dispersal — have left states with fewer resources to serve needy families, especially at times of increased need, as the Great Recession and its aftermath showed.
Block grants can weaken accountability and oversight, leading states to spend significant federal funds in ways that Congress did not intend. For many states, the TANF block grant has led to a severe erosion of the cash assistance safety net and very limited fulfillment of the promise that the funds saved would support work.
Box 1: Methodology Used to Analyze TANF and MOE Spending Data
States have broad flexibility in how they spend federal and state TANF dollars for activities that meet any of TANF’s four purposes.a They are required to report quarterly and annually on how much they have spent and for what purposes; the data cited here on states’ use of TANF funds come from these reports.b
Each state reports how much TANF or MOE spending occurred during the reporting period in each of 21 categories or subcategories of spending identified on ACF Form 196 (the form states must submit to HHS). We combine these 21 categories and subcategories into six broader categories, listed below. (See Appendix II for details.)
- basic assistance;
- work-related activities and supports;
- child care (including transfers to the Child Care and Development Fund);
- administration and systems;
- refundable tax credits for low-income working families;
- other areas, which includes:
- nonrecurring short-term benefits, generally for emergency needs;
- pregnancy prevention and two-parent family formation and maintenance;
- transfers to the Social Services Block Grant;
- spending categorized as “authorized under prior law”; and
- “other nonassistance.”
States also must identify the specific funding source for each expenditure subcategory. If the state used federal funds, it must identify whether they were from the regular TANF block grant or other TANF sources (e.g., the Contingency Fund or TANF Emergency Fund). If the state used MOE funds, it must identify whether they went to a program that also received federal TANF funds or to a separate state program that did not receive TANF funds.
Our analysis uses the term “federal TANF dollars” to include expenditures from the TANF block grant plus any additional federal funds received through the TANF Contingency Fund, TANF Emergency Fund, or TANF Supplemental Grants, which 17 states received until 2012. (See Appendix I for details on the various TANF-related federal funding streams.) Our analysis also combines each state’s MOE expenditure data (rather than separating out expenditures for individual state programs). Finally, we generally combine TANF and MOE spending data rather than focus on whether the funds used for a particular purpose were TANF funds or MOE funds.
Background
The TANF block grant fundamentally altered both the structure and the allowable uses of federal and state dollars previously spent on AFDC and related programs.[2] Under TANF, the federal government gives states a fixed block grant totaling $16.5 billion each year. States that meet specified criteria may also qualify for federal “Contingency Funds”; roughly 20 states have done so for the last several years. Under the federal TANF law’s MOE requirement, states must maintain a certain level of state spending, based on a state’s spending for AFDC and related programs prior to TANF’s creation in 1996. (States are required to maintain 80 percent, or in some cases 75 percent, of their historic spending level.) In 2014, states spent $31.9 billion in combined federal TANF and state MOE funds, comprising $16.6 billion in federal TANF funds and $15.3 billion in state MOE funds.[3]
States can use their federal TANF dollars and state MOE funds to support a broad range of activities related to promoting the four purposes of TANF specified in federal law: (1) assisting needy families so children can be cared for in their own homes or the homes of relatives; (2) reducing the dependency of needy parents by promoting job preparation, work, and marriage; (3) preventing out-of-wedlock pregnancies; and (4) encouraging the formation and maintenance of two-parent families.[4]
Reduced Spending on Basic Assistance Has Weakened Safety Net
States spent $8.4 billion of federal TANF and state MOE funds on basic assistance for poor families in 2014, representing 26 percent of all TANF and MOE funds spent that year. By contrast, at TANF’s onset, states spent $14 billion on basic assistance, representing 70 percent of combined federal TANF and state MOE funds. While the strength of each state’s safety net and its benefit levels varied under AFDC, basic assistance represented the single biggest use of federal and state funds for all states.
The share of state and federal TANF funds spent on basic assistance varies widely across states, from 6 percent to 61 percent in 2014. Ten states spent less than 10 percent on basic assistance, while 11 states spent more than 30 percent (see Figure 2). Not surprisingly, the states that spend the smallest shares of their TANF/MOE funds on basic assistance generally have lower benefit levels and assist a smaller share of poor families than the typical state.[5]
California and Texas provide sharp contrasting pictures of TANF’s safety-net role. In both states, the share of poor families receiving cash assistance has fallen since 1996 and the number of families in “deep poverty,” with incomes below half of the poverty line, has increased. Both states have large populations of poor families, but the child poverty rate and the share of individuals who are food insecure are higher in Texas than in California.
California spent 46 percent of its TANF and MOE funds on basic assistance in 2014. For every 100 poor families with children in the state, 65 received TANF cash assistance. Monthly benefits for a family of three with no other income were $670 in 2014, or 41 percent of the poverty line. California’s food insecurity rate is below the national average.
Texas spent 7 percent of its TANF and MOE funds on basic assistance in 2014. For every 100 poor families with children in the state, 5 received TANF cash assistance. Monthly benefits for a family of three with no other income were $277 in 2014, or 17 percent of the poverty line. Texas’ food insecurity rate is above the national average.
Moreover, for families still receiving cash assistance, benefits have plummeted in value in nearly all states — falling 20 percent or more since TANF’s creation in 36 states, after adjusting for inflation. Today, in two-thirds of the states, benefits for a family without other cash income now fall below 30 percent of the poverty line; in one-third of the states, benefits are below 20 percent of the poverty line.[6]
Because basic assistance reaches fewer poor families and provides less to those it serves, TANF lifts fewer children out of deep poverty than AFDC did. Nationally, the number of children in deep poverty has risen by nearly 50 percent since the advent of TANF, from 1.5 million to 2.2 million.[7] Also, research suggests that the spending decline on basic assistance has contributed to a rise in “extreme poverty” (defined as income of less than $2 per person per day, a standard that the World Bank uses to measure poverty around the world). Edin and Shaefer find that the number of U.S. households with children living below this $2 threshold has doubled since TANF’s creation; among single-parent families, the number has tripled.[8]
Despite Welfare Reform Rhetoric, States Spend Little on Work Activities
A central tenet of TANF is that cash assistance should provide temporary support while a family engages in required activities to help it connect to or prepare for work. Yet most states spend little of their TANF funding on work-related activities. States initially raised spending here somewhat under TANF, but funding has been flat or fallen over the last decade. In 2014, states spent $2.6 billion in TANF and MOE funds on work-related activities, representing 8 percent of total TANF/MOE spending.[9]
As with basic assistance, states vary widely in the share of TANF and MOE spending going to work-related activities, which ranged from 1 percent to 46 percent in 2014 (see Figure 3). Ten states spent less than 5 percent of their funds in this category, while 12 states spent more than 15 percent (and one state spent more than 40 percent).
Some families receiving these employment or training services may not be receiving cash assistance; for example, this category includes transportation to work for some low-income families that have begun working and ceased receiving (or never received) cash assistance. It also includes wage subsidies, work-related activities, or education and training, some of which goes to low-income families not receiving cash assistance. While this is a permissible use of TANF or MOE funds, it means that some states are investing even less in work programs for cash assistance recipients than the numbers suggest.
Thus, despite the rhetoric of welfare reform — and the fact that many families receiving TANF have significant employment barriers and limited employment prospects — states have withdrawn funding from these activities over most of the last decade. States for the most part are not putting the funds freed up from reduced caseloads into helping TANF recipients prepare for or find work.
Child Care Needs Remain Unmet, Despite Initial Spending Increase
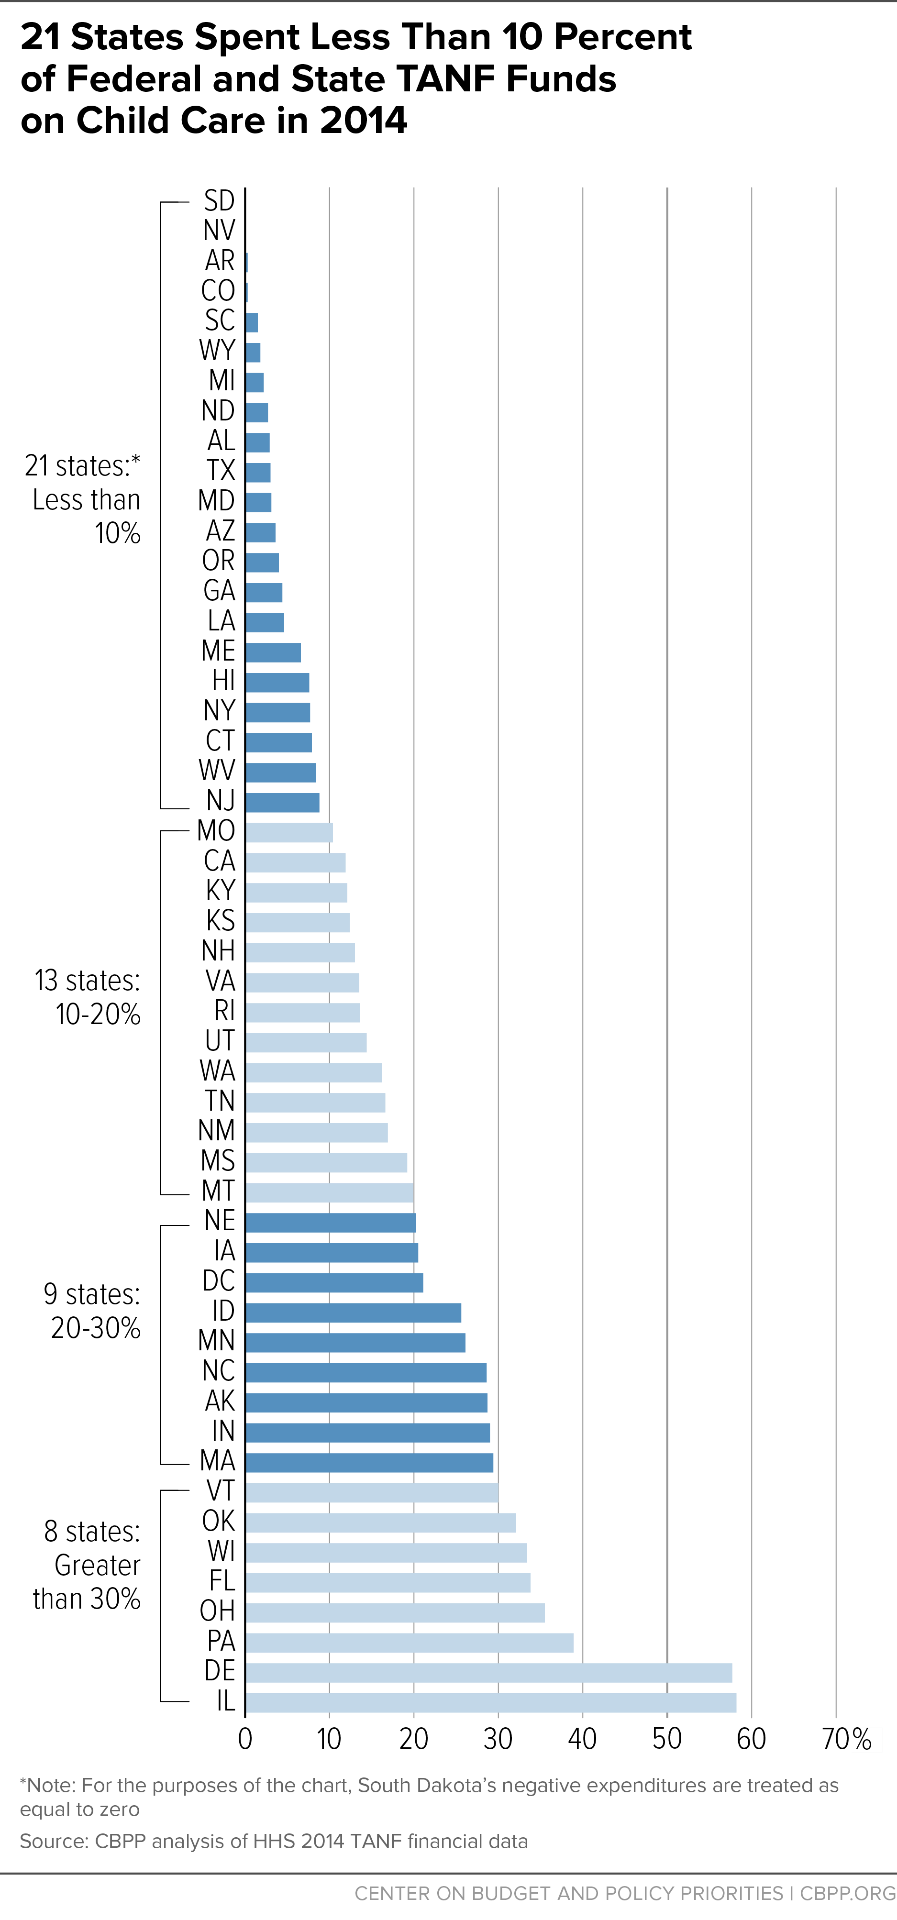
Another central tenet of welfare reform was that states could spend more of the funds on child care to support work, rather than on cash aid. TANF/MOE spending on child care rose dramatically in TANF’s early years, from $1.1 billion in 1997 to $5.9 billion in 2000.[10] However, this spending has been flat or declining for over a decade, fluctuating between $5 billion and $6 billion annually. In 2014, states spent $5.1 billion in TANF and MOE funds on child care, representing 16 percent of total TANF/MOE spending.[11]
State spending on child care varies tremendously, ranging from 0 percent to 58 percent of TANF/MOE spending in 2014 (see Figure 4).[12] Eight states spent more than 30 percent of their TANF/MOE funds on child care, two of which (Delaware and Illinois) spent more than 50 percent. At the other end of the spectrum, 21 states spent less than 10 percent of TANF/MOE funds on child care, nine of which spent less than 3 percent.
Box 2: Only Half of TANF/MOE Funds Go to Core Welfare Reform Activities
A key argument for TANF’s block-grant design was that states needed much greater flexibility over the use of the federal funds than AFDC’s funding structure provided. Under a block grant, proponents argued, states could shift the funds freed up when families left welfare for work to child care or other work supports, where need would increase. States also could invest more in work programs to reflect the increased emphasis on welfare being temporary and work-focused. Thus, one could reasonably consider the trio of basic assistance, child care, and work activities as the core areas of welfare reform spending.
In the early years of TANF, as caseloads declined, most states did increase investments in work programs and child care. But for the most part, those investments stalled or dwindled as years went by, even as more and more funds that had been spent on basic assistance were freed up as caseloads continued to decline.
Nationally, only half of TANF and MOE funds were spent on basic assistance, child care, and work programs in 2014. States vary tremendously in their combined spending on these core welfare reform categories, ranging from 15 percent to 91 percent of TANF and MOE funds in 2014. In eight states, these core categories combined account for one-quarter or less of total TANF spending.
In the aftermath of the recession, most states cut child care spending.[13] These cuts reflected more restrictive policies, not less need.[14] While some states have restored some cuts or improved child care subsidy policies in the last couple of years, the improvements have generally been modest; child care assistance continues to reach only a fraction of families in need.[15]
Spending on Working-Family Tax Credits Furthers Welfare Reform Goals
Refundable tax credits for low-income working families are an important work support and a permissible use of TANF and MOE funds. In 2014, 21 states spent a total of $2.6 billion in TANF or MOE funds for refundable tax credits, most commonly a state EITC. This represents 8 percent of national TANF/MOE spending and 16.4 percent of spending for those 21 states. Among those 21 states, the share of TANF/MOE spending going to refundable tax credits ranged from less than 1 percent to 32 percent; in seven states the share exceeded one-fifth.
Refundable state EITCs further the TANF goal of promoting work by helping working families make ends meet and stay employed. They also reduce poverty among working families, with both immediate and long-lasting benefits for children.[16] The availability of TANF or MOE funds may help support enactment (or retention) of a state EITC.
States Spend Relatively Little on Administration and Systems
In 2014, states spent $2.3 billion of TANF/MOE funds on administration and systems, representing 7 percent of total TANF/MOE spending. National spending on administration and systems has been fairly flat under TANF in nominal terms and has declined both in real terms and as a share of total spending. Under federal law, states cannot spend more than 15 percent of TANF funds on administration; most spend far less. While there is some variation across states, this may reflect different state approaches to what costs to include in administration. Variations over time may also reflect significant systems costs that a state incurs for a limited time as a result of computer systems changes.
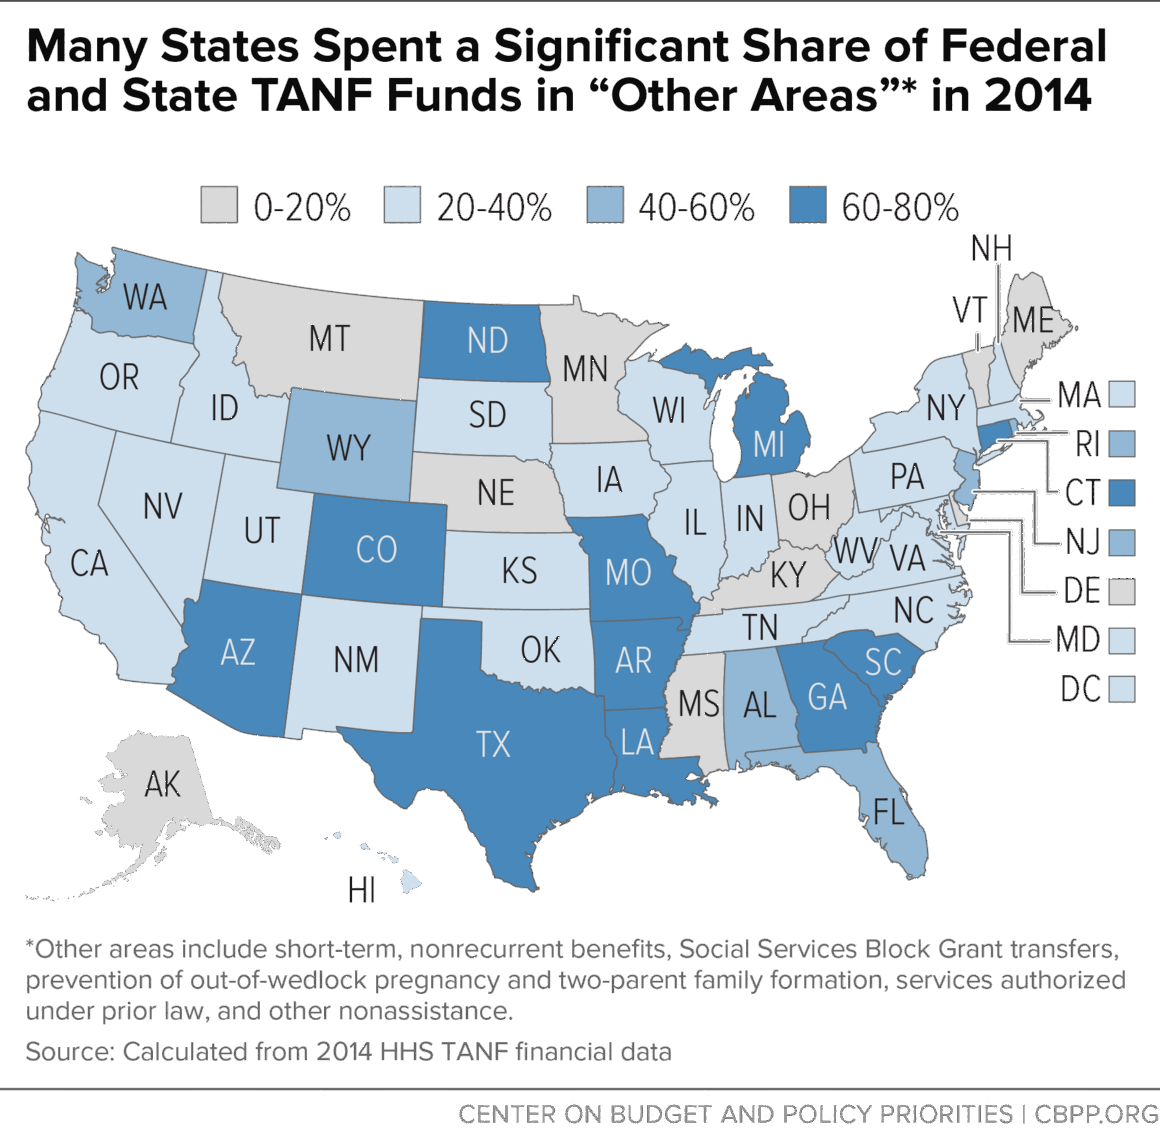
States Spend One-Third of TANF and MOE Funds in Other Areas
The rest of state and federal TANF spending — nearly $11 billion in 2014, representing one-third of the total — goes to other areas, including child welfare, emergency assistance, early education, teen pregnancy prevention, and marriage support. The share of TANF/MOE spending going to these other areas varies greatly across states, ranging from 4 percent to 80 percent, but exceeds 50 percent in 14 states (see Figure 5). (These figures include “excess MOE,” or state spending beyond TANF’s minimum requirements, which has increased in recent years and can distort the state spending picture, as explained below. See Box 3 and Appendix I.)
Many, if not all, of the programs and services in these other areas are worthy and important investments. Nonetheless, the question remains whether state and federal TANF funds — rather than other state funds — should be used for them, particularly when the average state spends only around half of its TANF/MOE funding to provide a cash assistance safety net, connect welfare families to work, or provide child care help to low-income working families.
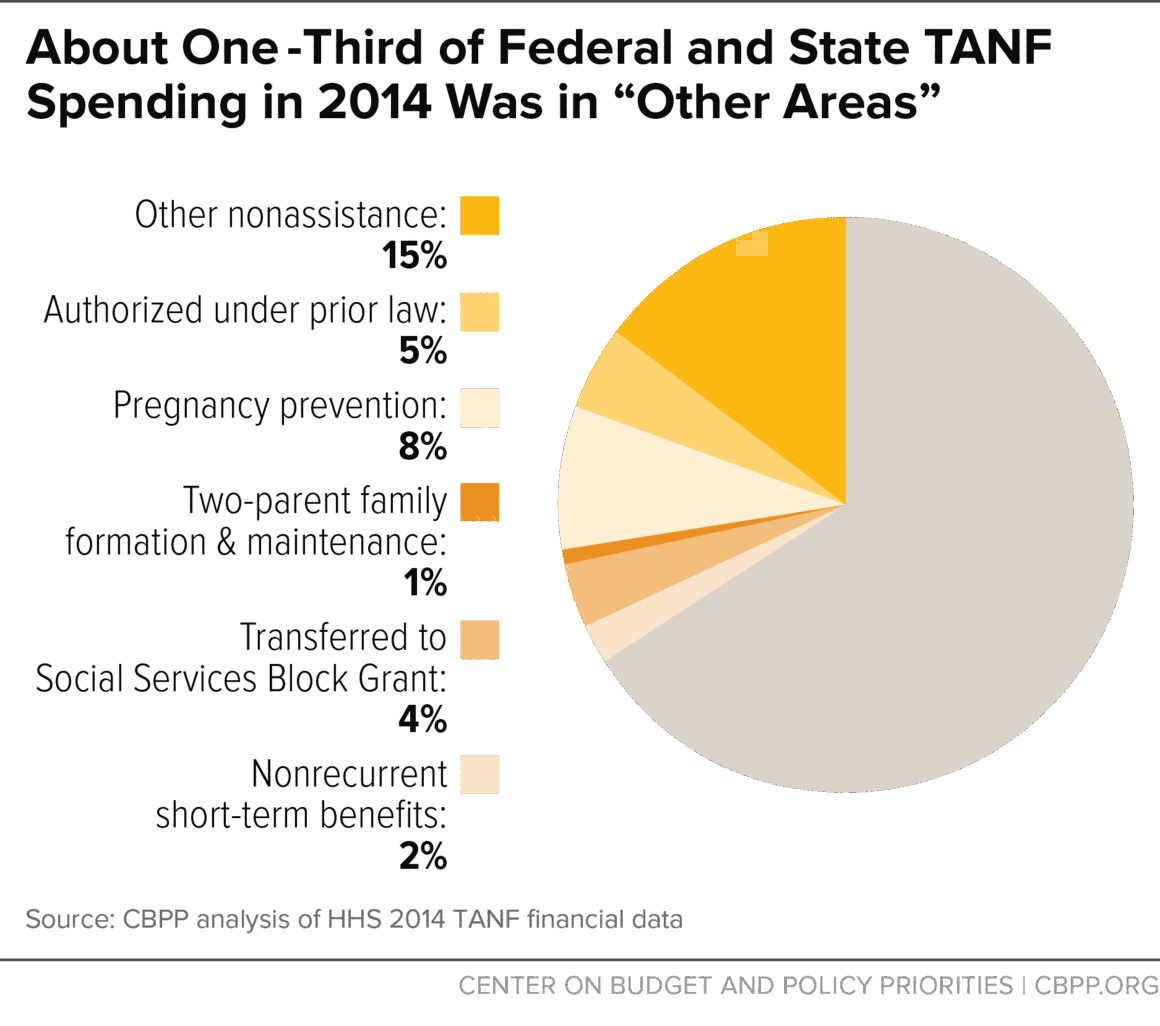
Kinds of Spending in “Other Areas”
States report how much they spent in TANF and MOE funds for each of 21 spending categories as required by the Department of Health and Human Services (HHS). In this analysis, we combine a number of these categories into a category we label “other areas.” (See Figure 6 for the relative share of each of these categories.) This category includes:
- “Other nonassistance.” This consists of TANF/MOE spending that falls within the four purposes of TANF but doesn’t fit in another spending category for reporting purposes and doesn’t fall within the definition of “assistance.” It covers a broad range of uses, including child welfare, parenting training, substance abuse treatment, domestic violence services, and early education. In 2014, states spent $4.7 billion on other nonassistance, representing 14.7 percent of total TANF and MOE spending nationally. “Other nonassistance” ranged from less than 1 percent to 77 percent of TANF/MOE spending, depending on the state.
- Spending “authorized under prior law” (AUPL). This is spending that is not within the four TANF purposes but is a permissible use of federal TANF funds (though not state MOE funds) because it supports a service that was in the state’s AFDC Emergency Assistance plan when TANF replaced AFDC. The majority of spending here is for child welfare services, but AUPL also includes certain juvenile justice spending as well as some foster care activities for children who don’t live with parents or relatives. In 2014, states spent $1.4 billion of federal TANF funds on AUPL, representing 5 percent of total TANF/MOE spending. Half the states reported spending in AUPL, ranging from zero to 50 percent of their TANF/MOE spending.
- Preventing out-of-wedlock pregnancies (TANF purpose 3). This includes abstinence programs, visiting nurse services, and services for youth such as teen pregnancy prevention, counseling, and after-school programs. Often, states cite this purpose as the basis for their use of TANF or MOE funds for early education (although some states report such spending as “other nonassistance” instead). In 2014, states reported spending $2.6 billion for this purpose, representing 8 percent of total TANF/MOE spending nationally. Two-thirds of states reported TANF or MOE spending for this purpose in 2014, ranging from under zero to more than 60 percent of their TANF/MOE spending.
Figure 6 - Encouraging two-parent families (TANF purpose 4). This includes a range of healthy marriage initiatives such as parenting skills training, premarital and marriage counseling, and mediation services. It also includes initiatives to promote responsible fatherhood and help fathers provide emotional and financial support to their children through job placement and training services for noncustodial parents. In 2014, almost half the states reported spending under this purpose, totaling $258 million and representing less than 1 percent of total TANF/MOE spending nationally.
- Nonrecurrent short-term benefits. This includes short-term aid (often a one-time benefit) covering no more than four months’ worth of need. It could consist of emergency help with rent, utilities, or car repairs or an initial lump-sum “diversion payment” that a family may receive in lieu of ongoing cash assistance. In 2013, states spent $716 million in this area, representing 2 percent of TANF/MOE spending.
- Transfers to the Social Services Block Grant (SSBG). Thirty-eight states transferred $1.2 billion in federal TANF funds to SSBG in 2014, representing 4 percent of states’ total TANF/MOE spending. TANF funds transferred to SSBG can be used in any way that SSBG permits but must be spent on programs and services for children or families with incomes below 200 percent of the poverty line.
State Examples of Spending in “Other Areas”
Connecticut
In 2014, Connecticut spent over $300 million in “other areas,” representing nearly two-thirds of its state and federal TANF spending — almost twice the share of the nation as a whole. Most of the spending was for child welfare services and early education, as the state used TANF or MOE funds to free up other state funds for uses unrelated to the core purposes of TANF:
- Child welfare. More than $100 million went to the Department of Children and Families for various child welfare-related programs and services. Of this, $56 million was targeted for case management services and $34 million for investigations. Additional programs within DCF accounted for another $14 million.
- School readiness. Some $76 million went to the Department of Education for preschool for children ages 3-5 living in economically disadvantaged communities with family incomes below 75 percent of the state median — that is, below about $65,000 a year for a family of three (more than three times the federal poverty level). Another $31 million went to the Department of Education for other education initiatives.
- Other expenditures. Connecticut’s remaining spending in “other areas” was spread across numerous programs, mostly outside the state TANF agency. Some $19 million, for example, went to the Department of Corrections for addiction services for non-custodial parents. Another $16 million went to the Department of Mental Health and Addiction Services to serve special populations, targeting young adults (including sex offenders).
Connecticut claimed a modest amount of “excess MOE” in 2014 — $47 million above the minimum 75 percent MOE requirement — so only a portion of the $313 million spending in other areas could be considered “excess MOE.” Largely, Connecticut is an example of a state using most of its TANF money for programs and services outside core welfare reform areas.
Box 3: Some “Other Areas” Spending May Reflect “Excess” MOE
States must spend at least 80 percent of their historic state AFDC spending to meet TANF’s MOE requirement or face a fiscal penalty; the threshold is lowered to 75 percent in a year the state meets its TANF work participation rate. (See Appendix I for additional discussion.) Since the Deficit Reduction Act of 2005 made it harder for states to meet their TANF work participation rate requirements — thereby threatening some states with the loss of some federal TANF funds due to penalties — a number of states have found it advantageous to claim as MOE certain existing expenditures they hadn’t previously claimed. States with MOE spending exceeding their minimum MOE requirement can obtain a “caseload reduction credit” that lowers their work participation rate requirement. Claiming excess MOE also helps a state qualify for additional federal money from the TANF Contingency Fund.
Thus, since 2006, total MOE spending across states has risen above the minimum required levels, with 39 states reporting MOE over 80 percent in 2014. This increase does not necessarily represent an increase either in underlying state spending or in benefits or services for low-income families. Some of the reported MOE may represent existing state spending or existing third-party spending (such as by food banks or domestic violence shelters) that the state hadn’t previously counted as MOE.
Some states have moved aggressively to claim existing expenditures as MOE, whether expenditures in other state agencies or by third parties. In some instances, these expenditures help increase a state’s MOE above the minimum requirements. In other instances, they enable states to withdraw substantial state funds they had used for TANF purposes while still meeting their MOE requirement.
In analyzing a state’s TANF and MOE expenditures, therefore, it is important to understand the extent to which they may be part of an “excess MOE” strategy. For example, compare New Jersey with Louisiana.
- New Jersey spent $595 million in “other areas,” representing 46 percent of its TANF/MOE spending. The state claimed 216 percent MOE in 2014, $563 million over its 75 percent MOE requirement. While New Jersey claimed a large amount of MOE in other areas, all but $32 million could be considered “excess MOE,” and represent the claiming of existing state spending as MOE rather than a massive diversion of TANF and MOE funds to other uses.
- Louisiana spent $145 million in “other areas,” representing two-thirds of its TANF/MOE spending. Louisiana spent only the amount needed to meet its 75 percent MOE requirement so none of this spending in other areas can be considered “excess MOE,” which means that all of the “other areas” spending represented a diversion of TANF and MOE funds to other uses.
Louisiana
In 2014, Louisiana spent some $145 million, or two-thirds of its state and federal TANF spending, in “other areas.”[17] Most went for child welfare services, early education, and financial aid for college students. Louisiana used TANF funds to supplant state spending or to cover the cost of expansions that otherwise would have required state spending, freeing the up funds for other uses unrelated to the purposes of TANF, including tax cuts.
- Child welfare. Some $36 million went for child welfare, including child protective investigations and family services. Another $4.4 million went to providing court-appointed advocates for children placed (or at risk of placement) in foster care.
- Early education. Some $36 million went to the state’s pre-kindergarten program.
- Financial aid. Some $27 million went to the Office of Student Financial Aid Assistance for financial aid to students in post-secondary education.
- Other expenditures. Drug courts received $6 million and substance abuse programs received another $3 million. Other programs received smaller amounts.
Louisiana claimed no “excess MOE” in 2014, so it is another example of a state using most of its TANF funds for programs and services outside core welfare reform areas.
Lessons from Spending Experience Under TANF Block Grant
The track record of state spending under TANF offers broader lessons about the risks of block-granting core programs for low-income families and giving states greater decision-making authority. States’ flexibility under TANF has enabled them to divert funds from supporting needy families and use them to fill state budget holes. The bulk of funds withdrawn from the cash assistance safety net — which had been the primary use of AFDC funds — have not gone to programs that connect families to work or to support low-income working families. States sharply reduced the cash assistance safety net when the economy was strong, and then failed to reinvest in those areas when the economy weakened and need increased.
Under TANF, states generally bear the financial burden of meeting increased need for cash assistance when the economy slows or the low-income population grows for other reasons, but many states have not been willing to shoulder that burden. As a result, TANF did not provide an effective safety net in response to the recession. In fact, many states cut spending on basic assistance, work programs, and child care even while continuing to divert much of their TANF or MOE funding to other areas of the state budget.
Key lessons from the TANF experience include:
-
Maintaining a strong safety net for the most disadvantaged families and children has not been a priority for most states. Block-grant proponents often argue that states are better than the federal government at determining how to help families in need. Yet under TANF, many states shifted substantial amounts intended to help poor families to other uses, often leaving many of the most disadvantaged families without much of a safety net — and without the employment resources that might help them gain a foothold in the labor market. In every state, TANF plays a markedly smaller role in providing cash assistance to help very poor families meet basic needs than AFDC did. Moreover, states have used only a modest share of their TANF resources to help individuals find employment, and few have invested the necessary resources to help poor parents with the most serious employment barriers find and maintain work.
-
States have not used the flexibility of the block grant for successful innovation in connecting families to work. Experience has not borne out proponents’ claims that block-granting would enable states to become laboratories for developing new ways to help recipients move from welfare to work. AFDC’s waiver structure required formal evaluation to credibly test whether new approaches had a measurable impact on employment and earnings, but this has not happened under TANF for the most part. Some states have volunteered for rigorous evaluations, but most such evaluations have been relatively narrowly defined; none have involved the level of innovation and experimentation that occurred under the AFDC waiver experiments.
The result is that, 19 years after TANF’s creation, we still have no rigorous evidence to inform debates about expanding work requirements to other programs. Similarly, because few states have implemented innovative employment strategies for families with substantial personal and family challenges, we still have very limited knowledge about how to significantly improve their employment outcomes. In short, states had an opportunity to innovate and rigorously evaluate new approaches to service delivery, but that is not the path they chose.
-
A block grant is incompatible with providing core safety net assistance for poor families. Safety-net needs rise and fall with the economy. More jobs are available during good economic times than bad ones. Under a block grant with fixed funding that does not rise and fall with need, states bear all the financial burden of responding to increased need. And because states must balance their budgets even during recessions, they generally have been unable or unwilling to provide much added help when need increases — often choosing instead to reduce assistance to needy families even as poverty and hardship are swelling.
Moreover, block grants that (like TANF) aren’t adjusted for inflation lose substantial purchasing power over time. Even inflation-adjusted block grants may not address increased need due to a rise in a state’s poor population from economic or other circumstances, or cost increases that outpace general inflation (such as rise in health care costs if Medicaid were block-granted).
-
There is substantially less accountability for federal funds under a block grant than under other shared federal-state funding arrangements. The TANF block grant gave states substantial flexibility and limited reporting requirements. States’ tremendous flexibility to use TANF funds for purposes other than core welfare reform goals has meant that Congress has sent significant funding to states with little accountability or even knowledge about how states use much of it. States are required to report how they spend their federal TANF block grant dollars and how they meet their MOE requirement, but they must provide detailed data only on those program recipients who receive cash assistance — and cash assistance constitutes a relatively small part of TANF/MOE spending. States do not need to report on whom they serve with the federal or state funds they shift from cash assistance to other uses.
Moreover, the allocation of TANF block grant dollars across the states hasn’t changed since the program’s creation, despite changes in population growth and state economic conditions. This means that over time, federal funds increasingly have not been distributed in a manner that best furthers TANF’s purposes.
- TANF’s MOE requirement hasn’t prevented states from using the flexibility of the block grant to supplant state funds. States and the federal government shared the cost of AFDC. TANF’s MOE requirement was intended to ensure that states maintained most of their historic effort by contributing their own funds to programs for poor families, in addition to the federal block grant funds. At the same time, both the federal and state TANF funds could be used much more broadly and could include many programs or services that previously were (or would have been) funded by state dollars, outside of AFDC. Despite explicit provisions in the law intended to limit the extent to which a state could use federal TANF funds to just replace state funding, supplanting has occurred. And, despite provisions in the law designed to limit the extent to which states could simply claim existing state spending outside of core welfare reform as MOE, a significant amount of state MOE is in other areas of spending. The result is that many states have used the block grant funds for fiscal relief rather for furthering the core goals of TANF. While some of these issues are specific to the design of TANF, they illustrate how difficult it is for a block grant to avoid supplantation.
TANF’s combination of broadly defined purposes and limited accountability for much of its spending has enabled states to divert funds from supporting the poorest families and use them instead to help fill state budget holes. In addition, the federal TANF block grant has no adjustment for inflation and thus has eroded badly over time, losing one-third of its value since 1997. These two factors — the funds’ diminished value and broadened dispersal — have left states with fewer resources to serve needy families. Changes in TANF could increase state accountability and refocus the funds on the core welfare reform purposes that Congress intended. Moreover, the lessons of TANF spending patterns should provide a cautionary tale for proposals to restructure other means-tested programs along similar lines.
Appendix I: Funds Available to States Under the TANF Block Grant
Federal Funding
Each state receives a fixed annual amount of federal TANF funding, technically known as the State Family Assistance Grant but generally referred to as the TANF block grant. The total amount of federal block grant funds available to all states each year is $16.5 billion.[18] The TANF block grant allocations are set for each state in accordance with the 1996 welfare law, based on the amount of federal funding that the state had received in AFDC and related programs before 1996. Each state’s annual block grant amount has remained unchanged since TANF’s creation. Because states can carry over unspent TANF funds to use in future years, the amount of federal TANF funds that a state spends in a given year may vary.
A state can transfer up to 30 percent of its block grant funds per year to the Child Care and Development Block Grant (CCDBG) and up to 10 percent to the Social Services Block Grant (SSBG), as long as the total amount transferred doesn’t exceed 30 percent. Transferred funds are subject to the rules of the program to which they are transferred, not to TANF rules. Funds transferred to SSBG must be spent on programs and services for children or families with incomes below 200 percent of the poverty line.
In addition to the basic block grant, some states can receive additional TANF federal funds from the TANF Contingency Fund. Congress created this $2 billion fund in the 1996 welfare law to provide additional help to states in hard economic times. States made little use of it until the latest recession, but they began to draw on it in 2008, and nearly half of the states have done so since then. After the original $2 billion provided in 1996 was depleted early in fiscal year 2010, Congress has added limited funds for each year; qualifying states have received only part (less than half) of the amount for which they qualified each year since 2010.
In past years, states also received additional TANF funds from sources that have since expired:
- Supplemental Grants: Congress created these in tandem with the TANF block grant to help two groups of states disadvantaged by the block grant formula’s reliance on states’ AFDC spending levels in the mid-1990s: states with high population growth and states that had provided very low cash assistance benefits under AFDC. Seventeen states received a Supplemental Grant amount each year from TANF’s inception through 2011; Congress reduced these grants by about one-third in 2011 and failed to fund them at all for fiscal year 2012 and thereafter.[19]
- Emergency Fund: Congress created a $5 billion TANF Emergency Fund as part of the 2009 Recovery Act to reimburse states for 80 percent of their increased TANF or MOE spending in 2009 or 2010 on basic assistance, short-term nonrecurring benefits, and subsidized employment. Every state but Wyoming received support from the fund before it expired on September 30, 2010, with the $5 billion almost fully spent.
- High-Performance Bonus: Through 2004, states could receive additional federal TANF funds for strong performance in meeting the objectives of TANF. During the fund’s existence, $200 million in funding was available each year.
While now expired, these funding streams are considered TANF spending and are included in the federal TANF spending data for years in which states used them.
State Maintenance-of-Effort Funding
Each year, states are required to meet a maintenance-of-effort (MOE) obligation under the TANF block grant or face a fiscal penalty. (The statute refers to this spending as “qualified state expenditures” but common usage is “state MOE.”) Each state’s MOE amount is based on its historical spending, defined as its 1994 financial contribution to AFDC and related work programs. To meet its MOE obligation, a state must report spending at least 80 percent of this historical spending level; this minimum share falls to 75 percent for any year in which a state meets its TANF work participation rate requirement.
The fact that the MOE requirement is only 75 percent or 80 percent of a state’s historical spending, rather than the full 100 percent, itself allowed states to withdraw part of the funds they had spent on AFDC and related programs.[20] Moreover, a state’s MOE requirement is based on its 1994 expenditure level, with no adjustment for inflation over the 21 years since then.
Expenditures that qualify as MOE include state and local government spending or other “third-party” spending that benefits members of needy families and meets one of TANF’s four purposes.[21] Examples of qualifying third-party expenditures include spending by food banks or domestic violence shelters on TANF-eligible families. Third-party MOE also can include in-kind contributions, such as volunteer hours or employer-provided supervision and training for people in subsidized jobs.
States can count expenditures for a broad range of activities as MOE. So, to ensure that states maintain a meaningful financial commitment to TANF, the 1996 welfare law imposed a “new spending” test on MOE: spending that a state counts toward MOE that occurs outside of its prior AFDC and related expenditures must represent an increased level of spending compared to what the state spent on that item in 1995.[22] Some states have created programs that did not exist in the state in 1995, such as a refundable Earned Income Tax Credit (EITC), and counted the spending for these programs as MOE, or have increased spending in previously existing programs over 1995 levels. (HHS has ruled that third-party non-governmental spending that a state claims as MOE is not subject to the “new spending” test.)[23]
MOE expenditures must occur during the year for which the state claims them; states cannot carry them over to a future year. MOE expenditures can come from any area of the state budget and are not limited to spending by the TANF agency. MOE spending, however, must be an actual expenditure, not simply forgone revenue; thus, a state can count the refundable portion of a state EITC as MOE but not the portion that simply reduces the amount of income tax owed to the state.
How States May Use TANF and MOE Funds
In general, states must spend TANF and MOE funds on activities that further one of TANF’s four purposes: assisting needy families so that children can be cared for in their own homes; reducing the dependency of needy parents by promoting job preparation, work, and marriage; preventing out-of-wedlock pregnancies; and encouraging the formation and maintenance of two-parent families.
Within this framework, TANF rules give states and their partners nearly total discretion about program design, as long as the activities benefit “needy” families (exceptions to this “needy family” requirement are discussed below). States can set their own definitions of “need” and can use different eligibility limits for different types of benefits or services. For example, a state might set a very low eligibility level for TANF cash assistance but also use TANF or MOE funds to provide refundable state EITC or child care subsidies to families up to a higher income level, such as 200 percent of the poverty line.
When a state uses TANF or MOE funds to provide “assistance” to families, certain consequences — such as time limits, federal work participation rates, data reporting, and child support assignments — follow, though these consequences may depend upon exactly how funding is configured.[24] Federal TANF rules define “assistance” as ongoing benefits that meet basic needs.
While there is substantial overlap in the permissible uses of federal TANF and state MOE funds, there also are some differences. Key differences that are relevant for the spending trends analyzed in this report are:[25]
- Transfers: States may transfer TANF funds, but not MOE funds, to CCDBG or SSBG.
- Spending authorized under prior law: States may use TANF funds to help support certain Emergency Assistance programs under Title IV-A of the Social Security Act that federal law previously allowed states to support with AFDC funds, even if this spending does not meet one of the four purposes of TANF. This grandfathering provision does not apply to MOE funds.
- Spending under purposes 3 and 4 of TANF: States may use TANF funds for activities meeting the third and fourth purposes of TANF — preventing out-of-wedlock pregnancies and encouraging the formation and maintenance of two-parent families — without regard to whether the recipients are needy or are in eligible families, as long as the spending is not considered “assistance.”[26] Thus, TANF spending under these purposes can go for childless adults, or for broad populations, without regard to income. In contrast, state MOE funds spent under purposes 3 and 4 can only be used for eligible, needy families, except for the Healthy Marriage or Responsible Fatherhood activities set forth in the TANF law.[27]
- Circumstances when MOE can be used more broadly than TANF: If states keep MOE funds separate from TANF funds, they can use them without regard to some restrictions that apply to TANF funds, such as the federal 60-month time limit, certain restrictions on recent legal immigrants, and certain disqualifications (e.g., of fleeing felons). States can also use MOE funds but not TANF funds for medical services.
Since states generally draw on both TANF and MOE funds for many areas of spending, the funding is somewhat fungible, allowing states to shift funding as necessary to comply with any restrictions.
| Appendix II: CBPP Groupings of Federal TANF Reporting Categories | |
|---|---|
| CBPP Category | Federal Reporting Categories |
| Basic Assistance | Basic Assistance |
| Administration and Systems | Administration |
| Systems | |
| Work-Related Activities and Supports | Work Subsidies |
| Education and Training | |
| Other Work Activities/Expenses | |
| Transportation and Other Supportive Services – Assistance Transportation – Nonassistance (includes subcategories) | |
| Individual Development Accounts | |
| Child Care | Child Care - Assistance Child Care - Nonassistance |
| Transferred to Child Care and Development Fund | |
| Refundable Tax Credits | Refundable Earned Income Tax Credit |
| Other Refundable Tax Credits | |
| Other Areas | Nonrecurrent Short-Term Benefits |
| Prevention of Out-of-Wedlock Pregnancies | |
| Two-Parent Family Formation and Maintenance | |
| Transferred to Social Services Block Grant | |
| Authorized Solely Under Prior Law — Assistance* Authorized Solely Under Prior Law — Nonassistance* |
|
| Other Nonassistance | |
End Notes
[1] “State Fact Sheets: How States Have Spent Federal and State Funds Under the TANF Block Grant,” Center on Budget and Policy Priorities, updated October 2, 2015, https://www.cbpp.org/research/family-income-support/state-fact-sheets-how-states-have-spent-federal-and-state-funds-under.
[2] Appendix I provides background on the TANF funding structure. Additional detail is also available in Liz Schott et al., “How States Have Spent Federal and State Funds under the TANF Block Grant,” Center on Budget and Policy Priorities, August 8, 2012, https://www.cbpp.org/research/how-states-have-spent-federal-and-state-funds-under-the-tanf-block-grant. See also, “Temporary Assistance for Needy Families: Spending and Policy Options,” Congressional Budget Office, January 21 2015, http://www.cbo.gov/publication/49887.
[3] Federal spending may vary from year to year as states can carry over some of their unspent federal TANF dollars to a subsequent year. The federal TANF funds are primarily the annual fixed block grant amount (the State Family Assistance Grant, or SFAG) but also include funding from the TANF Contingency Fund that 20 states received in 2014. See additional detail in Appendix I. Many states spend more than the required minimum MOE requirement; see further discussion in Box 3.
[4] States may also spend funds on activities that they supported with Emergency Assistance funds prior to 1996 even if the activities do not fall under one of these four TANF purposes. Spending under this grandfathered authority is reported as “authorized under prior law” (AUPL).
[5] For information on the ratio of families receiving TANF to the number of families in poverty, by state and for the United States as a whole, see Ife Floyd, LaDonna Pavetti, and Liz Schott, “TANF Continues to Weaken as a Safety Net,” Center on Budget and Policy Priorities, June 16, 2015, https://www.cbpp.org/research/family-income-support/tanf-continues-to-weaken-as-a-safety-net.
[6] Ife Floyd and Liz Schott, “TANF Cash Benefits Have Fallen by More Than 20 Percent in Most States and Continue to Erode,” Center on Budget and Policy Priorities, October 14, 2015, https://www.cbpp.org/research/tanf-cash-benefits-have-fallen-by-more-than-20-percent-in-most-states-and-continue-to-erode.
[7] Arloc Sherman and Danilo Trisi, “Deep Poverty Among Children Worsened in Welfare Law’s First Decade,” Center on Budget and Policy Priorities, July 23, 2014, https://www.cbpp.org/files/7-23-14pov2.pdf.
[8] H. Luke Shaefer and Kathryn Edin, “The Rise of Extreme Poverty in the United States,” Pathways, Summer 2014, http://web.stanford.edu/group/scspi/_media/pdf/pathways/summer_2014/Pathways_Summer_2014_ShaeferEdin.pdf. See also, Kathryn J. Edin and H. Luke Shaefer, $2 a Day: Living on Almost Nothing in America, 2015.
[9] For this analysis, we combined six different federal-reporting subcategories into a work-related activities category: work subsidies, education and training, transportation and supportive services (assistance), transportation (nonassistance), Individual Development Accounts, and other work activities. (See Appendix II.) Nationally, most of the TANF and MOE spending in this category is reported in the broad “Other work activities” subcategory; a smaller share is spent on activities and services such as education and training or transportation to help low-income parents commute to a job or work program.
[10] Recognizing the importance of child care to support work, the 1996 welfare law created a new Child Care Development Fund under the Child Care and Development Block Grant (CCDBG), which provided an additional $5 billion a year for child care in federal mandatory and discretionary spending. The law also allows states to transfer some of their TANF block grant dollars to CCDBG (up to a cap). In addition, under TANF, states can spend TANF or state MOE funds directly on child care (without having to transfer the funds to CCDBG and without any cap or limit) since spending on child care for needy families furthers the TANF goal of connecting families to work. States need not limit child care assistance financed by TANF and MOE funds to families that receive cash assistance; states can also use these funds for families that have left TANF for work or other low-income working families.
[11] For this analysis, we look at trends in state use of TANF/MOE funds for child care, including TANF funds transferred to CCDBG, but not other federal funds such as those directly appropriated to CCDBG.
[12]At times, a state may report negative spending in a category for a year; for example, South Dakota reported negative spending in child care for 2014. Negative spending can occur when a state reports adjustments in expenditures for prior years. For maps, figures, and text in this report and the accompanying fact sheets, negative expenditures are treated as zero; the negative expenditure amounts reported to HHS are included in the accompanying spreadsheet.
[13] Stephanie Schmit and Rhiannon Reeves, “Child Care Assistance in 2013,” CLASP, March 2015, http://www.clasp.org/resources-and-publications/publication-1/Spending-and-Participation-Final.pdf.
[14] Karen Schulman and Helen Blank, “Turning the Corner: State Child Care Assistance Policies 2014,” National Women’s Law Center, 2014, http://www.nwlc.org/resource/turning-corner-state-child-care-assistance-policies-2014. See also, Karen Schulman and Helen Blank, “Downward Slide: State Child Care Assistance Policies 2012,” National Women’s Law Center, 2012, http://www.nwlc.org/resource/downward-slide-state-child-care-assistance-policies-2012. These annual reports review changes from February to February, thus straddling federal fiscal years in the year-to-year changes.
[15] Karen Schulman and Helen Blank, ‘Turning the Corner.”
[16] For more information on state EITCs, see Erica Williams and Michael Leachman, “States Can Adopt or Expand Earned Income Tax Credits to Build a Stronger Future Economy,” Center on Budget and Policy Priorities, updated February 18, 2015, https://www.cbpp.org/files/1-30-14sfp.pdf.
[17] Additional information about these and other programs funded by TANF can be found in the state rules, which include a full list of TANF- or MOE-funded programs; see 67 Louisiana Administrative Code 55 at http://doa.louisiana.gov/osr/lac/67v01/67v01.pdf. Not all programs listed there are necessarily funded each year. A more current list of Louisiana’s use of federal TANF funds for other areas is also available in “Fiscal Highlights 2014 Session,” p. 128, http://lfo.louisiana.gov/files/publications/FY%2015%20Fiscal%20Highlights.pdf.
[18] The $16.5 billion represents the State Family Assistance Grants to states and does not include additional federal funds available from Supplemental Grants or the Contingency Fund.
[19] Although Congress funded the Supplemental Grants from TANF’s creation until 2011, this funding was not included in the baseline for congressional budget scoring purposes. Each time the Supplemental Grants were extended, the funding counted as a new expenditure that had to be offset with other savings.
[20] To qualify for the Contingency Fund, a state must report MOE expenditures of at least 100 percent of a modified historical expenditure level, with state spending on child care and certain non-TANF programs not counting toward this requirement.
[21] HHS introduced third-party MOE in a 2004 policy announcement as an interpretation of longstanding federal accounting principles, rather than as an explicit change of policy. See Policy Announcement, TANF-ACF-PA-2004-01, http://www.acf.hhs.gov/programs/ofa/policy/pa-ofa/2004/pa200401.htm. Although the original 1999 TANF rules didn’t address this issue, third-party MOE was included in rule revisions following the Deficit Reduction Act of 2005 and is at 45 CFR 263.2(e).
[22] The TANF rules at 45 CFR 263.5 implement the “new spending” test. Adopted as part of the original TANF rules in 1999, the provision prevents a state from counting as MOE any expenditures that were not part of the state’s IV-A (AFDC and related) programs unless they exceed state spending on the given program in 1995.
[23] See HHS Questions and Answers at http://www.acf.hhs.gov/programs/ofa/resource/recovery/tanf-faq.
[24] For additional background on TANF and MOE spending requirements, funding configurations, and consequences of providing “assistance,” see Elizabeth Lower-Basch, “Guide to Use of Funds,” Center for Law and Social Policy, March 1, 2011, http://www.clasp.org/admin/site/publications/files/Guide-to-Use-of-TANF-Funds.pdf.
[25] Ibid.
[26] “Assistance” generally covers cash and other forms of aid intended to meet families’ basic needs. See 45 C.F.R. 260.31.
[27] Healthy Marriage and Responsible Fatherhood Activities are set forth at 42 U.S.C. 603(a)(2).
More from the Authors

Areas of Expertise

Areas of Expertise