Congressional Budget Plans Get Two-Thirds of Cuts From Programs for People With Low or Moderate Incomes
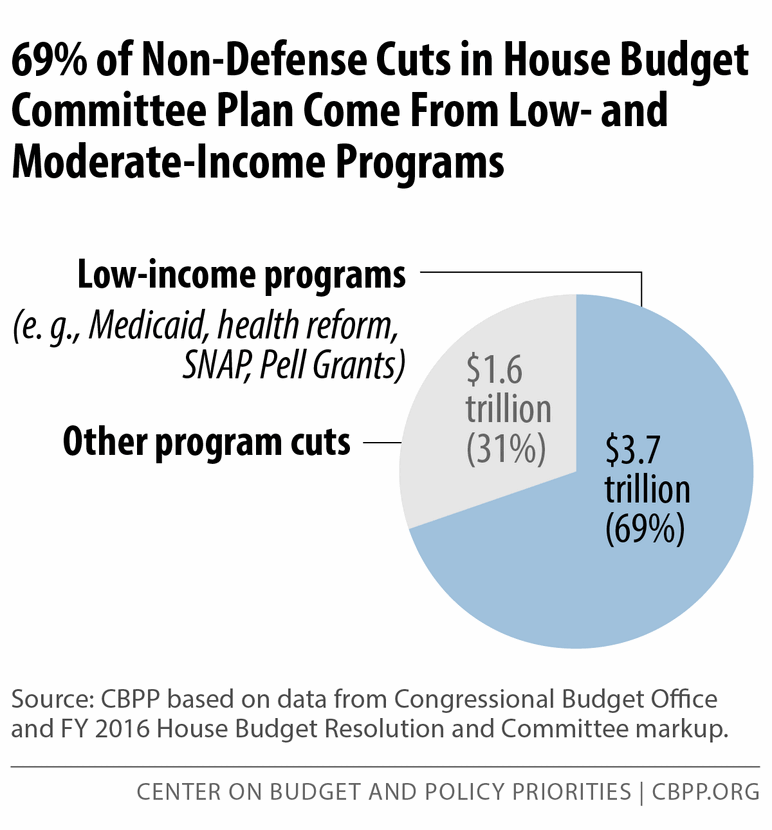
The budgets adopted on March 19 by the House Budget Committee and the Senate Budget Committee each cut more than $3 trillion over ten years (2016-2025) from programs that serve people of limited means. These deep reductions amount to 69 percent of the cuts to non-defense spending in both the House and Senate plans.
Each budget plan derives more than two-thirds of its non-defense budget cuts from programs for people with low or modest incomes even though these programs constitute less than one-quarter of federal program costs. Moreover, spending on these programs is already scheduled to decline as a share of the economy between now and 2025.[1]
The bipartisan deficit reduction plan that Alan Simpson and Erskine Bowles (co-chairs of the National Commission on Federal Policy) issued in 2010 adhered to the basic principle that deficit reduction should not increase poverty or widen inequality. The new Congressional plans chart a radically different course, imposing their most severe cuts on people on the lower rungs of the economic ladder.
The House Budget Committee Plan
As Table 1 indicates, the House Budget Committee plan proposes $5.3 trillion[2] in non-defense budget cuts through 2025. These cuts are in addition to the cuts dictated by the 2011 Budget Control Act’s (BCA) budget caps and sequestration.
| TABLE 1 | ||
|---|---|---|
| Spending Changes in House Budget Committee Plan 10-year totals (2016-2025) in trillions of dollars |
||
| Program cuts: | Total | Low-income |
| Health care programs | -3.1 | -2.9 |
| All other mandatory programs | -1.2 | -0.6 |
| Subtotal, mandatory cuts | -4.3 | -3.5 |
| Non-defense discretionary (NDD) | -1.0 | -0.2 |
| Total non-defense program cuts | -5.3 | -3.7 |
| Increased defense / war spending | +0.2 | |
| Resulting interest savings | -0.8 | |
| Grand Total, net reduced spending | -5.9 | |
Cuts in low-income discretionary and entitlement programs likely account for about $3.7 trillion — or 69 percent — of the $5.3 trillion in non-defense cuts, and probably more than that. (See Figure 1.) Our assumptions regarding the size of the low-income cuts are conservative. Where the plan leaves budget cuts unspecified, we assume that all programs in an affected program category would face the same percentage cut, even though some of the programs not targeted only on low- and moderate-income people, such as military retirement programs, are likely to be cut significantly less than their equal share, if at all.
The $3.7 trillion figure includes:
- More than $2.9 trillion in health care reductions for low- and moderate-income people. The plan would convert Medicaid and the Children’s Health Insurance Program into a single block grant with drastically reduced funding levels. It also would repeal the Affordable Care Act (ACA), including health reform’s subsidies to make coverage affordable for people with low or modest incomes and its Medicaid expansion. To date, the ACA coverage expansions have extended coverage to 16.4 million previously uninsured people and strengthened coverage for millions of others.
- $125 billion in cuts to SNAP (formerly food stamps). The House plan block-grants SNAP starting in 2021 and cuts SNAP funds by $125 billion, or more than a third, over 2021 to 2025. States would be left to decide whose benefits to reduce or terminate, but cuts of this magnitude would end food assistance for millions of low-income families, cut benefits for millions of such households, or do some combination of the two, according to a new CBPP analysis.[3]
- $159 billion[4] in cuts to tax credits for low- and modest-income working families. The House Budget Committee plan would allow critical provisions of the Earned Income Tax Credit (EITC) and the Child Tax Credit (CTC) to expire at the end of 2017, which would increase the number of people in poverty by an estimated 1.8 million, including 1.0 million children — and deepen poverty for another 14.6 million people, including 6.7 million children, in 2018. The House plan would also allow the American Opportunity Tax Credit to expire at the end of 2017, which would cause millions of low- and moderate-income families to lose some or all of the tax credits they receive to help offset college costs.[5]
- Roughly $300 billion in cuts in other mandatory (i.e. entitlement) programs serving low-income Americans, much of which is unspecified. Aside from the cuts in SNAP and refundable tax credits discussed above, the House plan cuts more than $550 billion from mandatory programs just in the education and income security categories of the budget. The Budget Committee provided few specifics here, but we conservatively estimate that about $300 billion would come from low-income programs in these areas. The Budget Committee made clear that the plan eliminates the mandatory portion of funding for Pell Grants, which help students from families with modest incomes afford college. The reduced Pell Grant funding would necessitate cuts in the program. Despite the fact that Pell Grants already cover a much lower share of college costs than they used to, the Budget Committee said its plan would freeze the maximum grant level for ten years, even as tuition and room and board costs continued to rise. Other mandatory programs in these areas that would also be candidates for significant cuts under this vague part of the plan include child nutrition programs, Supplemental Security Income (SSI) for the elderly and disabled poor, and possibly the underlying refundable portion of the EITC and the underlying low-income (or refundable) component of the Child Tax Credit (CTC). In calculating the size of the cuts in programs targeted on people of modest means, we assumed that low-income program (other than SNAP) would bear their proportionate share of the remaining $550 billion in cuts in mandatory programs that the budget plan makes in the education and income security categories.
- About $160 billion, and maybe more, in cuts to low-income non-defense discretionary programs. On top of the significant cuts already enacted as a result of the BCA’s discretionary caps and sequestration, the House Budget Committee cuts non-defense discretionary programs about $970 billion[6]below their post-sequestration levels. About two-thirds of these cuts are located in portions of the budget that have little or no low-income programs, such as scientific research, natural resources, and transportation infrastructure. But the rest are essentially unspecified or occur in areas where low-income programs reside. Here, too, we make the conservative assumption that low-income programs would bear a proportionate share of the cuts, which is how we derive our estimate of $160 billion in reductions.
The Senate Budget Committee Plan
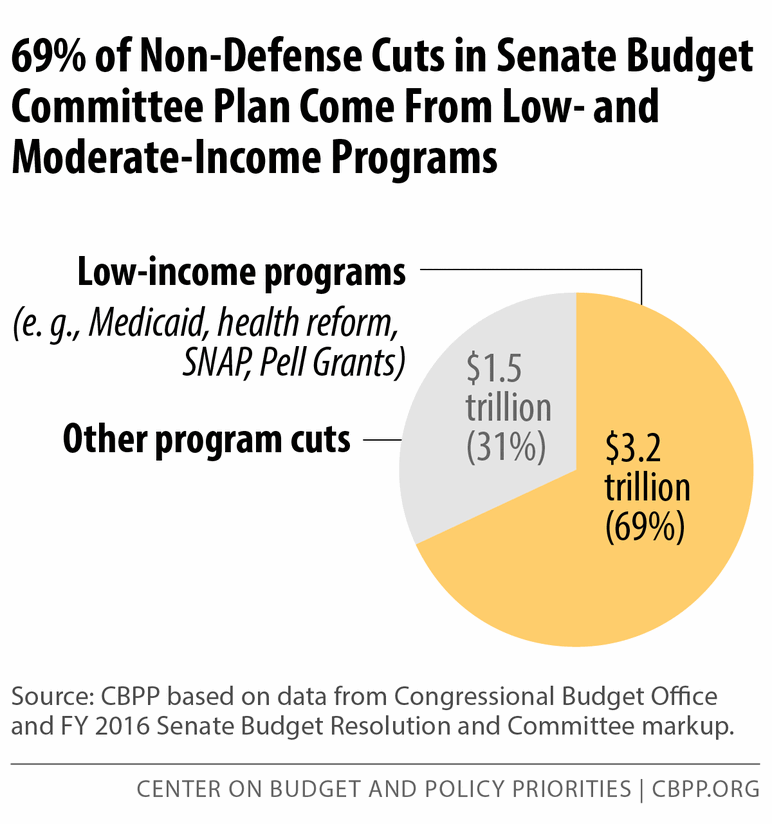
As Table 2 indicates, the Senate Budget Committee plan proposes $4.7 trillion[7] in non-defense budget cuts through 2025. The reductions in low-income discretionary and entitlement programs likely account for at least $3.2 trillion — or 69 percent — of these cuts. (See Figure 2.)
| TABLE 2 | ||
|---|---|---|
| Spending Changes in Senate Budget Committee Plan 10-year totals (2016-2025) in trillions of dollars |
||
| Program cuts | Total | Low-income |
| Health care programs | -2.9 | -2.5 |
| All other mandatory programs | -1.4 | -0.6 |
| Subtotal, mandatory cuts | -4.3 | -3.1 |
| Non-defense discretionary (NDD) | -0.4 | -0.1 |
| Total non-defense program cuts | -4.7 | -3.2 |
| Decreased defense / war spending | -0.1 | |
| Resulting interest savings | -0.8 | |
| Grand Total, net reduced spending | -5.6 | |
The cuts include:
- About $2.5 trillion in health care reductions for low- and moderate-income people. Like the House bill, the Senate Budget Committee plan repeals health reform’s subsidies and its Medicaid expansion, and block-grants much of Medicaid. The direct cuts to Medicaid are considerably smaller than in the House but still very large, totaling roughly $400 billion over the next ten years. The combined effect would add tens of millions of people to the ranks of the uninsured and underinsured.
- $159 billion in cuts to tax credits for low-income working families. Like the House bill, the Senate Budget Committee plan would allow provisions of the EITC and the CTC that are critical to 16 million working families with children, as well as the American Opportunity Tax Credit, to expire at the end of 2017.
- Roughly $500 billion in cuts in other mandatory programs serving low-income Americans, much of which is unspecified. The Senate bill includes even more unspecified cuts in mandatory programs than the House bill. In the Senate case as well, the large unspecified cuts in mandatory programs in the education and income security areas of the budget suggest there would be large reductions in Pell Grants and that low-income programs such as child nutrition programs, SSI, and the underlying refundable portions of the EITC and CTC would be targets for sizable cuts. The Senate bill does not explicitly call for block-granting SNAP, but the general allocation of its unspecified entitlement program cuts indicates that the food assistance provided through SNAP would likely be cut heavily.
-
Figure 2 $120 billion, and maybe more, in cuts to low-income non-defense discretionary programs. On top of the cuts already enacted as a result of the BCA’s discretionary caps and sequestration, the Senate Budget Committee cuts non-defense discretionary programs another $410 billion.[8] By 2025, total funding for non-defense discretionary programs would be at least 24 percent below its 2010 level adjusted for inflation, thus shrinking the funds available for investments in education, research, and transportation, as well as for low-income programs such as housing assistance, Head Start, and the Low-Income Home Energy Assistance Program.
A Strikingly Imbalanced Approach
This information depicts the striking imbalance of the House and Senate budget plans. They turn a blind eye to the principle that the nation’s fiscal problems should not be addressed by imposing more hardship on the poorest and most vulnerable Americans. They ignore other alternatives to reducing the deficit, most notably by failing to reduce the more than $1 trillion a year in tax expenditures (deductions, exclusions, credits, and other preferences), which disproportionately benefit high-income households and many of which essentially operate as entitlements provided through the tax code, as former Federal Reserve Chair Alan Greenspan has noted. They thereby ignore the seemingly widespread consensus that has emerged of the importance of advancing shared prosperity. If these proposals are enacted, the damage to low- and moderate-income families and individuals will be substantial.
Technical Note on the Baseline Spending Path Used for this Analysis
All changes in budget policies are shown relative to an underlying spending and revenue path, referred to as the “baseline.” The figures used in this analysis rely on the CBPP baseline for the next decade. Our baseline is derived directly from the Congressional Budget Office (CBO) baseline, with some relatively modest adjustments. (A fuller description of the CBPP baseline can be found in the Technical Note to “Low-Income Programs Not Driving Nation’s Long-Term Fiscal Problem,” Updated March 12, 2015, https://www.cbpp.org/cms/?fa=view&id=3772.)
The baseline that the House and Senate Budget Committees used in describing the effects of their proposals also differed from the CBO baseline. The adjustments they make are noticeably larger than those made by CBPP. The House and Senate adjustments also differ from each other, with the result that the figures the Committees use are not directly comparable to each other. One advantage of our analysis is that it examines both proposals relative to the same underlying spending path, making the House and Senate figures comparable.
The share of total cuts imposed on low-income programs is essentially the same no matter which baseline is used. The share of the House Budget Committee cuts hitting low-income programs is 69 percent whether we distribute the reductions using the CBPP baseline or the House baseline, and 68 percent using the unadjusted CBO baseline. Similarly, the share of the Senate Budget Committee cuts hitting low-income programs is 69 percent using the CBPP or the Senate baseline, and 68 percent using the CBO baseline.
The use of different baselines does have a modest effect on estimates of the overall size of the cuts. The CBPP baseline projects that deficits will be 3 percent lower than those in CBO’s baseline over the next decade, while the House Budget Committee baseline projects deficits will be 9 percent lower and the Senate Budget Committee baseline projects deficits will be 13 percent lower than CBO projects. (CBO is constrained by law to produce a baseline that assumes war funding will grow each year with inflation. CBPP, as well as the House and Senate Budget Committees, build baselines in which lower — or in the case of the Senate, no — war funding is assumed in future years. There are other differences outside war funding, as well. The other CBPP differences relate to our treatment of refundable tax credits slated to expire in 2017 and the projected growth in discretionary programs after 2021.)
Because the CBPP baseline has higher spending figures than in the House and Senate baselines, it shows modestly larger overall cuts for the House and Senate plans than the Budget Committees do. The CBPP baseline finds that the total non-defense spending cuts in the House bill would total $5.3 trillion over the next decade; the House Budget Committee baseline suggest the cuts would be $5.0 trillion over this period. In addition, the CBPP baseline projects that the non-defense spending cuts in the Senate bill would total $4.7 trillion over the next decade; the Senate Budget Committee baseline suggest the cuts would be $4.4 trillion over this period.
The House and Senate Budget Committees both produced budget plans consistent with the estimating assumptions in CBO’s January 2015 baseline instead of working from the more current March 2015 CBO baseline (which shows improvements in the fiscal outlook, especially in the area of health spending). While CBPP will generally use the more current CBO baseline in other analyses, we use our revision of the January CBO baseline here so this analysis can be analytically consistent with the House and Senate plans.
End Notes
[1] Robert Greenstein, Isaac Shapiro, and Richard Kogan, “Low-Income Programs Not Driving Nation’s Long-Term Fiscal Problem,” Center on Budget and Policy Priorities, Updated March 12, 2015, https://www.cbpp.org/cms/?fa=view&id=3772.
[2] As explained in the Technical Note, the figures in this paper on the overall size of deficit reduction differ modestly from those presented in the House and Senate budget documents. The House Budget Committee and the Senate Budget Committee each used a different baseline to measure the savings in their respective plans. Our analysis uses a common baseline for both plans, derived directly from the Congressional Budget Office baseline.
[3] Dottie Rosenbaum and Brynne Keith-Jennings, “House Budget Would Slash SNAP by $125 Billion Over Ten Years,” Center on Budget and Policy Priorities, March 20, 2015, https://www.cbpp.org/cms/index.cfm?fa=view&id=5287.
[4] The $159 billion reflects the reduction in outlays from this change. Allowing these provisions to expire also raises $44 billion more in revenues, due to the increased taxes these working families would have to pay.
[5] Chuck Marr, Bryann DaSilva, and Arloc Sherman, “Letting Key Provisions of Working-Family Tax Credits Expire Would Push 16 Million People Into or Deeper Into Poverty,” Center on Budget and Policy Priorities, updated February 20, 2015, https://www.cbpp.org/cms/index.cfm?fa=view&id=4228.
[6] The $970 billion in outlay savings over ten years from non-defense discretionary programs is higher than the more widely reported cut of $759 billion. That figure reflects the reduction from the Budget Control Act funding caps (as reduced by sequestration) through 2021, and the reduction from the CBO baseline for 2022-2025 (which equals the 2021 sequestration caps adjusted for inflation). The $759 billion in cuts thus applies only to programs that are subject to the BCA caps. The outlay savings number reflected in this analysis is higher primarily because the House budget also cuts funding for non-defense programs that are outside the caps, such as for program integrity activities, assistance for disasters and emergencies, and the Highway Trust Fund. The savings from these cuts are included in our $970 billion total for non-defense discretionary programs.
[7] See the Technical Note for why the figures in this section differ from those found in Senate Budget Committee documents.
[8] The $410 billion in outlay savings over ten years from non-defense discretionary programs is higher than the more widely reported cut of $236 billion. That figure reflects the reduction from the Budget Control Act funding caps (as reduced by sequestration) through 2021, and the reduction from the CBO baseline for 2022-2025 (which equals the 2021 sequestration caps adjusted for inflation). The $236 billion in cuts thus applies only to programs that are subject to the BCA caps. The outlay savings number reflected in this analysis is higher primarily because the Senate budget also cuts funding for non-defense programs that are outside the caps, such as for program integrity activities, assistance for emergencies, and the Highway Trust Fund. The savings from these cuts are included in our $410 billion total for non-defense discretionary programs.
More from the Authors