House Budget Would Slash SNAP by $125 Billion Over Ten Years
Low-Income Households in All States Would Feel Sharp Effects Under Proposed Block Grant
The House Budget Committee’s budget plan would convert the Supplemental Nutrition Assistance Program (SNAP, formerly known as the Food Stamp Program) into a block grant beginning in 2021 and cut funding steeply — by $125 billion (34 percent) between 2021 and 2025.[1] Cuts of this magnitude would end food assistance for millions of low-income families, cut benefits for millions of households, or some combination of the two. The prior Budget Committee chairman, Paul Ryan, proposed similarly deep SNAP cuts in each of the last four House budgets.
If the cuts came solely from eliminating eligibility for certain categories of households or individuals, states would have to cut an average of 11 to 12 million people from the program (relative to SNAP enrollment without the cuts) each year between 2021 and 2025. If the cuts came solely from across-the-board benefit cuts, states would have to cut an average of almost $55 per person per month in 2021 to 2025 (in nominal dollars).
States would be left to decide whose benefits to reduce or terminate. They would have no good choices — the program already provides an average of only $1.42 per person per meal, primarily to poor children, working-poor parents, seniors, people with disabilities, and others struggling to make ends meet.
The cuts would come on top of SNAP cuts that have occurred recently or are occurring under current law.
- Approximately 1 million of the nation’s poorest people are slated to be cut off SNAP over the course of 2016 as a three-month limit on SNAP benefits for unemployed adults aged 18-50 who aren’t disabled or raising minor children returns in many areas. These individuals, whose average income while on SNAP equals 19 percent of the poverty level, will lose food assistance after three months regardless of how hard they are looking for work.[2]
- Nearly all SNAP recipients experienced a benefit cut averaging 7 percent in November 2013 when the 2009 Recovery Act’s temporary benefit increase expired. The cut totaled about $5 billion in fiscal year 2014.[3]
- Some SNAP households in a few states experienced a large benefit cut from a provision of the 2014 farm bill that no longer allowed them to claim the SNAP standard utility allowance toward their shelter deduction as part of the SNAP benefit calculation.
Block Grant Would Force States to Cut Food Assistance Deeply
Since roughly 90 percent of SNAP spending goes for food assistance, and most of the rest covers state administrative costs to determine program eligibility and operate SNAP properly, policymakers couldn’t achieve cuts of the magnitude in the House Budget Committee’s block grant without substantially scaling back eligibility or reducing benefits deeply, with significant effects on low-income families and individuals.[4] Table 1 provides state-by-state estimates of the potential impact.
- Eligibility cuts. If the cuts came solely from eliminating eligibility for certain categories of households or individuals, states would have to cut an average of 11 to 12 million people from the program (relative to SNAP enrollment without the cuts) each year between 2021 and 2025.[5]
- Benefit cuts. If the cuts came solely from across-the-board benefit cuts, states would have to cut an average of almost $55 per person per month in 2021 to 2025 (in nominal dollars). This would require setting the maximum benefit at about 73 percent of the Thrifty Food Plan, the Agriculture Department’s (USDA) estimate of the cost of a bare-bones, nutritionally adequate diet. (Under SNAP rules, the maximum benefit — which goes to households with no disposable income after deductions for certain necessities — is set at 100 percent of the cost of the Thrifty Food Plan.)[6]
Such a change would have a pronounced impact. All families of four — including the poorest — would face benefit cuts of about $200 a month in fiscal year 2021, or more than $2,400 per year. All families of three would face cuts of about $160 per month, or about $2,000 per year. Policymakers could shield some households from cuts, but then other households would need to bear even larger cuts in order to produce the $125 billion in block-grant savings. - Lower income limits. A third way to achieve the cuts would be to lower the program’s income limit to target the remaining benefits to the lowest-income households. To achieve a 34-percent cut in overall benefits paid, the SNAP income limit would have to be set at about 60 percent of the poverty level, or about $12,050 a year in 2015 dollars for a family of three. The current federal SNAP income limit is 130 percent of the poverty level. This approach would eliminate eligibility for many working families, senior citizens, and people with disabilities.[7]
While states might not seek to hit the targets through just one of these approaches, these examples illustrate the magnitude of the reductions needed. States would have few other places to achieve the required cuts because such a large share of SNAP expenditures go for SNAP benefits.
In 2014, 92 percent of SNAP spending went for benefits to purchase food. Another 5 percent went for administrative costs, including reviews to determine that applicants are eligible, monitoring of retailers that accept SNAP, and anti-fraud activities. The rest went for other food assistance programs, such as the block grants for food assistance in Puerto Rico and American Samoa, commodity purchases for the Emergency Food Assistance Program (which helps food pantries and soup kitchens across the country), and commodities for the Food Distribution Program on Indian Reservations.
Reconciliation Instructions for Agriculture Committee
The House Budget Resolution includes “reconciliation instructions” for most authorizing committees, including the Agriculture Committee, which has jurisdiction over SNAP. They signal the Budget Committee’s intention to use the “reconciliation” process later this year, which allows for expedited consideration of certain types of legislation, including cuts to “mandatory” programs such as SNAP and farm subsidies.a
The budget resolution the House Budget Committee approved on March 19 instructs the Agriculture Committee, by July 15, 2015, to recommend cuts in its jurisdiction that total no less than $1 billion over the ten-year budget window (2016 to 2025.) It also gives the Budget Committee flexibility to provide further guidance to the Agriculture Committee and other committees, such as bigger savings targets, in the months ahead.b In a March 17 press conference, Chairman Price indicated in response to a question that the reconciliation dollar figures in the resolution represent “a floor, not a ceiling.”c
In addition to the SNAP cuts of $125 billion, the budget resolution includes substantial cuts to other Agriculture Committee programs (totaling about $23 billion).
a For more on reconciliation, see David Reich and Richard Kogan, “Introduction to Budget “Reconciliation,” Center on Budget and Policy Priorities, January 22, 2015, https://www.cbpp.org/cms/index.cfm?fa=view&id=5262
b David Reich, “Don’t Be Fooled by Small “Reconciliation” Savings Targets in House Budget Committee Plan,” Off the Charts blog, March 19, 2015, http://www.offthechartsblog.org/dont-be-fooled-by-small-reconciliation-savings-targets-in-house-budget-committee-plan/.
c See http://www.c-span.org/video/?324868-1/house-budget-committee-news-conference-fiscal-year-2016-budget-resolution.
Proposed Cuts Rest on Inaccurate Claims
The House Budget Committee plan bases its proposed SNAP cuts on a series of inaccurate claims and inferences about SNAP’s growth, effectiveness, and efficiency. The plan’s only specific reference to the SNAP cut argues that:
Federal spending for food stamps, the Supplemental Nutrition Assistance Program (SNAP), has increased from $21 billion in 2002 to $76 billion in 2014. Spending is forecast to be permanently higher than pre-recession levels even as the job-market recovers. There are many reasons for this, but the core challenge is that while states have the responsibility of administering the program, they have little flexibility to ensure it is run well. [8]
The reality is quite different:
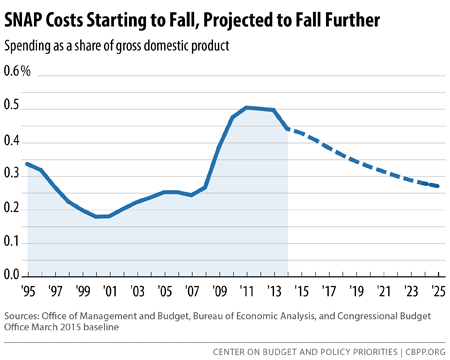
- Spending and caseloads declining. SNAP spending and caseloads grew substantially during the recession but have now begun to decline. CBO projects that SNAP caseloads will fall from 46.5 million people in fiscal year 2014 to 32.8 million by 2025, and that SNAP costs will decline markedly as a share of the economy (gross domestic product or GDP). SNAP spending grew sharply after 2007 because of three factors: the depth of the Great Recession and the slow, uneven recovery, which made more people eligible; improvements in reaching eligible households, particularly working-poor families; and the 2009 Recovery Act’s temporary benefit boost, which ended in November 2013. [9]
As Figure 1 indicates, SNAP spending has started to fall as a share of GDP, and the Congressional Budget Office (CBO) projects that SNAP will return to close to pre-recession levels as a share of GDP once the economy fully recovers. The program does not contribute to the nation’s long-term budget problems because it is projected to grow no faster than the economy over time.
Measuring SNAP spending in nominal terms or adjusted only for overall inflation (rather than as a share of GDP), CBO projects that SNAP costs will remain higher than before the recession. CBO has not detailed its assumptions, but they likely include: 1) participation rates among those eligible will remain somewhat higher than before the recession; 2) some of the weakness in the labor market stemming from the recession will continue;[10] 3) food price growth will exceed overall inflation over the 2007 to 2025 period; and 4) the overall U.S. population will continue to grow. These factors indicate that SNAP is working as intended to meet need.
Running SNAP at a drastically reduced funding level and turning it over to the states would result in a deep cut in food assistance to participants and a program that is both less responsive to economic conditions and very different from state to state.
- Strong evidence of positive impact. The House Budget Committee document charges that “food stamps [and other programs] are judged not on whether they achieve improved health and economic outcomes for the recipients or build a stronger community, but on the size of their budgets.” In the case of SNAP, there is ample evidence that SNAP reduces poverty and food insecurity.
- A recent study looked at SNAP’s long-term impacts on poor children who had access to food stamps in the early 1970s, compared to poor children from counties that hadn’t yet implemented the program. Adults who had access to food stamps as young children had an 18 percentage-point higher high school graduation rate. They also had significantly lower rates of “metabolic syndrome” (obesity, high blood pressure, heart disease, and diabetes) and better health as adults. In addition, women who had access to food stamps as young children had higher earnings and lower rates of welfare receipt as adults.[11]
- SNAP kept about 4.8 million people out of poverty in 2013, including about 2.1 million children, and reduced the depth of poverty for 16 million people, according to a CBPP analysis using the Supplemental Poverty Measure, which counts SNAP as income. SNAP also lifted 1.3 million children out of “deep poverty” (defined as income below 50 percent of the poverty line) in 2013.
- Studies show that SNAP reduces “food insecurity,” or inadequate access to food due to lack of resources.[12]
- Errors at historic lows. SNAP has one of the most rigorous quality control systems of any public benefit program and a very low error rate. Despite recent caseload growth, the share of total SNAP payments that represent overpayments or payments to ineligible households fell to a record low 2.61 percent in fiscal year 2013. In addition, USDA has cut “trafficking” — the sale of SNAP benefits for cash, which violates federal law — by three-quarters over the past 15 years. Only 1.3 percent of SNAP benefits are trafficked. USDA has also permanently disqualified thousands of retail stores from the program for not following strict federal requirements. (When cases of SNAP fraud are reported in the news, it is because the offenders have been caught, evidence that states and USDA are combating fraud.)
SNAP in the Senate Budget Resolution
The Senate Budget Committee-approved budget resolution, to its credit, does not call for block-granting SNAP. However, it includes even larger unspecified cuts in “mandatory” income security spending, the category of the budget that includes SNAP along with many other programs that serve low-income Americans, including child nutrition programs and Supplemental Security Income. As a result, it likely targets SNAP, as well as these other programs, for cuts. The Senate Budget Committee Resolution does not include reconciliation instructions for the Agriculture Committee.
Benefit Cuts Would Primarily Affect Low-Income Workers, Families With Children, Seniors, and People With Disabilities
The House budget documents assert that Congress could achieve the required savings by capping federal SNAP funding and giving states “the power to administer the program in ways that best fit the needs of their communities with greater incentives to achieve better results.” That description leaves the mistaken impression that large savings could be achieved without significantly harming millions of vulnerable Americans.
Unlike most means-tested benefit programs, which are restricted to particular categories of low-income individuals, SNAP is broadly available to almost all households with very low incomes. Cutting SNAP would affect broad swaths of the low-income population. Currently, 46.3 million people receive SNAP to help them feed their families. Census data show that in 2013 (the latest year available), 45.3 million Americans lived below the poverty line and 63.9 million lived below 130 percent of the poverty line, SNAP’s gross income limit.[13]
- The overwhelming majority of SNAP households are families with children, seniors, or people with disabilities. Seventy percent of SNAP participants are in families with children; more than one-quarter are in households that include senior citizens or people with disabilities.
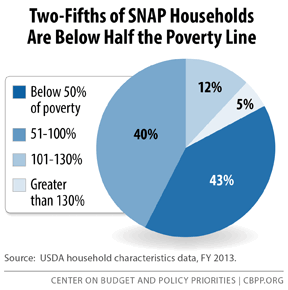
- SNAP households have very low incomes. Eighty-three percent of SNAP households have incomes below the poverty line while receiving SNAP assistance (about $20,090 for a family of three in 2014). Forty percent of SNAP households have incomes below half of the poverty line. (See Figure 2.) Such households have little flexibility in their monthly budgets to cope with deep reductions in food assistance.
- Low-wage workers rely on SNAP to boost their monthly income. Millions of Americans live in working households with earnings that are not sufficient to meet basic needs. In 2013, some 38 million people (1 in 8 Americans) lived in a working family with cash income below 130 percent of the poverty line.[14] Wage growth has been sluggish since the recession due to labor market slack; with many more job-seekers than jobs, employers have faced little pressure to raise wages. Low-wage workers likely to qualify for SNAP have fared even worse, as their real (inflation-adjusted) wages have declined steadily since 2009. Real hourly wages at the 25th percentile of the wage distribution, for example, were 5 percent lower in the last quarter of 2014 than in 2009.[15] In addition, the share of workers who would like a full-time job but are working part time remains high. Working families with low incomes are often unable to afford necessities like food and housing without some assistance.
SNAP benefits play a crucial role in boosting such families’ monthly resources: in 2013, a typical working mother with two children on SNAP earned $1,180 per month ($14,175 on an annual basis) and received $334 per month in SNAP benefits.[16] If the House Budget Committee proposal had been in place in 2013 and was implemented via an across-the-board benefit cut, this family’s monthly benefits would have been cut by $134 per month, or about 40 percent.
Benefit Cuts Would Increase Hunger and Poverty
SNAP cuts of the magnitude that the House Budget Committee proposes would almost certainly lead to increases in hunger and poverty. Emergency food providers report that more people ask for help in the latter part of the month, after their SNAP benefits run out. Under the plan’s steep funding cuts, a typical household’s SNAP benefits would run out many days earlier, placing greater strain on household finances (and on emergency food providers) and significantly increasing the risk of hunger.
Deep SNAP cuts also would cause more families and individuals to fall into poverty and push poor families deeper into poverty. As noted, SNAP lifted 4.8 million Americans above the poverty line in 2013, including 2.1 million children,[17] and lifted 1.3 million children above half of the poverty line.[18]
The plan’s SNAP cuts would thus have a sharp, adverse effect on millions of the lowest-income Americans. Moreover, these cuts would not occur in isolation, as the House Budget Committee plan also contains steep cuts in other low-income assistance programs. Many vulnerable families would lose some or all of their health coverage, housing assistance, or other important supports such as child care, even while facing SNAP cuts.
Cuts Could Be Even Larger Under a Block Grant
Block-granting SNAP would eliminate its ability to respond automatically to the increased need that results from rising poverty and unemployment during economic downturns. Annual federal funding would remain fixed, regardless of whether the economy was in a recession or how severe an economic downturn was. As a result, the House Budget Committee staff’s estimate that the budget plan would cut SNAP by $125 billion over ten years may understate the magnitude of the cut — the cuts would be still more severe if the economy performed less well over the coming decade than CBO projects.
If a SNAP block grant had been in effect in 2013 at funding levels set in 2007, before the recession, federal funding in 2013 would have been about 50 percent below actual funding that year (excluding the Recovery Act benefit boost).
Furthermore, under a block grant, SNAP would not expand automatically to respond to natural disasters. Hurricane Sandy victims in New York and New Jersey obtained temporary food aid through SNAP in 2013, as did victims of disasters in several other states.
Also, under a block grant, some states facing large budget shortfalls would likely shift funds from food assistance to other purposes. SNAP includes several non-food components, such as job training and related child care; a block-grant structure would enable states to divert funds away from food to these purposes and withdraw state funds currently spent on those activities.
Finally, because of its capped funding structure, a block grant like the one the House Budget Committee proposes would reverse the recent progress made, on a bipartisan basis, to improve SNAP participation among eligible low-income households. Viewing SNAP as an important work support and health and nutrition benefit, the last three Administrations and governors from across the political spectrum have sought to boost participation rates — especially among working-poor families and low-income elderly people, the two groups with the lowest participation rates.
Overall, the efforts have paid off. SNAP reached 83 percent of eligible individuals in a typical month in 2012 (the most recent year available), a significant improvement from 2002, when the participation rate bottomed out at 54 percent. Participation among eligible low-income working families rose from 43 percent in 2002 to about 72 percent in 2012. For the elderly, it improved more modestly — from 26 percent in 2002 to about 42 percent in 2012. Block-granting SNAP would discourage states from seeking to maintain or extend these improvements, because the program would no longer be able to grow in response to an increase in the number of eligible people seeking assistance.
Illustrative State-by-State Impact of House Budget Committee’s SNAP Block-Grant Cuts |
|
State/Territory |
Proportional Distribution of Cuts
|
| Alabama |
$2,100
|
| Alaska |
$300
|
| Arizona |
$2,300
|
| Arkansas |
$1,100
|
| California |
$11,800
|
| Colorado |
$1,200
|
| Connecticut |
$1,100
|
| Delaware |
$300
|
| District of Columbia |
$400
|
| Florida |
$8,700
|
| Georgia |
$4,500
|
| Guam |
$200
|
| Hawaii |
$800
|
| Idaho |
$500
|
| Illinois |
$5,100
|
| Indiana |
$2,100
|
| Iowa |
$800
|
| Kansas |
$600
|
| Kentucky |
$1,900
|
| Louisiana |
$2,000
|
| Maine |
$500
|
| Maryland |
$1,800
|
| Massachusetts |
$2,000
|
| Michigan |
$4,100
|
| Minnesota |
$1,100
|
| Mississippi |
$1,400
|
| Missouri |
$2,000
|
| Montana |
$300
|
| Nebraska |
$400
|
| Nevada |
$900
|
| New Hampshire |
$200
|
| New Jersey |
$2,000
|
| New Mexico |
$1,000
|
| New York |
$8,200
|
| North Carolina |
$3,800
|
| North Dakota |
$100
|
| Ohio |
$4,100
|
| Oklahoma |
$1,400
|
| Oregon |
$1,800
|
| Pennsylvania |
$4,100
|
| Rhode Island |
$400
|
| South Carolina |
$2,000
|
| South Dakota |
$200
|
| Tennessee |
$3,100
|
| Texas |
$8,500
|
| Utah |
$500
|
| Vermont |
$200
|
| Virginia |
$2,100
|
| Virgin Islands |
$100
|
| Washington |
$2,500
|
| West Virginia |
$800
|
| Wisconsin |
$1,800
|
| Wyoming |
$100
|
| Other SNAP spending |
$14,000
|
| United States |
$125,000
|
| Note: The total SNAP cut is $125 billion over fiscal years 2021 to 2025. About 90 percent of SNAP spending goes for food assistance benefits for low-income households. The remainder goes to the federal share of state administrative costs for the program, block grants for nutrition assistance in Puerto Rico and American Samoa, funds for commodities for the Emergency Food Assistance Program, and funding for the Food Distribution Program on Indian Reservations. We assume those other activities would bear a proportional share of the cuts ($14 billion, or 11 percent over the 2021 to 2025 period). This is a conservative estimate of the share that would come from SNAP benefit reductions because, in the past, Congress has favored these other activities and not looked to them for substantial budget cuts. Under these assumptions, SNAP benefits would need to be cut by $111 billion over the period. The table distributes the $111 billion in benefit cuts across the states in accordance with each state’s percentage share of total fiscal 2014 SNAP benefits. Due to rounding, the state-by-state benefit amounts may not add precisely to the total. | |
End Notes
[1] House Budget Committee staff provided the $125 billion figure verbally in response to a question from Rep. Tim Ryan about the size of the assumed SNAP cuts during the mark-up of the proposed budget resolution on March 18. Also see House Budget Committee, A Balanced Budget for a Stronger America, Fiscal Year 2016 Budget Resolution, March 17, 2015, pp. 28-29, which articulates a proposal for converting SNAP to a block grant. The figure is consistent with the Budget Committee’s “Setting the Record Straight” document, which states that “this budget will still spend approximately $600 billion on the SNAP program over the next decade.” (See http://budget.house.gov/fy2016/settingtherecordstraight.htm.)
[2] See Ed Bolen, “Approximately 1 Million Unemployed Childless Adults Will Lose SNAP Benefits in 2016 as State Waivers Expire,” Center on Budget and Policy Priorities, January 5, 2015, https://www.cbpp.org/cms/index.cfm?fa=view&id=5251.
[3] See Dorothy Rosenbaum and Brynne Keith-Jennings, “November 1 SNAP Cuts Will Affect Millions of Children, Seniors, and People With Disabilities,” Center on Budget and Policy Priorities, October 24, 2013, https://www.cbpp.org/sites/default/files/atoms/files/10-24-13fa.pdf.
[4] All estimates use CBO’s January 2015 baseline assumptions for SNAP. For purposes of this analysis, we assume that SNAP benefits would be cut under the block grant by $111 billion over the period. (We assume that other activities in SNAP would bear a proportional share of the cuts; see note at the bottom of Table 1 for more information.) This is a conservative estimate; in the past, Congress has favored most of those other activities and not looked to them for large budget cuts. In addition, in past years during the Budget Committee mark-up, committee staff have indicated that under a block grant, states could cut benefits in order to fund other activities, such as job training. Thus, the cut to SNAP benefits could be deeper than this analysis assumes.
[5] Estimates are relative to CBO’s SNAP participation projections and assume that on average, the individuals who would be cut would otherwise have received the average benefit.
[6] See USDA’s estimates of the monthly cost of the Thrifty Food Plan at http://www.cnpp.usda.gov/usdafoodcost-home.htm. To estimate an across-the-board cut, we reduced the size of maximum benefit relative to the Thrifty Food Plan by 27 percent beginning in 2021.
[7] This example assumes that the federal gross income limit would apply to all households. Currently the limit does not apply to households with elderly or disabled members or to households that are categorically eligible for SNAP because they receive another public assistance benefit, such as Temporary Assistance for Needy Families (TANF). In this scenario, about 60 percent of households that would be cut would include elderly or disabled members. If a state wanted to shield most such households (and certain other households, such as those receiving TANF cash assistance) from cuts, it would need to cut the gross income limit for other households to about 30 percent of the poverty level, or just $6,025 for a family of three in 2015 dollars. (In this latter scenario, we assume all households would need to have net income below 100 percent of the poverty level to qualify for SNAP.)
[8] House Budget Committee, A Balanced Budget for a Stronger America, Fiscal Year 2016 Budget Resolution, March 17, 2015, p. 29.
[9] Dottie Rosenbaum and Brynne Keith-Jennings, “SNAP Costs Declining, Expected to Fall Much Further,” Center on Budget and Policy Priorities, updated February 9, 2015, https://www.cbpp.org/cms/?fa=view&id=4054.
[10] Chad Stone, Arloc Sherman, and Brynne Keith-Jennings, “No Mystery Why SNAP Enrollment Remains High: It’s Still the Economy,” Center on Budget and Policy Priorities, updated March 18, 2015, https://www.cbpp.org/cms/index.cfm?fa=view&id=3996.
[11] Hilary W. Hoynes, Diane Whitmore Schanzenbach, and Douglas Almond, “Long Run Impacts of Childhood Access to the Safety Net,” National Bureau of Economic Research Working Paper 18535, 2012, www.nber.org/papers/w18535.
[12] See, for example, James Mabli et al., “Measuring the Effect of Supplemental Nutrition Assistance Program (SNAP) Participation on Food Security,” Mathematica Policy Research for the U.S. Department of Agriculture, Food and Nutrition Service, August 2013, http://www.fns.usda.gov/sites/default/files/Measuring2013.pdf.
[13] Under federal rules, a household’s monthly income must be at or below 130 percent of the poverty line — or roughly $2,144 a month (about $25,700 a year) for a family of three in 2015 — to qualify. There are some exceptions; for example, households with seniors and people with disabilities are not subject to the gross income test but must have net income (after deductions for certain necessary expenses) at or below the poverty line. States have some flexibility to lift the gross income test for certain other households. Also, some categories of people are not eligible for SNAP regardless of how low their income and assets are, such as most workers on strike, certain legal immigrants, many college students, and all undocumented immigrants. Unemployed childless adults may receive SNAP benefits for only three months out of every three years, except in areas with high unemployment.
[14] The figure refers to working individuals and people in family units where one or more family members worked at some point during the year. It comes from CBPP analysis of Census Bureau Current Population Survey data.
[15] CBPP calculations based on Bureau of Labor Statistics usual weekly earnings data adjusted for inflation using the CPI-U-RS.
[16] These figures are based on USDA household characteristics data. The benefit boost from the 2009 Recovery Act ended in November 2013; this increase has been removed from the figures cited here to show what the typical working mother with two children would receive now.
[17] Based on CBPP analysis of the Supplemental Poverty Measure. See Kathleen S. Short, “The Research Supplemental Poverty Measure: 2012,” Bureau of the Census, November 2013, http://www.census.gov/prod/2013pubs/p60-247.pdf. The Census Bureau’s Supplemental Poverty Measure defines poverty as family income (cash income after taxes plus the value of SNAP and other food assistance, housing assistance, and low-income energy assistance, minus out-of-pocket medical and work expenses) that falls below an updated poverty line. It uses a broader family unit that includes unmarried partners and foster children.
[18] Unpublished CBPP analysis of the March 2012 Current Population Survey using the Supplemental Poverty Measure.
More from the Authors

Areas of Expertise