Chart Book: The War on Poverty at 50, Section 2
Changes in the Labor Market, Education, and Families Have Affected Poverty Trends
Many changes in American society over the last 50 years have affected poverty. Some have exerted upward pressure on poverty, such as an increase in the share of economic gains going to top earners, higher rates of single parenthood, and diminished labor market prospects for less-skilled workers. At the same time, it’s often overlooked that other trends have pushed in the other direction, such as a stronger safety net, improved educational attainment, smaller families, and growing employment among women.
The notion that going back to “the way things were” in the 1960s would cure poverty is largely myth. If we simultaneously returned to the 1964 patterns of marriage, number of children, high school completion, and men’s and women’s employment rates (without changing the poverty rates tied to those characteristics today), poverty would go up, not down.
To make progress against poverty, we must understand the factors that push it in each direction.
This short analysis reviews some of these key factors. Note, however, that the trends related to inequality, education, and the labor market are discussed only briefly here; they will be covered in more depth in a forthcoming section of this chartbook.
Part I: Some Key Factors Pushing Poverty Down
Over the past five decades, the share of adults finishing high school rose, families became smaller, women became more likely to work outside the home, and the safety net became far more effective at reducing poverty.
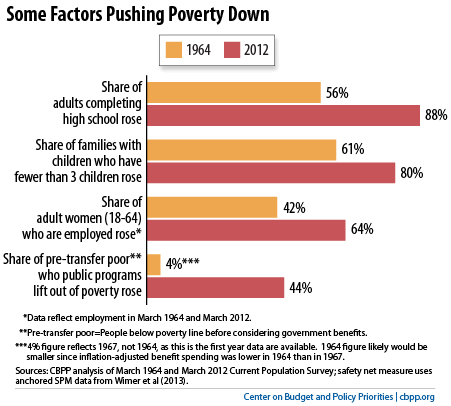
Education: The share of adults completing high school rose from 56 percent to 88 percent over the last five decades. The share of adults with a college degree increased as well. This contributed to broad economic growth and improved earnings prospects for those who today are high school or college graduates but 50 years ago would have left school much earlier. The improvement in educational attainment extended to both men and women and across racial and ethnic lines, and the racial disparity in high school completion declined substantially. However, the racial disparity in college completion remains very large. In 2013, the share of African Americans aged 25-34 who had a college degree stood at 23 percent; among whites, the figure was 41 percent.
Family size: In 1964, 61 percent of families with children had only one or two children while 39 percent had three or more children. In 2012, fully 8 in 10 families with children had only one or two children, and just 20 percent had three or more children. This trend toward smaller families has reduced poverty because a family’s income now needs to support fewer people. Family size declined across the income spectrum.
Women’s employment: The share of adult women (aged 18 to 64) who are employed rose from 42 percent in 1964 to 64 percent in 2012. Declining employment rates among men, particularly less-skilled men, offset part of this increase (see below), but the share of all adults aged 18-64 who are employed increased from 63 percent to 69 percent over this period.
Effectiveness of the safety net: In 1967 — the first year for which data on the “anchored” Supplemental Poverty Measure (described in Section 1 of this chartbook) are available — only 4 percent of people with incomes below the poverty line before counting government benefits (and before subtracting income and payroll taxes) had incomes above the poverty line after counting that assistance and taking taxes into account. In 2012, by contrast, the safety net kept 44 percent of such individuals out of poverty. This difference is very large. In 2012, government benefits and the tax system reduced the number of people in poverty by 40 million. But nearly 36 million of these people would have still been poor if the safety net in 2012 were only as effective at keeping people out of poverty as it was in 1964.
Part II: Some Factors Keeping Poverty High
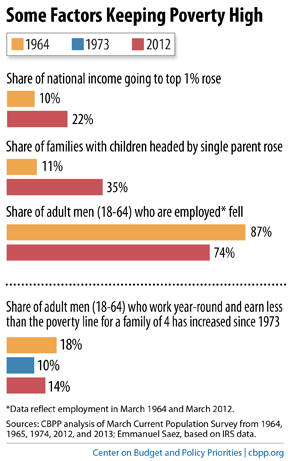
Rising inequality: The economy grew significantly over the past five decades on a per capita basis, but beginning in the 1970s, the benefits of this growth became far more unequally shared. The share of the national income going to the top 1 percent of households rose from 10 percent in 1964 to 22 percent in 2012, according to data analyzed by economist Emmanuel Saez, one of the nation’s leading experts on data related to inequality. Comprehensive data from the Congressional Budget Office on the share of income going to the bottom fifth of households only go back to 1979. These data show the bottom fifth’s share dropping from 7.4 percent in 1979 to 6.2 percent in 2010. If the benefits of economic growth had been more widely shared over the last 40 years, the incomes at the bottom of the income distribution would have risen more and poverty would be lower.
Single parenthood: In 1964, some 11 percent of families with children were headed by a single parent; in 2012, 35 percent were. Single-parent families have significantly higher poverty rates than two-parent families, not only because they largely depend on the earnings of just one parent but also because they are more likely to be headed by a parent with less education and thus lower earning potential. This is particularly true among never-married parents, who make up a larger share of single parents than five decades ago. Moreover, many noncustodial parents also have lower education levels and earnings levels, which limits their potential child support contributions. Gender is an additional factor; the majority of single parents are women, and women continue to earn less than men working the same hours in the same industries.
Employment rates for men: While women’s employment rates rose significantly between 1964 and 2012, the share of adult men (aged 18 to 64) who are employed fell from 87 percent to 74 percent over the same period. The decline was largely concentrated among men with a high school diploma or less, further evidence of declining labor market prospects for less-skilled men. (Some of this decline is related to the recent recession; in 2007, 80 percent of men were employed, still well below the 1964 level.)
Men with below-poverty earnings: Between 1964 and 1973, among men who worked year-round (and were working full-time in the month they were surveyed), the share who earned less than the poverty line for a family of four fell significantly. This corresponded to a period of rapidly falling poverty rates and rising incomes among the poorest fifth of households. But, between 1973 and 2012, the trend reversed, and the share of men earning below-poverty wages increased markedly, from 10 percent to 14. This increase came even as the share of adults going to college rose and the economy grew.
More from the Authors

Areas of Expertise

Areas of Expertise