No Mystery Why SNAP Enrollment Remains High: It’s Still the Economy
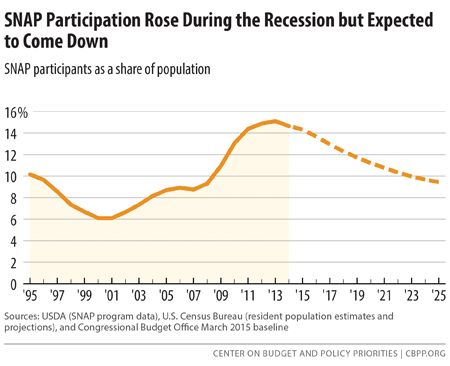
The Supplemental Nutrition Assistance Program (SNAP, formerly known as the Food Stamp Program) historically has been the most responsive federal program, after unemployment insurance, in assisting families and communities during economic downturns. The Great Recession was no exception, as SNAP enrollment rose sharply after 2007. (See Figure 1.) SNAP enrollment remains high compared to historic levels, but it has begun to decline and is expected to fall much further.
Some critics have argued that SNAP enrollment’s failure to fall in tandem with the sharp drop in the unemployment rate over the past couple of years indicates that most of the rise in SNAP’s enrollment growth after 2007 was not related to the economy. The reality, however, is that a critical reason SNAP enrollment and costs are still high is because the job market has continued to exhibit scars from the Great Recession that the unemployment rate does not fully reflect.
- While the labor market has improved and the unemployment rate has declined markedly in the past few years, there is still considerable “slack” in the labor market (people not working who want to be, or people who want to be working more hours than they are), as the Congressional Budget Office (CBO) continues to emphasize in its economic assessments. In particular, the share of the population with a job remains abnormally low, the number of people working fewer hours than they would like remains abnormally high, long-term unemployment remains unusually high, and wage growth continues to be anemic.
- Job losses were huge in the Great Recession, and it has taken years to dig out of the resulting deep jobs hole. The additional job creation needed to catch up with population growth since 2007 and restore full employment has barely begun.
- The enormity of job losses in the Great Recession and fears of deflation led the Federal Reserve’s monetary policymakers to push interest rates as low as conventional monetary policy tools could push them in 2008. The Fed has kept rates low to this day in the face of ongoing labor market slack and no hint of inflationary overheating of the economy.
- Finally, the number of unemployed workers who aren’t receiving any unemployment insurance (UI) benefits — the group of the unemployed most likely to qualify for SNAP because they have neither sufficient wages nor UI benefits — has continued to grow and is higher now than at the bottom of the recession. Even as the overall number of unemployed workers has declined, the number of unemployed workers receiving no UI benefits has increased (reflecting reduced UI protection at both the federal and state levels).
The historical record shows that declines in poverty and SNAP enrollment typically lag behind improvements in the unemployment rate following recessions. As the job market improves and fewer families thus need food assistance, SNAP enrollment and costs should come down. In fact, CBO projects that as the labor market recovers over the next decade, SNAP participation will decline markedly. CBO projects that the number of SNAP participants will fall from 46.5 million in fiscal year 2014 to 32.8 million by 2025. As a result, CBO projects that by 2020, SNAP costs, measured as a share of gross domestic product (GDP), will fall fully back to their level of the mid-1990s.
SNAP Responded to the Recession but Spending Has Begun to Fall and Will Shrink Further as the Economy Improves
SNAP spending rose considerably when the recession hit. That’s precisely what SNAP is designed to do: quickly help more low-income families during economic downturns as poverty rises, unemployment mounts, incomes fall, and more people need assistance. As CBO has stated, “the primary reason for the increase in the number of participants was the deep recession from December 2007 to June 2009 and the subsequent slow recovery.” [1]
Another substantial factor in SNAP enrollment growth was that a higher share of eligible people applied for help from the program; the participation rate among eligible individuals increased from 69 percent in 2007 to 83 percent in 2012 (the most recent year for which estimates are available). In part, the economic downturn likely drove the higher participation rate, as the widespread and prolonged effects of the recession may have made it more difficult for family members and communities to help people struggling to make ends meet. Another factor was the Recovery Act’s temporary increase in SNAP benefit levels; research shows that higher benefit levels raise participation rates. (The temporary benefit level has since ended, which some researchers expect to result in a modest reduction in participation rates in coming years.)[2] Finally, states continued efforts they had started before the recession to reach more eligible households, particularly working families and senior citizens, by simplifying SNAP policies and procedures.
As the economy began to improve, SNAP caseloads and spending stabilized and then began falling.[3] SNAP caseloads fell by about 2 percent in fiscal year 2014; 1.5 million fewer people participated in SNAP in December 2014 than when participation peaked in December 2012.[4] In dollar terms, SNAP spending fell by 8 percent in 2014.[5]
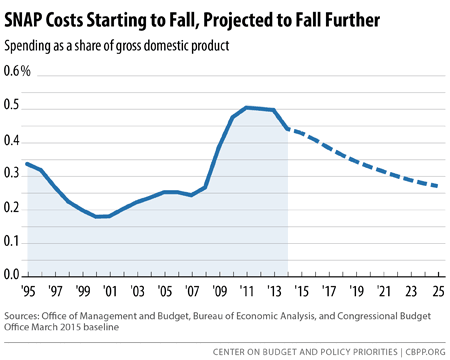
As the economic recovery continues and fewer low-income people qualify for SNAP, CBO expects SNAP caseloads and spending to fall further in future years. CBO expects the share of the population receiving SNAP assistance to be close to its pre-recession level of about 9 percent by 2025 (the end of CBO’s ten-year budget window). As noted, CBO also expects SNAP spending, which fell by 11 percent as a share of GDP in 2014, to return to its 1995 level as a share of GDP by 2020. (See Figure 2.) Thus, while CBO recently projected that the overall gap between federal spending and revenues will grow starting in 2018, SNAP is not contributing to this problem; CBO forecasts that SNAP will decline as a share of the economy over the entire ten-year budget window.[6]
While they have recently begun to fall, SNAP spending and caseloads remain at high levels as of now. That shouldn’t be surprising, however, given the severity of the Great Recession and the serious scars that remain.
Labor Market Still Bears Scars from the Great Recession
The Great Recession of 2007-09 was the worst recession since the 1930s and was followed by the deepest and most protracted jobs slump since the Great Depression.
Job losses far exceeded those in other recent recessions. Although the unemployment rate did not go quite as high in the Great Recession as it did in the 1981-82 recession, it actually rose more from the beginning of the recession in December 2007 to its highest point in October 2009, precipitating a sharp increase in SNAP caseloads and costs.[7]
The 1981-82 recession was caused largely by the Federal Reserve slamming on the monetary policy brakes to combat double-digit inflation. Once the Fed eased up, the economy began to recover and unemployment fell relatively rapidly. The Great Recession, in contrast, resulted from a severe financial crisis. Economists Carmen Reinhart and Kenneth Rogoff have argued that, historically, recoveries from recessions arising from financial crises have been much slower and more difficult than those from recessions with other causes.[8] That’s certainly been true for the recovery from the Great Recession, and the protracted jobs slump in its wake is the main reason that SNAP caseloads and costs continued to grow into 2013 and have only recently begun to fall.
The Great Recession Created a Huge Jobs Deficit
Figure 3 illustrates how job losses in the Great Recession far exceeded those in other recent recessions. The 1981-82 recession and recovery was a classic “V-shaped” episode, with jobs bouncing back in the recovery as quickly as they were lost in the recession. The early 1990s and early 2000s episodes combined relatively mild recessions with “jobless recoveries” in which job creation did not begin until well after the economy had begun to grow again. The latest episode has combined the worst of both worlds: job losses far exceeded even those in the 1981-82 recession and, as in the early 1990s and early 2000s, the ensuing jobs slump was far more protracted than the recession itself.
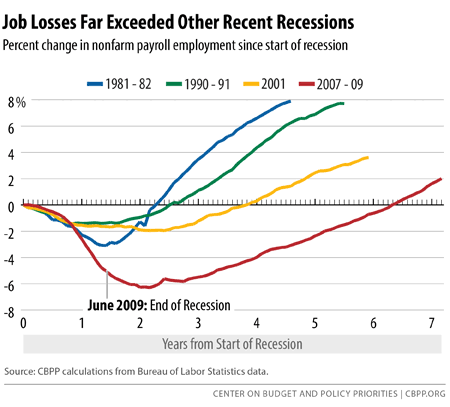
The enormous jobs deficit created by the Great Recession was not erased until the middle of 2014. But because the working-age population has grown since then, the number of jobs remains well short of what is needed to achieve full employment.
Significant Labor Market Slack Remains
Labor market slack refers to a situation in which an abnormally large number of people who would like to work aren’t working or people with a job are not working as many hours as they would like. The unemployment rate is the most common measure of labor market slack, but many analysts, including both of the last two chairs of the Federal Reserve, have observed that the unemployment rate has provided an incomplete picture of the extent of labor market slack in recent years.
In July 2013, then-Fed Chairman Ben Bernanke said, “[The current unemployment rate] if anything, overstates the health of our labor markets given participation rates and many other indicators of underemployment and long-term unemployment.”[9] In March 2014, when the unemployment rate had fallen a further percentage point since Bernanke’s observation, current Fed Chair Janet Yellen said, “In some ways, the job market is tougher now than in any recession,”[10] pointing to some of the same indicators as Bernanke. More recently, a January 2015 CBO presentation states, “Employment climbed briskly in 2014, but a significant amount of slack in the labor market remains.”[11]
Labor market slack since 2007 reflects the collapse of demand for goods and services in the Great Recession and its slow recovery since. Businesses and stores still have more capacity to supply goods and services than they have customer demand. With a still-plentiful supply of people seeking jobs, businesses can be picky in their hiring and stingy in their pay. As long as significant slack remains, limited job opportunities and weak wage growth will keep SNAP participation among low-wage workers higher than it would be in a stronger labor market.
Figure 4 shows that although the unemployment rate has fallen substantially over the past few years, it remains above its 2007 level. Moreover, other indicators show that the unemployment rate does not fully capture the extent of the remaining slack.
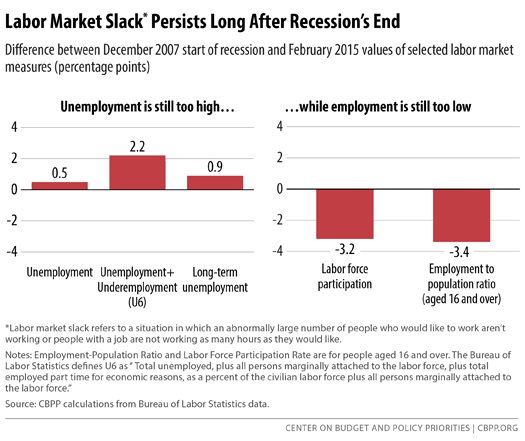
Unemployment. The unemployment rate in February 2015 was 5.5 percent, 0.5 percentage points higher than at the start of the recession. No one knows for sure how low the unemployment rate can go without triggering inflation concerns among the Fed’s monetary policymakers, but both they and CBO believe there is room for a further decline.[12]
Labor-Force Participation. Bernanke’s mention of labor-force “participation rates” refers to the fact that the official unemployment rate does not include the large number of people who want a job — and in many cases would likely have found one in a stronger labor market — but are pessimistic about their current labor-market prospects and haven’t looked enough recently to count as officially unemployed. (This group is referred to as people who are “marginally attached to the labor force.”) The labor-force participation rate — the share of people aged 16 and over who are either working or have looked for work recently enough to be counted as officially unemployed — fell in the Great Recession and then continued to decline through 2013. While the participation rate stabilized in 2014, it remains 3.2 percentage points lower than it was at the start of the recession — and is still lower, except for the Great Recession years, than at any time since the 1970s, when the share of women in the labor market was much smaller.
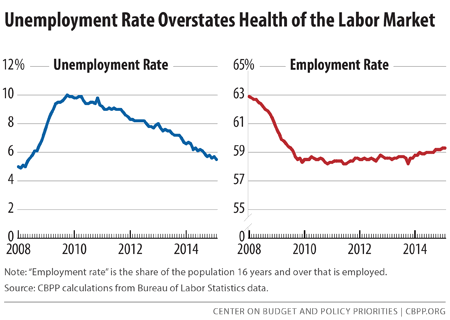
Employment-Population Ratio. As a result of the combination of a rising unemployment rate and a falling labor-force participation rate, the share of people aged 16 and over who have a job — what is often called the employment rate (or, more technically, the employment-to-population ratio) — plunged in the recession to levels not seen since the mid-1980s. For most of the recovery, falling labor-force participation offset declines in the unemployment rate; and from 2010 through 2013, the percentage of the adult population that was employed remained roughly 4 percentage points lower than at the start of the recession. (See Figure 5.) With labor-force participation stabilizing in 2014 — albeit at a low level — and unemployment continuing to fall, the employment rate has risen modestly. But it remains 3.4 percentage points lower than it was at the start of the recession.
Some of the decline in the labor-force participation rate and hence in the employment-to-population ratio would have occurred even in a healthy labor market, as the share of the population in age groups with much lower labor-force participation rates (especially older people)[14] rose while the share of prime-working-age people fell. But labor-force participation among people aged 25-54 has also fallen since 2007, and their employment rate in February 2015 was 2.4 percentage points lower than at the start of the recession.
SNAP caseload trends in many states, which stabilized for a few years before starting to fall over the last year, more closely mirror the slow and incomplete recovery of the employment rate than the more rapid decline in the unemployment rate. This suggests that some SNAP participants may be among those who have been out of work but are slowly re-entering the labor force as conditions improve.
Underemployment. The Labor Department’s most comprehensive alternative unemployment rate measure — which includes people who want to work but are not actively looking (those marginally attached to the labor force) as well as people who are working part time because they can’t find full-time jobs — stood at 11.0 percent in February. That’s 2.2 percentage points higher than at the start of the recession. By that measure, about 17.5 million people are unemployed or underemployed, or twice the 8.7 million people in the official unemployment measure. SNAP can provide vital financial support to low-wage workers who need to work full time to support their families but can only find part-time employment.
Sluggish Wage Growth. Another sign that the labor market has not improved as much as the drop in the unemployment rate alone might suggest is the lack of wage growth thus far in the recovery. Private sector average hourly earnings before adjusting for inflation have grown at a relatively steady 2 percent per year for the past five years. Consumer price inflation has been much more volatile over that same period, but on average has grown only a couple of tenths of a percent a year more slowly, meaning that real wages have largely stagnated over the period. With many more jobseekers than jobs, employers have faced little pressure to raise wages.
Low-wage workers likely to qualify for SNAP have fared even worse, as their real (inflation-adjusted) wages have declined steadily since 2009. Real hourly wages at the 25th percentile of the wage distribution in the last quarter of 2014, for example, were 5 percent below their 2009 levels.[15]
To be sure, sluggish wage growth, especially among low-wage workers, has been an endemic problem in the economy for more than three decades.[16] Between 1973 and 2013, the share of male workers who earned below-poverty hourly wages (i.e., wages too low to lift a family of four to the poverty line with full-time, year-round work) rose from 17 percent to 24 percent.[17]
Employment growth sufficient to eliminate labor-market slack can produce real wage gains for all workers, including low-wage workers, as happened in the late 1990s. But labor markets are nowhere near as tight now as they were then.
Low and declining wages matter for SNAP caseloads because the share of SNAP households that have earnings while participating in the program has risen substantially in recent decades and continued to grow during and after the recession. More than half of families with children that receive SNAP have earnings while receiving SNAP benefits. Thus, while unemployment statistics are helpful in understanding the economy’s impact on SNAP caseloads, many employed low-wage workers receive help from the program. When people leave the ranks of the unemployed for a low-wage job as the economy slowly recovers, they often remain eligible for SNAP. Sluggish wage growth can keep them there longer, and as a result SNAP caseloads may remain elevated due to workers continuing to qualify for and need SNAP even while employed.
Long-Term Unemployment Remains High and an Increasing Number of Unemployed Do Not Receive Unemployment Insurance Benefits
Both the duration of unemployment and the prevalence of long-term unemployment — defined as being unemployed for 27 weeks or longer (i.e., for over half a year) — were sharply higher in the Great Recession and ensuing jobs slump than in any previous downturn, with data going back to the late 1940s. The percentage of unemployed workers who are long-term unemployed soared above 40 percent by the end of 2009 and didn’t drop below that until the end of 2012. That’s far above its previous peak of 26 percent following the 1981-82 recession. At over 30 percent in February 2015, the share of unemployed workers who have been out of work for more than half a year still exceeds that earlier peak. (See Figure 6.)
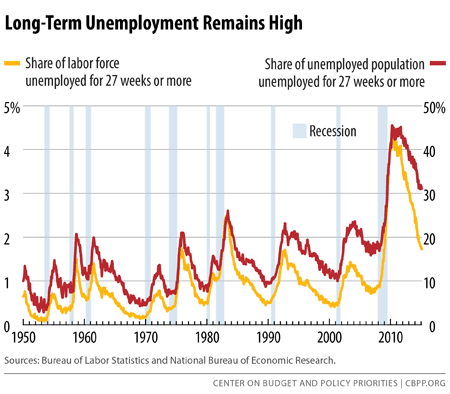
The long-term unemployment rate (the long-term unemployed as a share of the labor force) was 1.7 percent in February 2015. That’s down substantially from its unprecedented peak in 2010. But it’s still nearly twice as high as it was at the start of the recession.
As the jobs slump following the recession dragged out, SNAP became increasingly important to the long-term unemployed. It was one of the few resources for people who exhausted their unemployment insurance (UI) benefits (or never qualified for them) and remained unable to find a job.
The growing number of unemployed workers not receiving UI benefits is another factor contributing to the ongoing demand for SNAP benefits. This trend appears to be driven by increases in the number of people who have lost their jobs but are no longer receiving UI, rather than increases in the number of people who aren’t eligible for UI in the first place because they have quit their old job to look for a different one or are new entrants or re-entrants to the labor force.
From 2008 through 2013, long-term unemployed workers who ran out of their regular state UI benefits (typically after 26 weeks) received additional weeks of federal benefits. Policymakers allowed the federal UI program to expire at the end of 2013. Since then, unemployed workers have received no jobless benefits beyond the 26 weeks of regular state UI provided in most states. Moreover, in recent years, eight states have cut back the maximum number of weeks of UI they offer below 26 weeks.[18] As a result, many of unemployed workers have failed to find work before their benefits have run out.
In 2009, the year the recession officially ended, 14.3 million workers were officially unemployed and 9.2 million of them received UI benefits — leaving about 5.1 million jobless workers with no UI benefits. In 2014, many fewer workers were officially unemployed — 9.6 million. But more unemployed workers were without UI benefits — about 6.9 million. Taken another way, fewer than three in ten (27 percent) of unemployed workers are now receiving unemployment benefits. This is the lowest level on record (with data that go back to 1971).[19]
In other words, the number and share of unemployed workers who are in the worst shape — because they have neither wages nor unemployment benefits — is greater now than at any previous point in many years, including when the economy hit bottom during the Great Recession.
SNAP benefits are particularly important for these workers, who have lost their jobs and lack both wages and UI benefits — and consequently are more likely to qualify for SNAP than workers earning wages or receiving UI.
The erosion of UI benefits is part of a larger picture: when real wages erode on the lower rungs of the wage scale, the real value of the minimum wage is allowed to fall, and unemployment benefits are cut back, SNAP participation and costs are pushed up.
Historically, Declines in Poverty and SNAP Have Lagged Behind Improvements in Unemployment
Critics of SNAP who argue that participation and program costs should fall in line with the unemployment rate have not looked carefully at the historical record. There is a long history of declines in poverty, hardship, and SNAP participation lagging behind improvements in the economy after an economic downturn.
As CBO has observed:
Even as the unemployment rate began to decline from its 1992, 2003, and 2010 peaks, decreases in [SNAP] participation typically lagged improvement in the economy by several years. For example, the number of SNAP participants rose steadily from about 20 million in the fall of 1989 to more than 27 million in April 1994 — nearly two years after the unemployment rate began to fall and a full three years after the official end of the recession in March 1991.[20]
When CBO made this observation in 2012, it was predicting that 46.2 million people would be receiving SNAP benefits in fiscal year 2015. This is virtually identical to CBO’s current estimate of 46.0 million participants for the current fiscal year.[21] As noted above, CBO expects the number of SNAP participants to fall to pre-recession levels by the end of the decade.
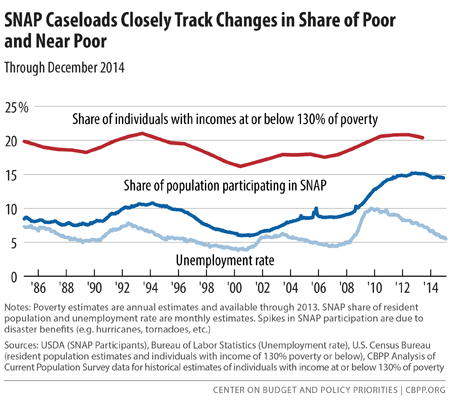
The number of people who have income below or near the official poverty level has followed a similar pattern since the end of the recession. While the unemployment rate had already begun to decline by 2013 (the most recent year for which Census Bureau data on income and poverty are available), the share of people with income at or below 130 percent of the poverty line (the federal SNAP gross income limit) had declined only slightly. (See Figure 7.)
One reason that SNAP enrollment may remain high for several years after a recession ends and the unemployment rate begins to decline is that people who find jobs with low wages and limited hours often will still be eligible for SNAP. A second reason may be that the least-skilled workers are slower to be hired back. Less-skilled workers are liable to be among the “first fired” in a downturn and the “last hired” in a recovery. A report from the U.S. Department of Agriculture’s Economic Research Service notes that the research indicates that:
One explanation for a lagged response of SNAP participation to a reduction in the unemployment rate during the early stage of an economic recovery is that labor market outcomes (such as unemployment) for less-skilled workers vary more over the business cycle than do those of more-skilled workers. The improvement of economic conditions during the early stage of recovery, when the unemployment rate finally starts to fall, takes longer to be felt by low-income workers in low-skilled jobs, who are more likely to participate in SNAP.[22]
This study is based on 1976-2010 data, and therefore does not fully reflect the special features of the labor-market slack and long-term unemployment in the recovery from the Great Recession described above. In almost all dimensions, the Great Recession and subsequent protracted jobs slump were more severe than any in the period the study covered. It has taken significantly longer in the current recovery for the effects of the improvement in economic conditions to be felt even by the average worker, much less the low-income workers likely to participate in SNAP.
Conclusion
Once the true state of the labor market and the historical relationship between changes in SNAP and the economy are taken into account, there is nothing surprising about the fact that SNAP participation and program costs have not fallen in tandem with the unemployment rate in the past few years. The labor market has improved substantially from the severe blows of the Great Recession, and SNAP enrollment and costs have begun to decline. They should continue to decline as the economy gets closer to full employment — as they have in previous economic recoveries and as CBO projects that they will in the years ahead.
End Notes
[1] Congressional Budget Office, “The Supplemental Nutrition Assistance Program,” April 2012, http://www.cbo.gov/sites/default/files/cbofiles/attachments/04-19-SNAP.pdf.
[2] James Ziliak. “Why Are So Many Americans on Food Stamps? The Role of Economy, Policy, and Demographics,” University of Kentucky Center for Poverty Research Discussion Paper Series DP2013-01, September 2013, http://www.ukcpr.org/sites/ukcpr.org/files/documents/DP2013-01.pdf.
[3] Dottie Rosenbaum and Brynne Keith-Jennings, “SNAP Costs Declining, Expected to Fall Much Further,” Center on Budget and Policy Priorities, February 9, 2015, https://www.cbpp.org/cms/index.cfm?fa=view&id=4054.
[4] This figure is based on preliminary data from USDA’s Food and Nutrition Service (available at http://www.fns.usda.gov/pd/supplemental-nutrition-assistance-program-snap).
[5] SNAP caseloads fell by 2 percent in 2014 and further declines in the number of participants are expected to be a major factor in the decline in SNAP costs that CBO projects over the coming decade. However, the benefit reduction that took effect in November 2013, as a result of the expiration of the Recovery Act’s temporary SNAP benefit increase, was a larger factor in the decline in SNAP costs in fiscal year 2014. See Rosenbaum and Keith-Jennings, 2015.
[6] Congressional Budget Office, “Updated Budget Projections: 2015 to 2025,” https://www.cbo.gov/publication/49973.
[7] The unemployment rate rose by 5.0 percentage points (from 5.0 percent in December 2007 to a peak of 10.0 percent in October 2009, four months after the formal end of the recession in June). In the 1981-82 recession, by comparison, the unemployment rate rose 3.6 percentage points, from 7.2 percent in July 1981 to a peak of 10.8 percent in November and December 1982. Unemployment at the start of that recession had not fully recovered from the short, sharp 1980 recession, but even the 4.5-percentage-point rise in unemployment from 6.3 percent at the start of the 1980 recession to 10.8 percent at the end of 1982 still falls short of the 5.0-percentage-point rise in the Great Recession.
[8] Carmen Reinhart and Kenneth Rogoff, This Time Is Different: Eight Decades of Financial Folly, 2011, http://press.princeton.edu/titles/8973.html.
[9] “Bernanke Talks: A Conversation at the NBER,” Real Time Economics, Wall Street Journal, July 11, 2013, http://blogs.wsj.com/economics/2013/07/11/bernanke-talks-a-conversation-at-the-nber/
[10] See Janet L. Yellen, “What is the Federal Reserve Doing to Promote a Stronger Job Market,” March 31, 2014, http://www.federalreserve.gov/newsevents/speech/yellen20140331a.htm.
[11] Congressional Budget Office, “The Economic Outlook for 2015 to 2025 in 17 Slides,” Slide 9, January 2015, http://www.cbo.gov/publication/49909.
[12] With inflation running well below the Fed’s 2 percent goal, Fed policymakers are likely to lower their projections for the sustainable non-inflationary unemployment rate from the current published projections of 5.2 to 5.5 percent. See Ann Saphir and Howard Schneider, “Shifting goal posts on employment may signal slower Fed rate hikes,” Reuters, February 11, 2015, http://www.reuters.com/article/2015/02/11/us-usa-fed-employment-insight-idUSKBN0LF0AB20150211.
[13] To be counted as officially unemployed, a respondent to the Census Bureau’s monthly Current Population Survey — which is used to estimate the unemployment rate — must have looked for a job in the four weeks prior to the survey. A person who wants and is available for work and has looked in the past year but not in the most recent four weeks is considered “marginally attached” to the labor force but not officially unemployed.
[14] About 63 percent of people aged 16 and over are currently in the labor force (either working or looking for work). That percentage is about 55 percent for people aged 16-24; about 81 percent for those aged 25-54; about 64 percent for those aged 55-64; and about 19 percent for those aged 65 and over. Baby boomers are beginning to swell the latter two groups.
[15] CBPP calculations based on Bureau of Labor Statistics usual weekly earnings data adjusted for inflation using the CPI-U-RS.
[16] See Figure 4 in Lawrence Mishel, et al., “Wage Stagnation in Nine Charts,” Economic Policy Institute, January 6, 2015, http://www.epi.org/publication/charting-wage-stagnation/.
[17] Economic Policy Institute, “State of Working America 12th Edition,” Figure 4E, http://www.stateofworkingamerica.org/chart/swa-wages-figure-4e-share-workers-earning/.
[18] See “Policy Basics: How Many Weeks of Unemployment Compensation Are Available?” Center on Budget and Policy Priorities, updated March 9, 2015, https://www.cbpp.org/cms/?fa=view&id=3164, and Will Kimball and Rick McHugh, “How Low Can We Go? State Unemployment Insurance Programs Exclude Record Numbers of Jobless Workers,” Economic Policy Institute, March 9, 2015, http://www.epi.org/publication/how-low-can-we-go-state-unemployment-insurance-programs-exclude-record-numbers-of-jobless-workers/.
[19] See Figure 1 in Claire McKenna, “The Job Ahead: Advancing Opportunity for Unemployed Workers,” National Employment Law Project, February 2015, http://www.nelp.Norg/page/-/UI/Report-The-Job-Ahead-Advancing-Opportunity-Unemployed-Workers.pdf?nocdn=1.
[20] CBO, op. cit., p 3.
[21] The unemployment rate has fallen more than CBO projected in its 2012 economic estimates. However, other job market indicators have largely been in line with CBO’s projections, and economic growth has been less strong than CBO projected at that time. Thus, CBO’s overall projections for the economy from 2012 to 2015 have not turned out to be unduly pessimistic and hence its 2012 projection of future SNAP participation is in hindsight not unduly pessimistic.
[22] Kenneth Hanson and Victor Oliveira, “How Economic Conditions Affect Participation in USDA Nutrition Assistance Programs,” U.S. Department of Agriculture, Economic Research Service, EIB-100, September 2012, http://www.ers.usda.gov/media/914042/eib100.pdf.
More from the Authors

Areas of Expertise

Areas of Expertise
