Ryan Budget Would Slash SNAP Funding By $135 Billion Over Ten Years
Low-Income Households in All States Would Feel Sharp Effects
House Budget Committee Chairman Paul Ryan’s budget plan includes cuts in the Supplemental Nutrition Assistance Program (SNAP, formerly known as the Food Stamp Program) of $135 billion — almost 18 percent — over the next ten years (2014-2023),[1] which would necessitate ending assistance for millions of low-income families, cutting benefits for millions of such households, or some combination of the two. Chairman Ryan proposed similarly deep SNAP cuts in his last two budgets.
While Chairman Ryan has outlined some key features of his proposal as it affects SNAP — in particular, converting SNAP to a block grant beginning in 2019 — he has provided little information on how the cuts would be achieved or their timing over the ten-year period.[2]
Since more than 90 percent of SNAP expenditures are for food assistance benefits for low- income households, and most of the remaining funds go for necessary state administrative costs to determine program eligibility and operate the program properly, policymakers couldn’t possibly achieve cuts of this magnitude without substantially scaling back SNAP eligibility or reducing benefits deeply, with serious effects on low-income families and individuals.[3] Under the specifications Chairman Ryan has made public, $125 billion of the $135 billion are slated to take place over the 2019 to 2023 period — a 34 percent cut over these five years. Table 1 provides state-by-state estimates of the potential impact.
- Cuts in eligibility: If the cuts were to come solely from eliminating eligibility for categories of currently eligible households or individuals, 12 million to 13 million people would need to be cut from the program.[4]
-
Cuts in benefits: If the cuts were to come solely from across-the-board benefit cuts, SNAP benefits would have to be cut by an average of more than $50 per person per month beginning in 2019 (in 2019 dollars.) This would require setting the maximum benefit at about 73 percent of the Thrifty Food Plan (TFP), USDA’s estimate of the minimumamount that a family needs to afford a bare-bones, nutritionally adequate diet. (Under SNAP rules, the maximum benefit levels for each fiscal year — which are the benefit amounts that go to households with no disposable income after deductions for certain necessities — are set at 100 percent of the cost of the Thrifty Food Plan for the preceding June.)[5]
The impact of such a change would be pronounced. All families of four — including the poorest — would see their benefits cut by about $190 a month in fiscal year 2019, or almost $2,300 on an annual basis. All families of three would be subject to cuts of about $150 per month, or about $1,800 on an annual basis. Of course, policymakers could shield some households from such deep cuts, but then other households would need to bear even larger cuts in order to produce the $135 billion in savings.
While Congress might not seek to hit the Ryan targets through eligibility cuts or benefit cuts alone, these examples illustrate the size of the proposed funding reductions that would have to be made. There would not be a lot of other places to go to achieve the required cuts; as noted, more than 90 percent of SNAP expenditures are for food assistance benefits for low-income households.
Ryan’s Proposed Cuts Rest on Inaccurate Claims
Chairman Ryan bases his proposed SNAP cuts on a series of inaccurate claims about SNAP program growth, work disincentives, and waste, fraud, and abuse.
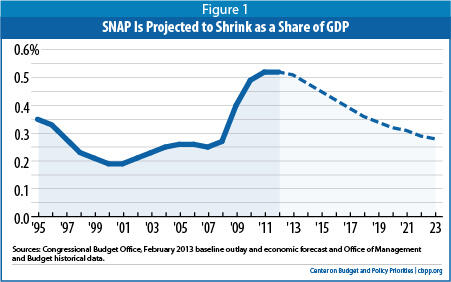
- Spending growth. Chairman Ryan partially justifies deep SNAP cuts on the grounds that “[SNAP] is facing a budget crunch.”[6] While SNAP spending did grow substantially during the recession, the recent growth in SNAP expenditures is temporary and already has slowed. SNAP grew because of three factors — the depth of the recent recession, improvements in the program’s performance in reaching eligible low-income households (particularly working families), and the Recovery Act’s temporary benefit boost (which will end later this year.)[7] Moreover, the program does not contribute to the nation’s long-term budget problem because it is projected to grow no faster than the economy over time. As Figure 1 indicates, the Congressional Budget Office’s (CBO) latest projections show that once the economy fully recovers, SNAP is expected to return to pre-recession levels as a share of the Gross Domestic Product.
- Improved participation among eligible low-income households. Chairman Ryan’s budget documents also criticize longstanding bipartisan efforts at both the federal and state levels to increase SNAP participation among eligible low-income households. The current and previous two Administrations and governors from across the political spectrum have sought to boost participation among low-income individuals who are eligible for SNAP but not participating. These efforts have largely aimed at working-poor families and low-income elderly people, the two eligible groups with the lowest participation rates. Overall, the efforts have paid off. SNAP reached 75 percent of all eligible individuals in a typical month in 2010 (the most recent year available.) This is a significant improvement from 2002, when the participation rate bottomed out at 54 percent. The participation rate among eligible low-income working families rose from 43 percent in 2002 to about 65 percent in 2010. For the elderly, it improved more modestly over those years — from 26 percent in 2002 to about 35 percent in 2010. Chairman Ryan suggests that one benefit of capping SNAP funding would be to halt such efforts by inducing states to cease efforts to connect eligible low-income people to SNAP.
- Work and dependency. Another of Chairman Ryan’s justifications for cutting SNAP and turning it over to states is to imply that SNAP recipients do not have a strong work ethic. The budget states that SNAP has “little incentive to help people get off the roles (sic) and find work.”[8] Yet, a recent Center analysis finds that the large majority of SNAP recipients who can work do so. Among SNAP households with at least one working-age, non-disabled adult, more than half work while receiving SNAP — and more than 80 percent work in the year prior to or the year after receiving SNAP. The rates are even higher for families with children — more than 60 percent work while receiving SNAP, and almost 90 percent work in the prior or subsequent year. Among SNAP households that start receiving SNAP, only 4 percent that worked in the year before starting to receive SNAP did not work in the following year. The number of SNAP recipients who work while receiving SNAP has more than tripled over the past decade.[9]
- Waste, fraud, and abuse. Finally, Chairman Ryan justifies his SNAP proposals based on charges that SNAP is rife with waste, fraud, and abuse. These claims ignore the fact that SNAP has one of the most rigorous quality control systems of any public benefit program. Despite the recent growth in caseloads, the share of total SNAP payments that represent overpayments or payments to ineligible households reached a record low of 2.99 percent in fiscal year 2011. In addition, the Agriculture Department (USDA) has cut “trafficking” — the sale of SNAP benefits for cash, which violates federal law — by three-quarters over the past 15 years. Only 1 percent of SNAP benefits is trafficked. USDA has also permanently disqualified thousands of retail stores from the program for not following federal requirements. When cases of SNAP fraud are reported in the news, it is because the offenders have been caught, evidence that states and USDA are aggressively combating fraud.
Benefit Cuts Would Primarily Affect Low-Income Families with Children, Seniors, and People with Disabilities
The Ryan budget documents assert that Congress could achieve the required savings by capping federal funding for SNAP and “giving states more flexibility to design these programs according to their recipients’ needs” through a block grant. That description leaves the mistaken impression that the program is not serving a population that is overwhelmingly poor and that savings could be achieved without causing significant harm to millions of vulnerable Americans.
Unlike most means-tested benefit programs, which are restricted to particular categories of low-income individuals, SNAP is broadly available to almost all households with very low incomes. As a result, cutting SNAP would affect broad swaths of the low-income population. Currently, 47.8 million people receive SNAP assistance to help them buy food for their families. Census data show that in 2011 (the latest year for which these data are available), 46.2 million Americans lived below the poverty line, and 64.2 million lived below 130 percent of the poverty line, SNAP’s gross income limit.[10]
- The overwhelming majority of SNAP households are families with children, seniors, or people with disabilities. Almost three-quarters of SNAP participants are in families with children; more than one-quarter are in households that include senior citizens or people with disabilities.Image
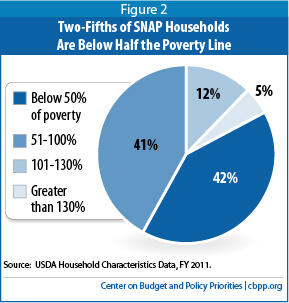
- SNAP households have very low incomes. Eighty-three percent of SNAP households have incomes below the poverty line (about $19,500 for a family of three in 2013). Such households receive 91 percent of SNAP benefits. Two of every five SNAP households have incomes below half of the poverty line. (See Figure 2.) Such individuals and families have little flexibility in their monthly budgets to cope with deep reductions in food assistance.
- Low-wage workers rely on SNAP to boost their monthly income. Millions of Americans live in households whose earnings are not sufficient to meet basic needs. In 2011, some 38 million people (1 in 8 Americans) worked or lived in a working family with cash income below 130 percent of the poverty line (about $25,000 for a family of three in 2013). Low incomes like these — which typically reflect low wages or limited work hours — can leave families unable to afford necessities like food and housing on a reliable basis. SNAP benefits play a crucial role in boosting families’ monthly income: in 2011 a typical working mother with two children on SNAP earned $1,105 per month ($13,300 on an annual basis) and received $282 per month in SNAP benefits.[11] If the Ryan proposal had been in place in 2011 and was implemented via across-the-board cuts, this family’s monthly benefits would have been cut by $123 per month — or about 44 percent.
SNAP Already Faces Deep Cuts
The 2009 Recovery Act temporarily boosted the maximum SNAP benefit by 13.6 percent and raised benefits for all SNAP households. Most households received an additional $20 to $24 per person per month in fiscal years 2009 through 2011 and smaller increases in fiscal years 2012 and 2013. Economists consider this increase one of the most effective and fast-acting provisions of the economic recovery package. Low-income individuals generally spend all of their income meeting daily needs such as shelter, food, and transportation, so every dollar in SNAP that a low-income family receives enables the family to spend an additional dollar on food or other items. Eighty percent of SNAP benefits are redeemed within two weeks of receipt and 97 percent are spent within a month.
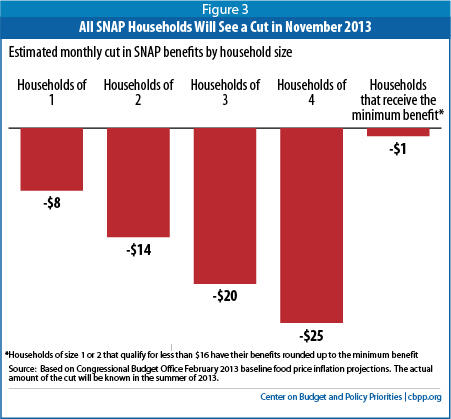
The Recovery Act called for SNAP benefits to remain at their new, higher level until the program’s regular annual inflation adjustments overtook it. However, as a result of legislation passed in 2010, the increase will terminate in November 2013, causing a sizeable and abrupt benefit reduction for all households on the program. Based on CBO’s latest food inflation projections, for families of three, the cut likely will be $20 to $25 a month. (See Figure 3.) That is a substantial loss, especially in light of the low level at which basic SNAP benefits are set. Without the Recovery Act’s boost, SNAP benefits average about $1.40 per person per meal.
The November cuts will likely cause hardship for some SNAP participants, who include 22 million children (10 million of whom live in “deep poverty,” with family incomes below half of the poverty line) and 9 million people who are elderly or have a serious disability. Cutting these households’ benefits will reduce their ability to purchase sufficient food to last through the month. This cut will be the equivalent of taking away 14 meals per month for a family of four, or 11 meals for a family of three, based on calculations using the $1.70 to $2 per meal provided for in the Thrifty Food Plan. USDA research has found that the Recovery Act’s benefit boost cut the number of households in which one or more persons had to skip meals or otherwise eat less because they lacked enough money — what USDA calls “very low food security” — by about 500,000 households in 2009.[12]
More recent research finds that boosting SNAP benefits during the summer for households with school-aged children who don’t have access to USDA’s summer food program cut very low food security among these households by nearly 20 percent.[13]
The current SNAP benefit allotments may be inadequate, as a recent comprehensive study from the Institute of Medicine details.[14] Given this, we can reasonably assume that a reduction in SNAP benefit levels of this size will significantly increase the number of poor households that have difficulty affording adequate food this fall.
In addition, the SNAP program’s severe time limit that unemployed childless adults face — three months out of every three years — will be reinstated in many areas of the country in coming months. Under longstanding authority, states can waive this time limit during periods of high unemployment. (In addition, the Recovery Act suspended the time limit temporarily for all states in 2009 and 2010.)[15] As a result, most states have had waivers from the three-month time limit since 2008 or 2009. As the economy improves, states will no longer qualify for statewide waivers and will be required to reinstate the three-month limit in many or all areas.[16] As a result, approximately 1 million unemployed low-income individuals will be cut off SNAP in a typical month.
Added SNAP Benefit Cuts Would Increase Hunger and Poverty
SNAP cuts of the magnitude that the Ryan budget proposes would almost certainly lead to increases in hunger and poverty. Emergency food providers report that more people ask for help in the latter half of the month, after their SNAP benefits have run out. A cut of the size that the Ryan budget calls for would mean that a typical household’s SNAP benefits would run out a week or more earlier, placing greater strain on household finances (and on emergency food providers) and significantly increasing the risk of hunger.
Deep SNAP cuts also would cause more families and individuals to fall into poverty and cause poor families to fall deeper into poverty. Currently, the program helps lessen the extent and severity of poverty; Census Bureau data on disposable family income that include the value of SNAP and other non-cash benefits and taxes, along with cash income, show that:
- SNAP lifted 4.7 million Americans above the poverty line in 2011, including 2.1 million children.
- SNAP kept more children — 1.5 million — from falling below half of the poverty line in 2011 than any other program.[18]
The Ryan SNAP cuts would thus have a sharp, adverse effect on millions of the lowest-income Americans. Moreover, these cuts would not occur in isolation. The Ryan budget contains steep cuts in other low-income assistance programs as well, compounding the effects of the SNAP cuts. Many vulnerable families would lose health coverage, housing assistance, and other important supports such as child care at the same time they faced cuts in their SNAP benefits.
Cuts Could Be Even Larger Under a Block Grant
As noted above, Chairman Ryan’s budget calls for block-granting SNAP. Under a block grant structure, the program would lose its ability to respond automatically to the increased need that results from rising poverty and unemployment during economic downturns. Annual federal funding would remain fixed, regardless of whether the economy was in a recession or how severe a downturn was. As a result, the House Budget Committee staff’s estimate that the Ryan block grant would cut SNAP by $125 billion over ten years may understate the magnitude of the cut — the cuts would be still more severe if the economy performs less well over the coming decade than CBO currently projects.
If a SNAP block grant had been in effect in 2012 at funding levels set in 2007, before the recession, the total amount of federal funds available nationally in 2012 would have been about 50 percent below the federal funds actually spent that year (excluding the amounts added by the Recovery Act). Furthermore, under a block grant, SNAP would not be able to respond to increased food needs of individuals caused by natural disasters. Hurricane Sandy victims in New York, New Jersey, and 11 other states were able to access temporary food aid through SNAP.
It also is likely that under a block grant, many states would shift funds away from food assistance to other purposes, which they would be tempted to do when they face large state budget shortfalls (as states continue to do today). SNAP includes several non-food components such as job training and related child care as well as nutrition assistance. Under a block grant structure states could easily divert funds away from food to these purposes and withdraw state funds currently expended for these services.
| Table 1 Illustrative State-by-State Impact of the Ryan Budget’s SNAP Cuts | ||
| State/Territory | Projected Number of SNAP Participants in FY 2019, and Hence the Number of People Who Would Be Placed at Risk1 | Proportional Distribution of Ryan’s SNAP Benefit Cuts over Fiscal Years 2014-2023 (in billions of dollars)2 |
| Alabama | 771,000 | -$2.11 |
| Alaska | 77,000 | -$0.28 |
| Arizona | 953,000 | -$2.58 |
| Arkansas | 426,000 | -$1.11 |
| California | 3,360,000 | -$10.74 |
| Colorado | 417,000 | -$1.22 |
| Connecticut | 342,000 | -$1.06 |
| Delaware | 126,000 | -$0.34 |
| District of Columbia | 120,000 | -$0.35 |
| Florida | 2,842,000 | -$8.47 |
| Georgia | 1,621,000 | -$4.72 |
| Guam | 37,000 | -$0.17 |
| Hawaii | 150,000 | -$0.69 |
| Idaho | 197,000 | -$0.55 |
| Illinois | 1,585,000 | -$4.74 |
| Indiana | 770,000 | -$2.19 |
| Iowa | 346,000 | -$0.90 |
| Kansas | 258,000 | -$0.69 |
| Kentucky | 720,000 | -$1.97 |
| Louisiana | 804,000 | -$2.35 |
| Maine | 214,000 | -$0.57 |
| Maryland | 607,000 | -$1.67 |
| Massachusetts | 730,000 | -$2.08 |
| Michigan | 1,550,000 | -$4.51 |
| Minnesota | 457,000 | -$1.14 |
| Mississippi | 559,000 | -$1.48 |
| Missouri | 803,000 | -$2.21 |
| Montana | 107,000 | -$0.29 |
| Nebraska | 149,000 | -$0.39 |
| Nevada | 301,000 | -$0.80 |
| New Hampshire | 99,000 | -$0.25 |
| New Jersey | 700,000 | -$2.00 |
| New Mexico | 371,000 | -$1.02 |
| New York | 2,608,000 | -$8.24 |
| North Carolina | 1,414,000 | -$3.68 |
| North Dakota | 50,000 | -$0.14 |
| Ohio | 1,532,000 | -$4.55 |
| Oklahoma | 521,000 | -$1.43 |
| Oregon | 691,000 | -$1.90 |
| Pennsylvania | 1,525,000 | -$4.20 |
| Rhode Island | 146,000 | -$0.44 |
| South Carolina | 737,000 | -$2.08 |
| South Dakota | 88,000 | -$0.25 |
| Tennessee | 1,116,000 | -$3.16 |
| Texas | 3,422,000 | -$9.10 |
| Utah | 235,000 | -$0.61 |
| Vermont | 82,000 | -$0.21 |
| Virginia | 774,000 | -$2.13 |
| Virgin Islands | 21,000 | -$0.08 |
| Washington | 939,000 | -$2.55 |
| West Virginia | 294,000 | -$0.76 |
| Wisconsin | 708,000 | -$1.77 |
| Wyoming | 29,000 | -$0.08 |
| Other SNAP spending2 | NA | -$12.00 |
| Eliminating two SNAP state options3 | -$10.00 | |
| United States | 39,501,000 | -$135.00 |
| Notes: 1. Not all SNAP participants would necessarily be affected by Ryan’s cuts. We distributed CBO’s February 2013 projection of national SNAP participation in fiscal year 2019, based on each state’s percentage share of fiscal year 2012 average participation. 2. The total cut to the SNAP program under the Ryan budget plan is $135 billion over fiscal years 2014 to 2023, $125 billion of which is from the block grant proposal. More than 90 percent of SNAP expenditures are for food assistance benefits for low-income households. The remainder goes to the federal share of state administrative costs for the program, block grants for nutrition assistance in Puerto Rico and American Samoa, funds for commodities for The Emergency Food Assistance Program (TEFAP), and funding for the Food Distribution Program on Indian Reservations (FDPIR). We assume those other activities would bear a proportional share of the block grant cuts ($12 billion). This is a conservative estimate of the share that would come from SNAP benefit reductions because, in the past, Congress has favored these other activities and not looked to them for substantial budget cuts. 3. Along with the block grant proposal, which would begin in 2019, the Ryan budget includes two SNAP cuts that presumably would be in effect between 2014 and 2019: eliminating Broad-Based Categorical Eligibility, a policy option that allows states to align SNAP income and asset eligibility rules with those of programs funded by the Temporary Assistance for Needy Families (TANF); and restricting the ability of states to use receipt of Low Income Home Energy Assistance Program (LIHEAP) benefits for the purpose of conferring the SNAP Standard Utility Allowance as part of their shelter deduction. These provisions would account for about $10 billion of the cuts. Reliable state-level estimates of the impact of these cuts are not available, but the states that have adopted these state options would see somewhat higher cuts over the 10-year period than are shown in the table. Under these assumptions, SNAP benefits would need to be cut by $113 billion over the period. The $113 billion in benefit cuts were distributed across the states in accordance with each state’s percentage share of total fiscal 2012 SNAP benefits. Due to rounding, the state-by-state benefit amounts may not add precisely to the total. | ||
End Notes
[1] House Budget Committee staff provided this figure verbally in response to a question from Rep. Chris Van Hollen during the mark-up of the proposed budget resolution on March 13, 2013.
[2] House Budget Committee, The Path to Prosperity A Responsible, Balanced Budget, House Budget Committee, March 12, 2013, p. 33 and House Budget Committee, Concurrent Resolution on the Budget — Fiscal Year 2014, http://budget.house.gov/uploadedfiles/fy2014_budget_resolution_report.pdf. The budget documents specify that $125 billion in cuts over ten years would come from, beginning in 2019, “converting SNAP into an allotment tailored for each state’s low-income population, indexed for inflation and eligibility.” In addition, the documents mention two policies in addition to the block grant: repealing “expanded categorical eligibility” and ending a SNAP policy known as “heat and eat,” two SNAP cuts that are part of the House Agriculture Committee’s farm bill. These would yield about $10 billion of the $135 billion in savings, presumably over the 2014 to 2018 period.
[3] More than 90 percent of SNAP expenditures are for food assistance benefits for low-income households. The remainder goes to the federal share of state administrative costs for the program, block grants for nutrition assistance in Puerto Rico and American Samoa, employment and training and nutrition education services for SNAP households, funds for commodities for The Emergency Food Assistance Program (TEFAP), and funding for the Food Distribution Program on Indian Reservations (FDPIR). For purposes of this analysis, we assume those other activities would bear a proportional share of the cuts. As a result, we assume that SNAP benefits would need to be cut by $123 billion over the period, with $113 billion coming from the block grant and $10 billion from the other two SNAP provisions. This is a conservative estimate of the share that would come from benefits; in the past, Congress has favored these other activities and not looked to them for large budget cuts. In addition, last year during the Budget Committee mark-up, committee staff indicated that under a block grant, states could cut benefits in order to fund other activities, such as job training. So the cut to SNAP benefits could be deeper than this analysis assumes.
All estimates use the Congressional Budget Office’s February 2013 baseline assumptions. These estimates assume that the two SNAP policy proposals that are included in the $135 billion (see footnote 2) would be in place over the 2014 throuigh 2018 period and the -$125 billion in cuts from the SNAP block grant would be distributed in proportion to the CBO baseline for SNAP, beginning in 2019.
[4] Estimates are relative to CBO’s SNAP participation projections and assume that on average, the individuals who would be cut would otherwise have received the average benefit. If the cut is assumed to go into effect in fiscal year 2019 and were the same proportion of projected SNAP participation in each subsequent year, then the reduction in the number of beneficiaries would be more than 13 million in 2019 and somewhat fewer people in later years because CBO assumes that the number of people participating in SNAP will decline as the economy recovers more fully. If the cut is assumed to be lower initially and become deeper over time then the number of people cut would have to average 12.4 million over the five years from 2019 through 2023.
[5] See USDA’s estimates of the monthly cost of the Thrifty Food Plan at: http://www.cnpp.usda.gov/usdafoodcost-home.htm. To estimate an across-the-board cut, we reduced the size of maximum benefits relative to the TFP by 27 percent each year from 2019 through 2023.
[6] The Path to Prosperity: A Responsible, Balanced Budget, House Budget Committee, March 12, 2013, p. 33.
[7] Dottie Rosenbaum, SNAP is Effective and Efficient, Center on Budget and Policy Priorities, March 11, 2013, https://www.cbpp.org/cms/index.cfm?fa=view&id=3239.
[8] The Path to Prosperity: A Responsible, Balanced Budget, House Budget Committee, March 12, 2013, p. 29.
[9] Dottie Rosenbaum, The Relationship Between SNAP and Work Among Low-income Households, Center on Budget and Policy Priorities, January 29, 2013, https://www.cbpp.org/cms/index.cfm?fa=view&id=3894.
[10] Under federal rules, a household’s monthly income must be at or below 130 percent of the poverty line — or roughly $2,069 a month (about $25,000 a year) for a family of three in 2013 — to qualify. There are some exceptions; for example, households with seniors and people with disabilities are not subject to the gross income test but must have net income (after deductions for certain necessary expenses) at or below 100 percent of the poverty line. States have some flexibility to lift the gross income test for certain other households, while some categories of people are not eligible for SNAP regardless of how low their income and assets may be — such as strikers, certain legal immigrants and many college students, and all undocumented immigrants. Unemployed childless adults may receive SNAP benefits for only three months out of every three years, except in areas with high unemployment.
[11] These are the mean earnings and SNAP benefit for a family of three with earnings and two children for fiscal year 2011, based on USDA Household Characteristics Data. The benefit boost from the American Recovery and Reinvestment Act (ARRA) is scheduled to end in November 2013; this increase has been removed from the figures cited here to show what the typical working mother with two children would receive after the benefit increase is phased out under current law as well as under Chairman Ryan’s budget plan.
[12] Mark Nord and Mark Prell, “Food Security of SNAP Recipients Improved Following the 2009 Stimulus Package,” Amber Waves, 9(2), June 2011, p.6, http://www.ers.usda.gov/media/227714/foodsecuritysnap_1_.pdf.
[13] Evaluation of the Impact of Enhancement Demonstrations on Participation in the Summer Food Service Program (SFSP): FY 2011; FNS, USDA, November 2012, http://www.fns.usda.gov/ora/menu/Published/CNP/FILES/SEBTC_Year1Findings.pdf.
[14] IOM (Institute of Medicine) and NRC (National Research Council), 2013, Supplemental Nutrition Assistance Program: Examining the Evidence to Define Benefit Adequacy, The National Academy Press.
[15] The 2009 Recovery Act included a provision that suspended the three-month time limit for the rest of 2009 and for fiscal year 2010. Because almost all states would have been eligible for a statewide waiver from the time limit under longstanding policy, the effect of this provision was primarily to eliminate the need for individual state waiver requests and federal approval. For information on the rules for state waivers, see 7 C.F.R. 273.24(f) and USDA guidance from December 3, 1996, March 11, 2004, and January 8, 2009, available at www.fns.usda.gov.
[16] Dottie Rosenbaum, The Relationship Between SNAP and Work Among Low-income Households.
[17] Based on CBPP analysis of the Supplemental Poverty Measure. See Kathleen S. Short, ““The Research Supplemental Poverty Measure: 2011,” Bureau of the Census, November 2012, tables 1 and 5a, http://www.census.gov/hhes/povmeas/methodology/supplemental/research/Short_ResearchSPM2011.pdf. The Census Bureau’s Supplemental Poverty Measure defines poverty as family income (cash income after taxes plus the value of SNAP and other food assistance, housing assistance, and energy assistance, minus out-of-pocket medical and work expenses) that falls below an updated poverty line. It uses a broader family unit that includes unmarried partners and foster children.
[18] Unpublished CBPP analysis of the March 2012 Current Population Survey using the Supplemental Poverty Measure.
More from the Authors