Pulling Apart: A State-by-State Analysis of Income Trends
A state-by-state examination finds that income inequality has grown in most parts of the country since the late 1970s. Over the past three business cycles prior to 2007, the incomes of the country’s highest-income households climbed substantially, while middle- and lower-income households saw only modest increases.
During the recession of 2007 through 2009, households at all income levels, including the wealthiest, saw declines in real income due to widespread job losses and the loss of realized capital gains. But the incomes of the richest households have begun to grow again while the incomes of those at the bottom and middle continue to stagnate and wide gaps remain between high-income households and poor and middle-income households. As of the late 2000s (2008-2010, the most recent data available at the time of this analysis):
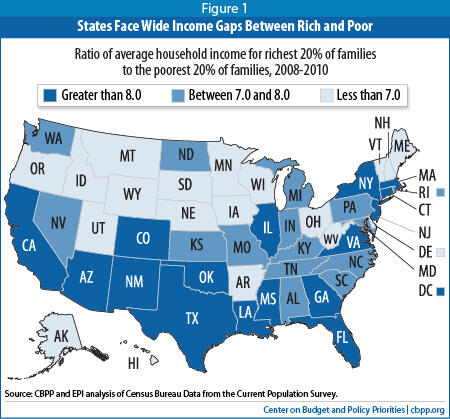
- In the United States as a whole, the poorest fifth of households had an average income of $20,510, while the top fifth had an average income of $164,490 — eight times as much. In 15 states, this top-to-bottom ratio exceeded 8.0. In the late 1970s, in contrast, no state had a top-to-bottom ratio exceeding 8.0.
- The average income of the top 5 percent of households was 13.3 times the average income of the bottom fifth. The states with the largest such gaps were Arizona, New Mexico, California, Georgia, and New York, where the ratio exceeded 15.0.
Methodology
This analysis uses the latest Census Bureau data to measure post-federal-tax changes in real incomes among high-, middle- and low-income households in each of the 50 states and the District of Columbia at four points: the late 1970s, the late 1990s, and the mid-2000s — similar points (“peaks”) in the business cycle — and the late 2000s.
In order to generate large enough sample sizes for state-level analysis, the study uses combined data from 1977-1979, 1998-2000, 2005-2007, and 2008-2010. The study is based on Census income data that have been adjusted to account for inflation, the impact of federal taxes, and the cash value of food stamps, housing vouchers, and other government transfers, such as Social Security and welfare benefits.
Realized capital gains and losses are not included, due to data limitations. As a result, our results show somewhat less inequality than would be the case were we to include realized capital gains.
In this analysis, changes in income inequality are determined by calculating the income gap — i.e., the ratio between the average household income in the top fifth of the income spectrum and the average household income in the bottom fifth (or the middle fifth) — and examining changes in this ratio over time. These changes are then tested to see if they are statistically significant.
States fall into one of two categories: (1) those where inequality increased (that is, the ratio increased by a statistically significant amount), or (2) those where there was no change in inequality (the change in the ratio was not statistically significant). In no state did inequality fall by a statistically significant amount.
Similarly, income gaps between high- and middle-income households remain large.
- Nationally, the average income of the richest fifth of households was 2.7 times that of the middle fifth. The five states with the largest such gaps are New Mexico, California, Georgia, Mississippi, and Arizona.
Gaps Separating High-Income Households from Others Grew Prior to Recession
The long-standing trend of growing income inequality continued between the late 1990s and the mid-2000s.[1]
- On average, incomes fell by close to 6 percent among the bottom fifth of households between the late 1990s and the mid-2000s, while rising by 8.6 percent among the top fifth. Incomes grew even faster — 14 percent — among the top 5 percent of households.
- In 45 states and the District of Columbia, average incomes grew more quickly among the top fifth of households than among the bottom fifth between the late 1990s and the mid-2000s. In no state did the bottom fifth grow significantly faster than the top fifth.
Similarly, households in the middle of the income distribution fell further behind upper-income households in most states between the late 1990s and the mid-2000s.
- On average, incomes grew by just 1.2 percent among the middle fifth of households between the late 1990s and the mid-2000s, well below the 8.6 percent gain among the top fifth. Income disparities between the top and middle fifths increased significantly in 36 states and declined significantly in only one state (New Hampshire).
An examination of income trends over a longer period — from the late 1970s to the mid-2000s — shows that inequality increased across the country.
- In every state plus the District of Columbia, incomes grew faster among the top fifth of households than the bottom fifth. Nationally, the richest fifth of households enjoyed larger average income gains in dollar terms each year ($2,550, after adjusting for inflation) than the poorest fifth experienced during the entire three decades ($1,330).
- Middle-income households also lost ground compared to those at the top. In all 50 states plus the District of Columbia, the income gap between the average middle-income household and the average household in the richest fifth widened significantly over this period.
Top 5 Percent of Households Pulling Away Even Faster
The widening income gap is even more pronounced when one compares households in the top 5 percent of the income distribution to the bottom 20 percent over the last three decades. We conducted this part of our analysis for the 11 large states that have sufficient observations in the Current Population Survey to allow the comparison of the average income of the top 5 percent of households between different time periods.[2]
- In these 11 large states, the average income of the top 5 percent rose between the late 1970s and mid-2000s by more than $100,000, after adjusting for inflation . (In New Jersey and Massachusetts, the increase exceeded $200,000.) By contrast, the largest increase in average income for the bottom fifth of households in these states was only $5,620. In New York, for example, average incomes grew by $194,000 among the top 5 percent of households but by less than $250 among the bottom fifth of households.
- In the 11 states, the incomes of the top 5 percent of households increased by 85 percent to 162 percent between the late 1970s and mid-2000s. By contrast, incomes of the bottom fifth of households didn’t grow by more than 27 percent in any of these states, and in one state —Michigan – they actually fell.
- The average income of the top 5 percent pulled away from those in the middle as well. In the late 1970s, the incomes of the top 5 percent were 2.5 to 3 times those of the middle fifth in these 11 states. By the 2000s they were more than 4 times as much in all 11 states.
Causes of Rising Inequality
Several factors have contributed to the large and growing income gaps in most states.
- Growth in wage inequality. This has been the biggest factor. Wages at the bottom and middle of the wage scale have been stagnant or have grown only modestly for much of the last three decades. The wages of the very highest-paid employees, in contrast, have grown significantly.
The erosion weakness of wage growth for workers at the bottom and middle of the income scale reflects a variety of factors. Over the last 30 years, the nation has seen increasingly long periods of high unemployment, more intense competition from foreign firms, a shift in the mix of jobs from manufacturing to services, and advances in technology that have changed jobs. The share of workers in unions also fell significantly. At the same time, the share of the workforce made up of households headed by women — which tend to have lower incomes — has increased. Government policies such as the failure to maintain the real value of the minimum wage and to adequately fund supports for low-wage workers as well as changes to the tax code that favored the wealthy have also contributed to growing wage inequality.
Only in the later part of the 1990s did this picture improve modestly, as persistent low unemployment, an increase in the minimum wage, and rapid productivity growth fueled real wage gains at the bottom and middle of the income scale. Yet those few years of more broadly shared growth were insufficient to counteract the decades-long pattern of growing inequality. Today, inequality between low- and high-income households — and between middle- and high-income households — is greater than it was in the late 1970s or the late 1990s. - Government policies. Government actions — and, in some cases, inaction — have contributed to the increase in wage and income inequality in most states. Examples include deregulation and trade liberalization, the weakening of the safety net, the lack of effective laws concerning the right to collective bargaining, and the declining real value of the minimum wage. In addition, changes in federal, state, and local tax structures and benefit programs have, in many cases, accelerated the trend toward growing inequality emerging from the labor market.
- Expansion of investment income. Forms of income such as dividends, rent, interest, and capital gains, which primarily accrue to those at the top of the income structure, rose substantially as a share of total income during the 1990s. (Our analysis captures only a part of this growth, as we are not able to include capital gains income due to data limitations.) The large increase in corporate profits during the economic recovery after the 2001 recession also widened inequality by boosting investors’ incomes.
States Can Mitigate the Growth in Inequality
Growing income inequality not only raises basic issues of fairness, but also adversely affects the nation’s economy and political system. While it results to a significant degree from economic forces that are largely outside state policymakers’ control, state policies can mitigate the effects of these outside forces. State options include:
- Raise, and index, the minimum wage. The purchasing power of the federal minimum wage is 13 percent lower than at the end of the 1970s. Its value falls well short of the amount necessary to meet a family’s needs, especially in states with a high cost of living. States can help raise wages for workers at the bottom of the pay scale by enacting a higher state minimum wage and indexing it to ensure continued growth in the future.
- Improve the unemployment insurance system. Unemployment insurance helps prevents workers who lose their jobs from falling into poverty and keeps them connected to the labor market. Yet some states have cut benefits deeply. These states should restore those cuts and others should build on recent efforts to fix outmoded rules that bar many workers from accessing benefits.
- Make state tax systems more progressive. The federal income tax system is progressive — that is, it narrows income inequalities — but has become less so over the past two decades as a result of changes such as the 2001 and 2003 tax cuts. Nearly all state tax systems, in contrast, are regressive. This is because states rely more on sales taxes and user fees, which hit low-income households especially hard, than on progressive income taxes. (The income inequality data in this report reflect the effects of federal taxes but not state taxes.)
Many states made their tax systems more regressive during the 1990s. Early in the decade, when a recession created budget problems, states were more likely to raise sales and excise taxes than income taxes. Later in the decade, when many states cut taxes in response to the strong economy, nearly all made the majority of the cuts in their income taxes rather than sales and excise taxes.
There are many ways a state can make its tax system more progressive. For example, it can reduce its reliance on sales taxes. States can offset the impact of state taxes on those least able to pay by enacting or expanding tax credits targeted to low-income taxpayers. For example, more states could follow the lead of the 24 states that have adopted earned income tax credits.
As state revenues slowly recover from the recent recession, some states are cutting taxes. The bulk of the tax cuts enacted this year, however, disproportionately benefited higher-income families. If these trends continue, states will make their tax systems even more regressive and diminish their ability to restore the large spending cuts of the last few years. Strengthen the safety net. States play a major role in delivering social safety net assistance, which pushes back against growing inequality by helping low-wage workers move up the income ladder and shielding the nation’s most vulnerable citizens from the long-term effects of poverty.
Table A
Top Ten States for Selected Income Inequality MeasuresGreatest Income Inequality Between the Top and the Bottom, Late-2000s Greatest Income Inequality Between the Top and the Middle, Late-2000s 1. New Mexico 1. New Mexico 2. Arizona 2. California 3. California 3. Georgia 4. Georgia 4. Mississippi 5. New York 5. Arizona 6. Louisiana 6. New York 7. Texas 7. Texas 8. Massachusetts 8. Oklahoma 9. Illinois 9. Tennessee 10. Mississippi 10. Louisiana Greatest Increases in Income Inequality Between the Top and the Bottom,
Late 1990s to Mid-2000sGreatest Increases in Income Inequality Between the Top and the Middle,
Late 1990s to Mid-2000s1. Mississippi 1. Mississippi 2. South Dakota 2. New Mexico 3. Connecticut 3. Illinois 4. Illinois 4. South Dakota 5. Alabama 5. Alabama 6. Indiana 6. Connecticut 7. Massachusetts 7. Missouri 8. Colorado 8. Colorado 9. Kentucky 9. Florida 10. New Mexico 10. Oregon Greatest Increases in Income Inequality Between the Top and the Bottom,
Late 1970s to Mid-2000sGreatest Increases in Income Inequality Between the Top and the Middle,
Late 1970s to Mid-2000s1. Connecticut 1. Connecticut 2. Massachusetts 2. California 3. New York 3. Oklahoma 4. Kentucky 4. New York 5. Illinois 5. New Mexico 6. California 6. Illinois 7. West Virginia 7. Oregon 8. Colorado 8. Texas 9. Rhode Island 9. Massachusetts 10. Mississippi 10.Rhode Island
There are a host of options states can consider to strengthen their safety nets. States can create a more streamlined process for enrolling in work supports such as food stamps and child care as they retool their health insurance systems under the Affordable Care Act. States also can boost the prospects of poor children by increasing temporary cash assistance to the neediest families in state Temporary Assistance for Needy Families (TANF) programs. Improving access to SNAP (food stamps) and providing assistance with rent can help low-income families afford food and housing.
In addition, states can improve the child care system by providing child care subsidies with affordable co-payments and by investing in quality early care and education programs as well as after-school programs.- Protect workers’ rights. States can raise wages by protecting workers right to bargain collectively and by strengthening and enforcing laws and regulations to prevent abusive employer practices that deprive workers of wages that they are legally owed.
While these are all useful steps, federal as well as state policies will have to play an important role if low- and middle-income households are to stop receiving steadily smaller shares of the income pie.
State infographics
| Illinois | ||
| North Carolina | ||
Click on map to see state-specific data
End Notes
[1] The late 1990s are compared to the mid-2000s (rather than to more recent years) because these periods reflect comparable points in the economic cycle — namely, when the economy was at or near a peak. These peak periods are compared to show how inequality has changed. Currently, the nation is in the middle of an economic cycle that started when the economy began to expand in 2009. It is too soon to track the changes in inequality during the current economic cycle at the state level.
[2] These states are California, Florida, Illinois, Massachusetts, Michigan, New Jersey, New York, North Carolina, Ohio, Pennsylvania, and Texas.
More from the Authors

Areas of Expertise