New School Year Brings More Cuts in State Funding for Schools
To view the updated paper see:
Most States Funding Schools Less Than Before the Recession
States have made steep cuts to education funding since the start of the recession and, in many states, those cuts deepened over the last year. Elementary and high schools are receiving less state funding in the 2012-13 school year than they did last year in 26 states, and in 35 states school funding now stands below 2008 levels — often far below.
States made these cuts after the deepest recession in 70 years hit beginning in late 2007, precipitating a historic collapse in state revenues. Because states relied heavily on spending reductions in response to the recession, rather than on a more balanced mix of spending cuts and revenue increases, funding for schools and other public services fell sharply. While emergency aid from the federal government reduced the severity of cuts to school funding in the years immediately following the onset of the recession, Congress allowed that aid largely to expire at the end of the 2011 fiscal year, before state revenues had recovered from the recession.
Our review of budget documents for the 48 states that publish education budget data in a way that allows historic comparisons finds that:
- Twenty-six states are providing less funding per student to local school districts in the new school year than they provided a year ago. These funding cuts have been modest, but, in many states, they come on top of severe cuts made in previous years.
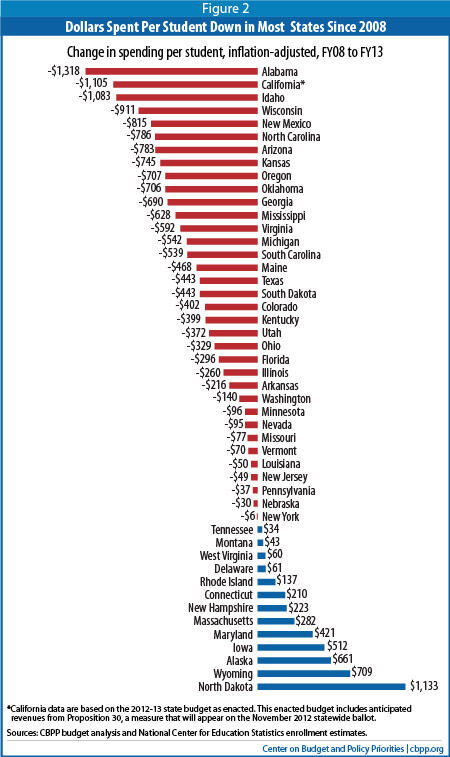
- Some states are beginning to restore their school funding over the past year, but those restorations are, for the most part, far from sufficient to make up for cuts in past years. For example, Florida is increasing school funding by $273 per pupil this year. But that is not nearly enough to offset the state’s $569 per-pupil cut over the previous four years.
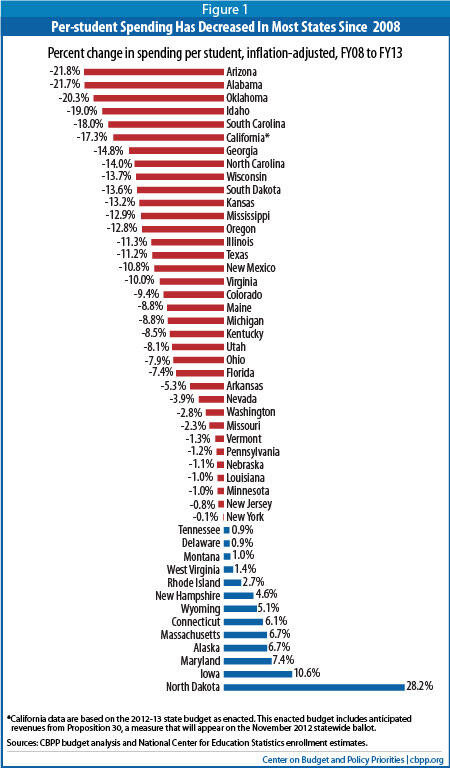
- As a result, school funding remains well below pre-recession levels. Thirty-five states are providing less funding per student than they did five years ago.
- Seventeen states have cut per-student funding by more than 10 percent from 2008 levels.
- Three states — Arizona, Alabama, and Oklahoma — each have reduced per-pupil funding to K-12 schools by more than 20 percent. (These figures, like all the comparisons in this paper, are in inflation-adjusted dollars and focus on the primary form of state aid to local schools.)
Restoring school funding should be an urgent priority. The steep state-level K-12 spending cuts of the last several years have serious consequences for the nation.
- State-level K-12 cuts have large consequences for local school districts. Some 44 percent of total education expenditures in the United States come from state funds (the share varies by state).[2] Cuts at the state level mean that local school districts have to either scale back the educational services they provide, raise more local tax revenue to cover the gap, or both. In particular, cuts in state aid may disproportionately affect school districts with high concentrations of children in poverty. States typically distribute general education aid through formulas that target additional funds to school districts with large shares of low-income and other high-need children and/or with lower levels of taxable wealth. As a result, reductions in “formula” funding may result in particularly deep cuts in general state aid for less-wealthy, higher-need districts unless a state goes out of its way to protect them.
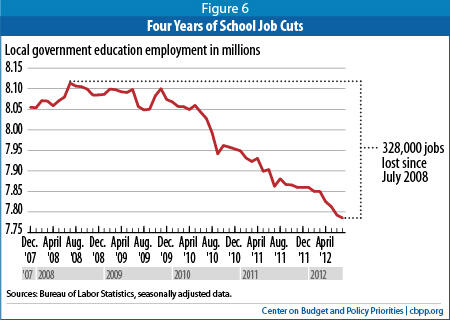
- The cuts extended the recession and slowed the recovery. Federal employment data show that school districts began reducing the overall number of teachers and other employees in July 2008, when the first round of budget cuts began taking effect. Since then, schools have been shedding jobs steadily; nationwide, schools have cut jobs in 10 of the last 12 months.Image
As of July 2012, local school districts had cut 328,000 jobs nationally compared with 2008. These job losses have reduced the purchasing power of workers’ families, in turn reducing overall consumption in the economy and thus extending the recession and slowing the pace of recovery. - The cuts counteract and sometimes undermine education reform and more generally hinder the ability of school districts to deliver high-quality education, with long-term negative consequences for the nation’s economic competitiveness. Many states and school districts have undertaken important school reform initiatives to prepare children better for the future, but deep funding cuts hamper their ability to implement many of these reforms, particularly in areas like lengthening the school day and expanding early childhood education. At a time when the nation is trying to produce workers with the skills to master new technologies and adapt to the complexities of a global economy, large cuts in funding for basic education threaten to undermine a crucial building block for future prosperity.
- Local school districts typically have little ability to replace lost state aid on their own. Given the sorry state of many of the nation’s real estate markets, it is difficult for many school districts to raise more money from the property tax without raising rates, and rate increases are often politically very difficult. Property tax collections were actually 2.8 percent lower in the 12-month period ending in March 2012 than they were the previous year, after adjusting for inflation. However, at least some localities are considering, and in some cases enacting, property tax increases — a sign of the challenges that schools face.Image
States Are Cutting K-12 Education Formulas — the Primary Funding Source for Schools
State aid is a major source of funding for K-12 schools. On average, some 44 percent of total education expenditures in the United States come from state funds; the share varies by state. States typically distribute most of this funding through formulas that allocate money to school districts, with some funds often targeted to districts that have higher levels of student need (e.g., more students from low-income families) and less ability to raise funds from local property taxes and other local revenues.
Cuts to state formula funding often have very large consequences for local school districts. Such cuts mean that local school districts must either scale back the educational services they provide, raise more revenue to cover the gap, or both. In addition to the funding distributed through general aid formulas, states may or may not use separate allocations to fund items such as pupil transportation, contributions to school employee pension plans, and teacher training; some of those allocations also have been cut.
Since states typically distribute general education aid through formulas that target additional funds to school districts with large shares of low-income and other high-need children, reductions in formula funding may result in particularly deep cuts in general state aid for districts with high concentrations of low-income students.
School Funding in 2012-13 Compared with 2007-08
Based on the data available in these 48 states, cuts to state education formula funding since the start of the recession have been widespread and very deep. This survey finds that, after adjusting for inflation:
- More than two-thirds of states — 35 of the 48 states surveyed — are providing less per-student funding for K-12 education in the current 2013 fiscal year than they did in fiscal year 2008.
- In more than one-third, or 17 of the 48 states, per-student funding is 10 percent or more below pre-recession levels.
- The three states with the deepest cuts — Arizona, Alabama, and Oklahoma — each have reduced per-student funding by more than 20 percent from pre-recession levels.
- The worst year of the recession for school funding cuts was last year, the 2012 fiscal year, the first year after most emergency federal aid had expired. That year, 34 states cut per-pupil spending. The median cut among these states was 5 percent.
School Funding in 2012-13 Compared with 2011-12
The majority of states cut their per-pupil school funding in the last year. These cuts generally have been modest, but in many states they come on top of severe cuts in previous years, leaving state funding for schools far behind pre-recession levels.
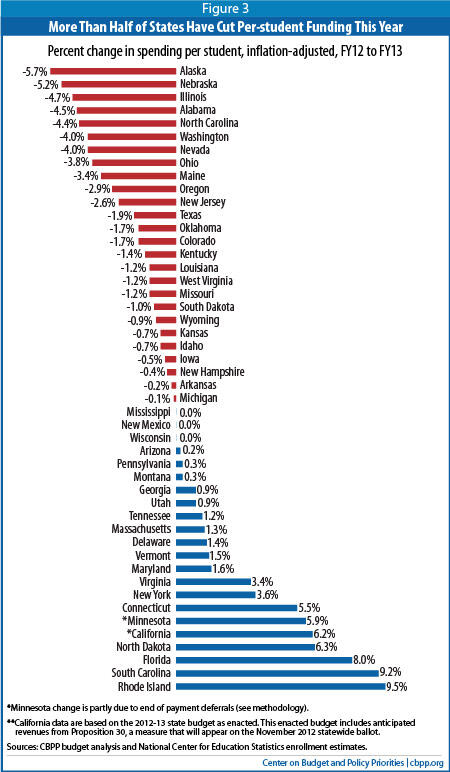
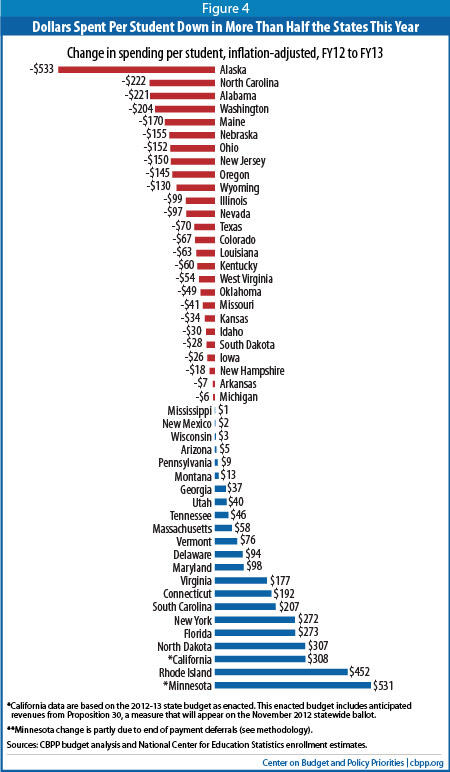
- In 26 states, per-student funding is lower in the current fiscal year (2013), than it was in the last fiscal year (2012), after adjusting for inflation. Among these states the median cut was $68, or 1.7 percent.
- A number of states increased funding for the current school year, but these increases generally have left per-pupil spending far below pre-recession levels. For example, Florida increased education funding by $273 per pupil this year. But that was not nearly enough to offset the state’s $569 per-pupil cut over the previous four years. South Carolina increased per-pupil funding by $207 in fiscal year 2013, an increase that pales in comparison to the $746 cut the state made between fiscal years 2008 and 2012.
These cuts are occurring at a time when schools face demands from parents, employers, and civic leaders to bring greater numbers of students to higher levels of academic proficiency, in large part because workers will increasingly need higher levels of educational attainment to thrive in the workforce.
Why a Few States Have Increased Education Funding
While most states have cut spending on education since the recession hit, as the figures in this analysis show, a few states have boosted it. A few states, such as Alaska, Montana, North Dakota, and Wyoming, have significant oil and gas resources and therefore have not suffered the same level of economic problems as other states, and thus they have enacted fewer budget cuts. In other states, the growth in spending reflects policymakers’ prioritization of education funding in the face of fiscal stress. For example, Maryland was already embarking on a program of increased state aid for local school districts when the recession hit, and chose largely to protect that program. (Maryland also raised significant amounts of revenue after the onset of the recession, which lessened the need to scale back education funding.) Spending growth in Massachusetts and Iowa reflects lawmakers’ decisions to maintain education funding even as these states cut programs in other areas.
Why This Happened
- Revenues remain depressed. The recession of 2007-09 and the slow recovery continue to affect state budgets and schools. With unemployment still high and housing values still depressed, people have both less income and purchasing power. So states are receiving less income and sales tax revenue, which are the main sources of revenue states use to fund education and other services.
State revenues are starting to improve across the country. In the 12-month period ending in March 2012, state tax revenues grew 6.6 percent. But revenues remain 5 percent below 2008 levels after adjusting for inflation, and it will be many years before they are able to return to funding services like K-12 education at pre-recession levels. - Costs are rising. The costs of state funded services have increased since the recession began, due to inflation, demographic changes, and rising needs. For example, in the current school year, the U.S. Department of Education estimates that there are about 535,000 more K-12 students and 2.5 million more public college and university students than there were in 2007-08.[4] Some 4.8 million more people are projected to be eligible for subsidized health insurance through Medicaid in 2012 than were enrolled in 2008, as employers have cancelled their coverage and people have lost jobs and wages.[5]
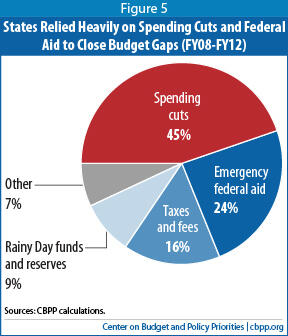
- States have avoided raising new revenues. States have disproportionately relied on spending cuts to close the very large budget shortfalls they have faced over the last several years, rather than a more balanced mix of spending cuts and revenue increases. Between fiscal years 2008 and 2012, states closed 45 percent of their budget gaps through spending cuts, and only 16 percent of their budget gaps through taxes and fees (they closed the remainder of their shortfalls with federal aid, reserves, and various other measures; see Figure 5). States could have lessened the need for deep cuts to education funding and made more progress in restoring the funding that has been lost if they had been more willing to raise additional revenue.
- The federal government allowed aid to states to expire prematurely. States used emergency fiscal relief from the federal government (including both education aid and other forms of state fiscal relief) to cover a significant share of their shortfalls through the 2011 fiscal year. After the 2011 fiscal year, the federal government largely allowed this aid to expire, even though states continued to face very large shortfalls in 2012 and beyond. The expiration of most federal aid the end of the 2011 fiscal year is a key reason why state education funding dropped so sharply in the 2012 fiscal year, and remains suspended at such low levels.
Not only has the federal government allowed aid to states to expire, federal policymakers are moving ahead with plans to cut ongoing federal funding for states and localities, thereby making state fiscal conditions even worse. The federal government already has cut non-defense discretionary spending by 9 percent in real terms since 2010. (Discretionary spending is spending that must be renewed on an annual basis, as opposed to mandatory spending, which funds programs like Social Security, and which is not subject to the annual appropriations process.) Discretionary spending caps established in the federal debt limit deal last summer will result in an additional 7 percent cut by 2022. This additional cut would grow to 12 percent by 2022 if “sequestration” — the automatic, across-the-board cuts also established in the debt limit deal — is allowed to take effect.
About one-thirdof non-defense discretionary spending flows through state and local governments, and of that a sizeable share (about one-quarter) funds education. Large cuts in federal funding to states and localities would worsen state budget problems, increasing the need for additional cuts in education spending, and making it harder for states to restore the funding that has been lost.
Moreover, an approach to federal deficit reduction that avoids raising additional revenue would likely result in even deeper cuts. For example, the House passed a deficit-reduction plan earlier this year that does not raise significant new revenue. That plan would produce cuts to state aid programs some three times as deep as those imposed under sequestration.[6]
K-12 Education Cuts Have Serious Consequences
States’ large cuts in spending on education have serious consequences for the economy, in both the short and long term. Not only do they directly impact jobs, but they also counteract and sometimes undermine important state education reform initiatives, and put upward pressure on local property taxes.
Damage to the Economy, Now and in the Future
State education budget cuts are deepening the recession and slowing the pace of economic recovery by reducing overall economic activity. The spending cuts have forced school districts to lay off teachers and other employees, reduce pay for the education workers who remain, and cancel contracts with suppliers and other businesses. All of these steps remove consumer demand from the economy, which in turn discourages businesses from making new investments and hiring.
Local school districts already have eliminated 328,000 jobs nationally since July 2008, federal data show. (Normally, local education employment grows each year in large part to keep pace with an expanding student population.) In addition, education spending cuts have cost an unknown but probably very large number of additional jobs in the private sector as school districts have canceled or scaled back private-sector purchases and contracts (for instance, purchasing fewer textbooks). These job losses shrink the purchasing power of workers’ families, which in turn affects local businesses and slows recovery. While it is not possible to calculate directly the additional loss of jobs resulting from state education budget cuts, it appears very likely that school districts will continue to cut jobs and also to cut funding for some private-sector jobs, negating some of the job growth that otherwise would occur in the economy as a whole.
In the long term, the savings from today’s cuts may cost states much more in diminished economic growth. To prosper, businesses require a well-educated workforce. The deep education spending cuts states have enacted will weaken that workforce in the future by diminishing the quality of elementary and high schools. At a time when the nation is trying to produce workers with the skills to master new technologies and adapt to the complexities of a global economy, large cuts in funding for basic education undermine a crucial building block for future prosperity.
Undermining Education Reform
State education cuts are counteracting and sometimes undermining reform initiatives that many states are undertaking with the federal government’s encouragement, such as supporting professional development to improve teacher quality, improving interventions for young children to heighten school readiness, and turning around the lowest-achieving schools, to name just a few. As U.S. Secretary of Education Arne Duncan has said, “It is very difficult to improve the quality of education while losing teachers, raising class size, and eliminating after-school and summer school programs.”[7]
Some education reforms have moved forward despite reductions in state education funding. But deep cuts in state spending on education counteract and sometimes undermine reform initiatives both by limiting the funds generally available to improve schools, and by cutting specific reform initiatives. For example:
- Research suggests that teacher quality is the most important school-based determinant of student success.[8] For that reason recruiting, developing, and retaining high-quality teachers is widely thought to be critical to improving student achievement. But these tasks are more difficult when school districts are cutting their budgets. Since teacher salaries make up a large share of public education expenditures, funding cuts inevitably restrict districts’ ability to expand teaching staffs and supplement wages. Indeed, numerous school districts have reduced teacher wages through furloughs since the start of the recession and have resorted to hiring freezes.
- There is evidence to suggest that smaller class sizes can boost achievement, especially in the early grades and for low-income students. Yet small class sizes are difficult to sustain when schools are cutting teaching positions while enrollments increase. Indeed, a survey of school administrators found that 54 percent of respondents increased class sizes for the 2011-12 school year and 57 percent anticipate doing so for the 2012-13 school year.[9]
- Many education policy experts believe that more student learning time can improve achievement.[10] In a number of states and school districts, however, budget cuts are making it more difficult to extend instructional opportunities. For example, the Los Angeles and Philadelphia school districts and several Florida districts have significantly scaled back their summer school programs.[11] And a Washington Post survey in 2011 found that 292 school districts nationwide had implemented a four-day school week to cut costs.[12] Moreover, reductions in the education workforce make it less likely that schools will have adequate personnel to teach and supervise students for additional periods of time or to give additional attention to students who are having difficulty learning, despite state and federal goals to lessen disparities among achievement levels. Cuts that limit student learning time are likely to continue in the coming year. The school administrators’ survey mentioned above found that 10 percent of respondents were considering shortening the school week to four days for the 2012-13 school yearImage
- As of the 2010-11 school year, 39 states provided pre-kindergarten or pre-school programs, which served 1.3 million children.[13] A number of studies conclude that such programs can improve cognitive skills, especially for disadvantaged children.[14] In the 2010-2011 school year, 12 states cut enrollment in pre-kindergarten programs, with especially large reductions in Illinois and New York. Arizona eliminated its state-funded pre-kindergarten program. [15] Other states have scaled back pre-kindergarten programs in other ways. For example, funding cuts in Georgia last year shortened the pre-kindergarten school year from 180 days to 160 for 84,000 four-year-olds.[16]
Impact on Property Taxes and Other Local Revenues
State budget cuts are also placing upward pressure on property taxes and other local revenues, because increasing these revenues is one of the few ways school districts can compensate for the loss of state funding.
Given the precipitous decline in property values since the start of the recession and in many places the political and/or legal difficulty of raising property taxes, raising significant additional revenue through the property tax will likely be very difficult for school districts in the coming years. Indeed, property tax collections were 2.8 percent lower in the 12-month period ending in March 2012 than in the previous 12 months, after adjusting for inflation.[17]
Despite the obstacles to raising local revenues, however, at least a few districts are considering, or have already implemented, property tax increases. For example, last year the Granite School District and the Davis School District, two of the three largest school districts in Utah, raised property tax rates by 4 percent and 4 percent, respectively, to compensate for cuts in state funding and growing enrollments.[18] Jefferson County, Kentucky (the county that includes Louisville) Public Schools’ school board this year increased property taxes for the fifth year in a row, to make up for declining state and federal funding.[19]
Beyond increasing local revenues, school districts’ options for preserving education services are very limited. Some localities could divert funds from other local services to shore up school district budgets. But this would sustain education spending at the expense of services like police and fire protection.
Appendix: Methodology
The education funding totals presented in this paper reflect the funding distributed through states’ major education funding formulas. These funds include the federal funds distributed through these formulas from the American Recovery and Reinvestment Act (ARRA) State Fiscal Stabilization Fund and the Education Jobs Fund. In a few cases, the funding totals also include more narrowly targeted forms of federal education aid in ARRA, such as Title I funding.
In cases where we had sufficient data, we attributed federal funds to the year in which they were used by school districts. In other cases, we attributed this aid to the year in which it was distributed to school districts by the state.
The numbers do not include any local property tax revenue or any other source of local funding.
Additional adjustments were made to reflect the following state-specific policies or data limitations:
- California’s numbers reflect General Fund Proposition 98 spending for K-12 education. All years include child care funding which was removed from Proposition 98 spending in fiscal year 2012.
- Maryland’s numbers include funding for the state’s foundation program as well as funding for compensatory education, aid for local employee fringe benefits, formula programs for specific populations, and limited English proficiency programs.
- Minnesota withholds (or delays) a portion of state aid payments to school districts until the subsequent fiscal year. In FY 2012, the amount of this delayed payment was increased by $453 million, resulting in a one-time reduction in state funding for FY 2012 causing the growth in school funding from FY 2012 to FY 2013 to be artificially inflated. After adjusting for the effects of this funding delay, the magnitude of Minnesota’s funding growth from FY 2012 to FY 2013 would be approximately one-fifth of the level described in figures 3 and 4 and Minnesota’s rank among the states in terms of spending growth would fall significantly. Minnesota’s numbers represent formula funding for a dozen or so different programs including special education, compensatory aid (to help schools with high concentration of low-income children), Limited English Proficiency aid, operating capital, etc.
- In Nebraska, $58.6 million in federal aid was distributed to the school districts through the state’s funding formula in fiscal year 2011. The school districts were encouraged to carry these amounts forward for use in the 2011-12 school year, and there is evidence that school districts generally did so. For this reason, we have counted the entire amount as 2011-12 spending.
- New York’s numbers reflect school districts’ fiscal years (which end June 30), rather than the state’s fiscal year (which ends March 31). New York’s numbers include funding for new competitiveness performance grant programs, which reward school districts that show improvements in performance or efficiency.
- Ohio’s numbers include line items for state- and stimulus-funded foundation funding, as well as school district property tax replacement funds that are also considered to be part of the school funding formula.
- South Carolina’s numbers include employer contributions to the Education Finance Act. They do not include federal aid.
- South Dakota received federal Education Jobs funds in fiscal year 2011 but also passed legislation to encumber an equivalent amount ($26.2 million), of already appropriated state funds, requiring that amount to be held over for use in 2012 rather than 2011. For this reason, we have subtracted that amount from 2011 budgeted expenditures and added it to 2012.
- In Vermont, school property taxes are state taxes and are deposited into a state Education Fund which covers the cost of pre-K-to-12 public education. This state’s numbers represent the amount contributed to the Education Fund each year from a state General Fund appropriation, General Fund revenues dedicated to the Education Fund, and federal ARRA funds used to temporarily backfill the General Fund appropriation.
End Notes
[1] Anderson Heiman and Ram Srinivasan gathered much of the data analyzed in this report.
[2] U.S. Census Bureau, Public Elementary-Secondary Education Finance Data, 2010 data. From: http://www.census.gov/govs/school/
[3] See appendix for a detailed explanation of our methodology.
[4] U.S. Department of Education, Condition of Education 2012, tables A-3-1, A-10-1, and A-11-1.
[5] CBPP calculations based on data from the Congressional Budget Office and Centers for Medicare and Medicaid Services.
[6] See Michael Leachman, et al. “Deficit Reduction Package that Lacks Significant Revenues Would Shift Very Substantial Costs to States and Localities,” Center on Budget and Policy Priorities, August 8, 2012, https://www.cbpp.org/sites/default/files/atoms/files/8-8-12sfp.pdf
[7] Education Secretary Arne Duncan’s Testimony Before the Senate Appropriations Subcommittee on Labor, Health and Human Services, Education, and Related Agencies Regarding the FY 2011 Education Budget — April 14, 2010, http://www.ed.gov/news/speeches/secretary-arne-duncans-testimony-senate-appropriations-subcommittee
[8] See for example, “Empowering Effective Teachers: Readiness for Reform,” Bill and Melinda Gates Foundation Research Brief, February 2010, http://www.gatesfoundation.org/united-states/Documents/empowering-effective-teachers-readiness-for-reform.pdf.
[9] Noelle M. Ellerson, American Association of School Administrators, Weathering the Storm: How the Economic Recession Continues to Impact School Districts, March 2012, p. 4.
[10] See for example, Center for American Progress, “Expanded Learning Time By the Numbers,” April 22, 2010, http://www.americanprogress.org/issues/2010/04/elt_numbers.html .
[11] See for example: Mike DeNardo, “Budget Cuts Mean Summer School Only Free For Seniors This Year; Underclassmen Must Pay,” CBS Philadelphia, June 12, 2012, http://philadelphia.cbslocal.com/2012/06/12/budget-cuts-mean-summer-school-only-for-seniors-this-year-underclassmen-must-pay/; Leo Stallworth, “Budget Cuts to Summer School Leave LAUSD Students Stranded,” ABC Los Angeles, April 26, 2012, http://abclocal.go.com/kabc/story?section=news/local/los_angeles&id=8638126; Sarah Gonzalez, “No Summer School Means Some Students Repeat a Grade This Fall,” NPR State Impact, August 14, 2012, http://stateimpact.npr.org/florida/2012/08/14/no-summer-school-means-some-students-repeat-a-grade-this-fall/.
[12] Lyndsey Layton, “In Trimming School Budgets, More Officials Turn to a Four-Day Week,” Washington Post, October 28, 2011, http://www.washingtonpost.com/local/education/in-trimming-school-budgets-more-officials-turn-to-a-four-day-week/2011/10/26/gIQABsiXQM_story.html
[13] W. Steven Barnett, et. al., The State of Preschool 2011, National Institute for Early Education Research, p. 6, http://nieer.org/sites/nieer/files/2011yearbook.pdf.
[14] Ibid. See also Julia Isaacs, “State Research Brief #1: State Pre-Kindergarten,” Impacts of Early Childhood Programs, September 2008, http://www.brookings.edu/~/media/Files/rc/papers/2008/09_early_programs_isaacs/09_early_programs_brief1.pdf.
[15] W. Steven Barnett, et. al., p. 9.
[16] Martha Dalton, “Educators React to Pre-k Cuts,” Public Broadcasting Atlanta, March 10, 2011, http://pba.org/post/educators-react-pre-k-cuts.
[17] CBPP analysis of Census state and local quarterly tax data.
[18] See Rosemary Winters, “Granite School District OK’s $5 Million Tax Boost,” The Salt Lake Tribune, August 2, 2011, and “Davis School Board Approves 9.3 Percent Property Tax Increase,” Deseret News, August 17, 2011.
[19] Antoinette Konz, “JCPS School Board Votes to Raise Taxes 3.4%,” Courier-Journal, August 28, 2012, http://www.courier-journal.com/article/20120827/NEWS01/308270051/JCPS-school-board-votes-raise-taxes-3-4-?odyssey=nav|head .
More from the Authors

Areas of Expertise